

Abstract
In humans, maximal aerobic power ( ) is associated with a plateau in cardiac output (
 ), but the mechanisms regulating the interplay between maximal heart rate (HRmax) and stroke volume (SV) are unclear. To evaluate the effect of tachycardia and elevations in HRmax on cardiovascular function and capacity during maximal exercise in healthy humans, 12 young male cyclists performed incremental cycling and one-legged knee-extensor exercise (KEE) to exhaustion with and without right atrial pacing to increase HR. During control cycling,
  and leg blood flow increased up to 85% of maximal workload (WLmax) and remained unchanged until exhaustion. SV initially increased, plateaued and then decreased before exhaustion (P < 0.05) despite an increase in right atrial pressure (RAP) and a tendency (P = 0.056) for a reduction in left ventricular transmural filling pressure (LVFP). Atrial pacing increased HRmax from 184 ± 2 to 206 ± 3 beats min−1 (P < 0.05), but
  remained similar to the control condition at all intensities because of a lower SV and LVFP (P < 0.05). No differences in arterial pressure, peripheral haemodynamics, catecholamines or
  were observed, but pacing increased the rate pressure product and RAP (P < 0.05). Atrial pacing had a similar effect on haemodynamics during KEE, except that pacing decreased RAP. In conclusion, the human heart can be paced to a higher HR than observed during maximal exercise, suggesting that HRmax and myocardial work capacity do not limit
  in healthy individuals. A limited left ventricular filling and possibly altered contractility reduce SV during atrial pacing, whereas a plateau in LVFP appears to restrict
  close to
  .
.
Key points
During high intensity whole-body exercise, systemic and contracting skeletal muscle O2 delivery and uptake (
 >) are compromised, but the underlying mechanisms remain unclear.
We evaluated the effect of a ∼20 beats min−1 increase in heart rate (HR) by right atrial pacing during incremental cycling and knee-extensor exercise on cardiac output (
 ) and stroke volume (SV).
An increase in HR during both exercise modalities did not alter
 due to a proportional decrease in SV.
The lower SV during atrial pacing in the cycling trial was associated with a diminished cardiac filling pressure, but similar arterial pressure.
The results demonstrate that the human heart can achieve a higher HR than observed during maximal exercise, suggesting that HRmax and myocardial work capacity do not limit cardiac performance in trained human subjects.
Instead, restrictions in ventricular filling appear to compromise cardiac preload, SV and
 at exercise intensities close to
  .
.
Introduction
During high intensity whole-body exercise, systemic and contracting skeletal muscle O2 delivery and uptake ( ) are compromised as cardiac output (
 ) and exercising limb blood flow are attenuated despite an increase in metabolic demand (Åstrand et al. 1985; González-Alonso & Calbet, 1971; Mortensen et al. 1962, 2006; Calbet et al. 1958; Trinity et al. 1972). This is indicative of an important circulatory limitation to maximal oxygen uptake (
 ) and high intensity exercise performance (González-Alonso & Calbet, 1971; Mortensen et al. 1962; Levine, 1992). The blunted
  close to
  is associated with the attainment of maximal heart rate (HRmax) (Lakatta et al. 2012) and a plateau or even a decrease in stroke volume (SV) (González-Alonso & Calbet, 1971; Mortensen et al. 1962, 2006; Trinity et al. 1972). Whether HRmax imposes a limitation to
  and consequently systemic O2 delivery and
  during whole body exercise or whether HR can be increased during atrial pacing to levels above the HRmax observed during maximal exercise has not been tested in humans. In steady state resting conditions and during submaximal one-legged knee-extensor exercise (KEE),
  is regulated mainly by peripheral O2 demand (González-Alonso et al. 2004; Hellsten et al. 1962), and moderate changes in HR do not alter the
  response (Guyton, 2006; Sheriff et al. 1988; González-Alonso et al. 2004; Bada et al. 1985; Mortensen et al. 2005). Whether this also applies to maximal exercise when the cardiovascular system is operating at or close to its capacity remains unknown.
The potential intrinsic and extrinsic factors impairing SV close to  are ventricular filling time, cardiac afterload, ventricular function, contractility and/or venous return (Poliner et al. 1971; Seed & Walker, 1993; Rowell, 2008). Evidence for a limited ventricular preload by reductions in ventricular filling time can be found in exercising dogs, where SV and
  are reduced when HR is increased to above 170 beats min−1 by ventricular pacing (Templeton et al. 1986; Weisfeldt et al. 2006; Sheriff et al. 1988). Whether that phenomenon applies to exercising healthy humans remains unknown, but end-diastolic volume does not increase from moderate to maximal upright cycling (Stöhr et al. 1962), and a decreased end-diastolic volume has been observed in resting humans when HR was increased by pacing (Parker et al. 2007). An increase in central venous pressure is generally interpreted as beneficial for ventricular filling, but has also been suggested to impair venous return by reducing the perfusion gradient from the active limbs to the heart (Guyton, 2006). Despite the increase in blood pressure during maximal exercise, the increase in afterload does not appear to play a major role in the restricted SV as end-systolic volume is not compromised close to
  (Stöhr et al. 1962). Apart from the central factors, peripheral vasoconstriction might blunt venous return to the heart (Strandell & Shepherd, 2004; Pawelczyk et al. 2006; Lundby et al. 2008; Saltin & Mortensen, 1974) as vascular conductance in the active limbs is attenuated during cycling, despite an increase in the metabolic demand (Knight et al. 1985; Rosenmeier et al. 1980; Mortensen et al. 1962, 2006). Thus, the combined effect of peripheral vasoconstriction and alterations in cardiac filling pressures, ventricular filling time and afterload could compromise SV and
  close to
  .
.
The purpose of the present study was to investigate the effect of an increase in HR on systemic and peripheral haemodynamics during maximal exercise under conditions where the central circulation is operating at (with a large active muscle mass) or below (with a small active muscle mass) its capacity. To accomplish these aims, we measured systemic and peripheral haemodynamics, O2 transport and  during incremental cycling and KEE to exhaustion with and without an increase in HR induced by right atrial pacing. We hypothesized that an increase in HR at submaximal exercise intensities would not alter
  because of compensatory adjustments in SV and that a higher HRmax would not enhance cardiovascular capacity either for small or for large muscle mass exercise.
Methods
Twelve endurance trained male cyclists with an age of 27 ± 1 (mean ± SEM) years, body weight of 76.1 ± 2.0 kg, height of 182 ± 3 cm and  of 4.7 ± 0.1 l min−1 (62 ± 1 ml min−1 kg−1) participated in the study. All subjects had a normal electrocardiogram and they were not taking any medication. The subjects were informed about potential risks and discomforts associated with the experiments before providing their informed written consent to participate. The study was approved by the Ethical committee of the Capital Region of Denmark (H-4-2009-097) and conducted in accordance with the guidelines of the declaration of Helsinki. No complications were observed with regard to the invasive procedures in any of the participants.
Experimental protocol
The study included a preliminary test day, a familiarization day and an experimental day. On the first visit to the laboratory, the subjects performed incremental cycling (Excalibur Sport, Lode, The Netherlands) and KEE to determine peak workloads, HRmax (Polar S810; Polar Electro Oy, Kempele, Finland) and time to exhaustion. The maximal workloads were used to determine the workloads for the experimental trial. During the familiarization session, the subjects carried out the same protocol as during the main experiment while continuous measures of pulmonary  and HR were obtained.
On the day of the experiment, the subjects had a light breakfast before 07.00 h and reported to the laboratory at 08.00 h. After 30 min of supine rest, five catheters were inserted under local anaesthesia: (1) a 20 G catheter was placed in the left radial artery, (2) a 18 G catheter was inserted in the femoral vein in the retrograde direction, (3) a catheter was placed in the same femoral vein in the anterograde direction, and a thermistor to measure venous blood temperature was advanced through this catheter, (4) a catheter (131HF7; Edwards Lifesciences, Irvine, CA, USA) was placed under pressure guidance in the pulmonary artery via a left antecubital vein and (5) a screw-in pacing catheter (Tendril ST; St. Jude Medical, Sylmar, CA, USA) was under X-ray guidance advanced through a sheath in the right internal jugular vein to the auricle of the right atrium (supplemental Fig. S1).
Following 30 min of rest, the subjects performed incremental cycling and KEE to exhaustion with and without right atrial pacing (AAI mode; Medtronic, Minneapolis, MN, USA) to increase HR by ∼20 beats min−1 above the normal individual values at each exercise stage (Table1 and supplemental Fig. S2). All trials were separated by 60 min of supine rest. The trials were preceded by 15 min of warm-up (120 W during cycling and 12 W during KEE) followed by 3 min of rest where the subjects were allowed to move their legs at 0 W. During both cycling and KEE, the workload was increased every 2 min to elicit 25, 40, 55, 70, 85 and 100% of the individual maximal workload (WLmax). Exercise was performed at ∼22°C with a fan directed against the back of the subjects. The order of the control and pacing trials was randomized, but the KEE trials were performed after the cycling trials.
Table 1.
Heart rates during incremental cycling and one-legged knee-extensor exercise with and without right atrial pacing (% maximal workload)
| Baseline | 25% | 40% | 55% | 70% | 85% | 100% | |
|---|---|---|---|---|---|---|---|
| Cycling | |||||||
| Control trial | 87 ± 6 | 121 ± 5 | 140 ± 4 | 152 ± 4 | 168 ± 3 | 178 ± 2 | 184 ± 2 |
| Pacing trial | 109 ± 4* | 138 ± 3* | 157 ± 3* | 171 ± 3* | 187 ± 4* | 200 ± 3* | 206 ± 3* |
| Knee-extensor exercise | |||||||
| Control trial | 76 ± 3 | 94 ± 3 | 102 ± 2 | 107 ± 3 | 117 ± 4 | 132 ± 4 | 148 ± 4 |
| Pacing trial | 102 ± 6* | 113 ± 4* | 126 ± 3* | 129 ± 3* | 138 ± 4* | 153 ± 5* | 166 ± 4* |
Data are mean ± SEM for 12 subjects.
Different from control (P < 0.05).
Measurements
In all trials, blood samples (1–5 ml) were drawn simultaneously from the radial and pulmonary arteries and the femoral vein before the start of the incremental test and after 1.5 min of exercise at each workload. Pulmonary  was measured online (Quark CPET system; Cosmed, Rome, Italy). HR was obtained from an electrocardiogram while arterial pressure, pulmonary artery pressure (PAP), right atrial pressure (RAP) and femoral venous pressure (FVP) were monitored with transducers (Pressure Monitoring Kit, Baxter, CA, USA) positioned at the level of the heart (arterial, PAP and RAP) or at the level of the thigh (FVP) and connected to a monitor (Dialogue 2000; Danica Elektronic, Copenhagen, Denmark). Determination of pulmonary capillary wedge pressure (PCWP) was performed immediately after blood sampling. Leg blood flow (LBF) was measured with the constant infusion thermodilution technique (Andersen & Saltin, 1985) immediately before and after blood sampling. All blood pressures, temperatures and electrocardiogram were recorded via a data acquisition system for analysis (PowerLab 16/30; ADInstruments, Bella Vista, Australia).
Analytical procedures
Blood gas variables, haemoglobin (Hb), glucose and lactate were measured using an ABL725 analyser (Radiometer, Copenhagen, Denmark) and corrected to body temperature using the temperature in either the femoral vein (femoral venous) or the right atrium (radial and pulmonary artery).  was calculated using the Fick equation (
 =
=  /a-vO 2 difference). SV was the quotient between
  and HR, systemic vascular conductance (SVC) was the quotient between
  and perfusion pressure (mean arterial pressure (MAP) – RAP) and leg vascular conductance (LVC) was the quotient between LBF and perfusion pressure (MAP – FVP).
Arterial pressure and FVP were averaged over eight cardiac cycles, PAP and RAP over eight respiratory cycles, and PCWP was determined as the mean over three respiratory cycles (Belenkie et al. 1964). Left ventricular transmural filling pressure was expressed as PCWP minus RAP (over three respiratory cycles). The rate–pressure product was HR multiplied by systolic blood pressure. Plasma catecholamines were determined with a radioimmunoassay (LDN, Nordhorn, Germany).
Statistical analysis
A two-way repeated measures analysis of variance (ANOVA) was used to test differences within and between trials. Following a significant F test, pair-wise differences were identified using Tukey's honestly significant difference (HSD) post hoc procedure. Significance level was set at P < 0.05 and data are presented as mean ± SEM unless otherwise indicated.
Four of the 12 subjects did not complete the KEE trials due to technical difficulties. For technical reasons and/or catheter displacement during the experiment, PCWP, blood samples from the pulmonary artery and LBF could not be obtained in some subjects, and  , RAP, PAP, PCWP and leg haemodynamics are therefore for eight subjects in the cycling trials and six (
 , RAP, PAP) during KEE. PCWP could only be obtained from three subjects during the KEE trials and is therefore not included.
Results
Maximal O2 uptake and time to exhaustion
There was no difference in  (4.7 ± 0.1 vs. 4.7 ± 0.1 l min−1 in control and pacing, respectively) or WLmax (465 ± 16 vs. 465 ± 16 W, respectively) between trials. In addition, time to exhaustion was similar in the control and the pacing trials (696 ± 14 vs. 676 ± 13 s, respectively). During KEE,
  , WLmax and time to exhaustion were also similar between trials (2.1 ± 0.1 vs. 2.1 ± 0.1 l min−1, 74 ± 4 vs. 74 ± 4 W and 654 ± 25 vs. 678 ± 26 s, respectively).
Systemic and leg hemodynamics during cycling
Atrial pacing increased resting HR by 23 ± 5 beats min−1 (P < 0.001), submaximal (25–85% WLmax) HR by 19 ± 2 beats min−1 (P < 0.001) and HRmax by 23 ± 3 beats min−1 (184 ± 2 to 206 ± 3 beats min−1; Table1, Fig. 1; P < 0.001). Atrial pacing increased  from 9 ± 1 to 12 ± 1 l min−1 during baseline conditions (P < 0.05). However, during exercise, the increase in HR did not alter
  , because SV was proportionally reduced (i.e. by 12–17 (±7) ml beat−1; P < 0.05 at 40–85% WLmax, P = 0.05 at 85% WLmax,). In both trials,
  and LBF increased until 85% of WLmax and then plateaued, whereas LBF increased curvilinearly from baseline to exhaustion in both trials and there was no difference between the control and pacing trials. In the control trial, SV increased from baseline to 40% of WLmax, plateaued and then declined by 15 ± 5 ml beat−1 at 100% of WLmax (supplemental Fig. S3; P < 0.05). During the pacing trial, SV increased from baseline to 25% of WLmax (P < 0.05) and then remained unchanged. Arterial pressure, PAP and FVP increased from baseline to 100% of WLmax and there was no difference between trials. RAP increased in both trials but was higher at 70 and 85% of WLmax (P < 0.05) during the pacing trial. PCWP increased during exercise in the control trial (25–100% of WLmax; P < 0.05) and pacing trial (55–100% of WLmax; P < 0.05), but PCWP was lower at 25–55% of WLmax (P < 0.05) and tended to be reduced at 70% of WLmax (P = 0.06) during the pacing trial compared to the control trial. Left ventricular transmural filling pressure increased during the control trial (P < 0.05) but not during the pacing trial and was lower during pacing than during the control trial (40–100% of WLmax; P < 0.05). Moreover, transmural pressure declined during the pacing trial (P < 0.05) and tended (P = 0.056) to decline from the peak SV to 100% of WLmax during the control trial. Right atrial pacing increased SVC at rest (P < 0.05). During exercise, SVC and LVC increased to 70% of WLmax and then plateaued and there was no difference between trials. The rate pressure product increased from baseline to 100% of WLmax during both trials and was higher at all workloads in the pacing trial (P < 0.05; Fig. 2).
Figure 1.
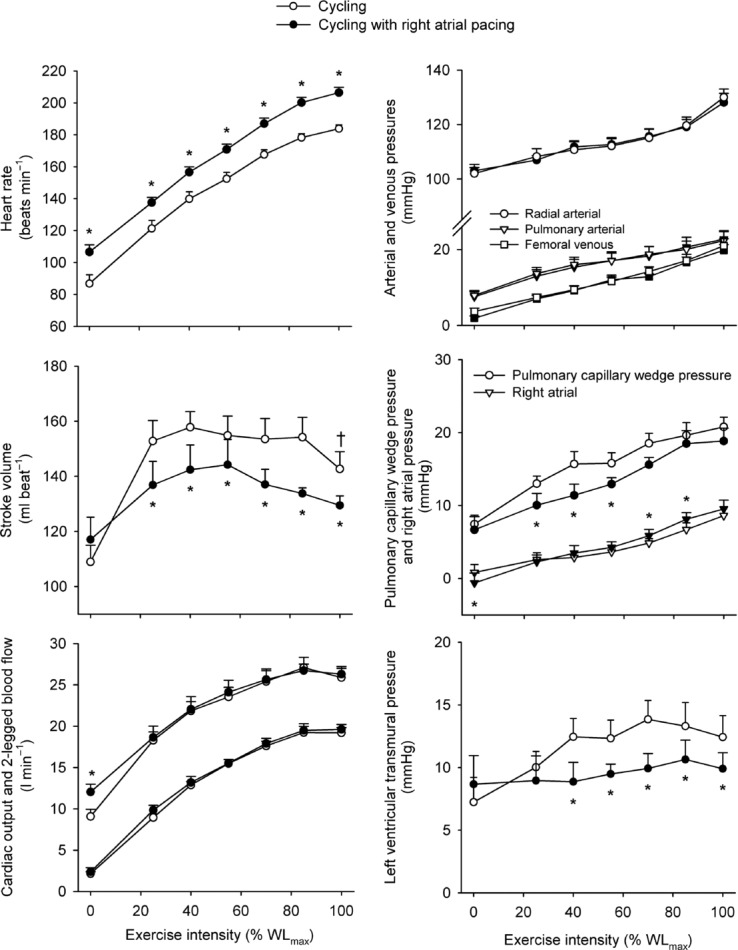
Heart rate, stroke volume, cardiac output and two-legged blood flow, arterial and femoral venous pressure, pulmonary arterial and right atrial pressure and transmural pressure plotted against the relative intensity during incremental cycling with and without right atrial pacing to increase heart rate by ∼20 beats min−1 above control conditions
Figure 2.
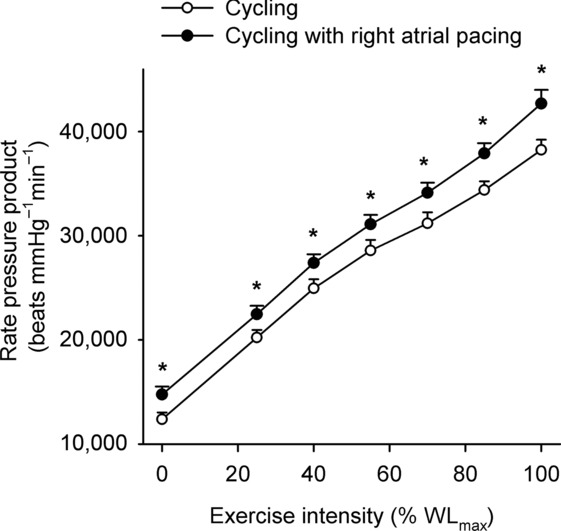
Rate–pressure product plotted against the relative intensity during incremental cycling with and without right atrial pacing to increase heart rate by ∼20 beats min−1 above control conditions
Blood variables, oxygen delivery and  during cycling
Systemic and leg  increased from baseline to 85% of WLmax (Fig. 3). Thereafter, they plateaued and there was no difference between trials. In both trials, Hb increased from baseline to 100% of WLmax, resulting in elevated arterial O2 content despite a decline in arterial saturation (P < 0.05; Tables2 and 3). During baseline conditions and at 25% of WLmax, leg a-vO 2 difference was higher in the control trial, whereas the systemic a-vO 2 difference was higher at baseline only (P < 0.05). During exercise, systemic and leg O2 delivery increased similarly in both trials up to 85% WLmax and then plateaued, whereas the systemic and leg a-vO 2 difference increased from baseline to 100% of WLmax (P < 0.05). Upon exhaustion, systemic O2 extraction was 86 ± 2 and 84 ± 3% in the control and pacing trial, respectively, and leg O2 extraction was 91 ± 2 and 90 ± 2%, respectively. Plasma noradrenaline and adrenaline levels increased from baseline to exhaustion (P < 0.05; Tables2 and 3) and there was no difference between trials.
Figure 3.
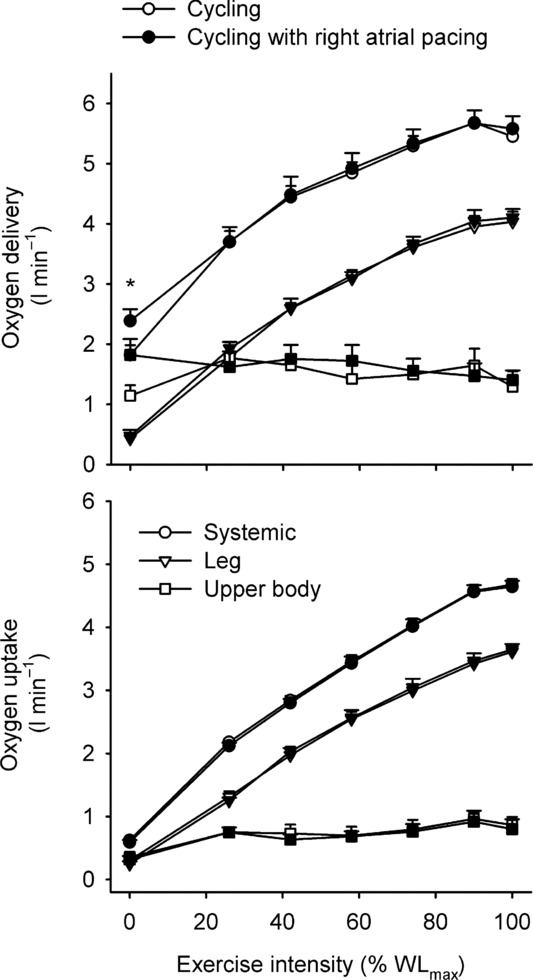
Systemic, two-legged and upper body oxygen delivery (top) and uptake (bottom) plotted against the relative intensity during incremental cycling with and without right atrial pacing to increase heart rate by ∼20 beats min−1 above control conditions
Table 2.
Blood variables during incremental cycling (% maximal workload)
| Baseline | 25% | 40% | 55% | 70% | 85% | 100% | |
|---|---|---|---|---|---|---|---|
| Haemoglobin (g l−1) | |||||||
| A | 150 ± 2 | 152 ± 3 | 153 ± 3 | 156 ± 3* | 160 ± 3* | 162 ± 3* | 164 ± 3* |
| PA | 152 ± 3 | 153 ± 3 | 154 ± 3 | 158 ± 3 | 162 ± 4 | 163 ± 4* | 164 ± 4* |
| FV | 151 ± 2 | 153 ± 3 | 155 ± 3 | 158 ± 3* | 162 ± 4* | 166 ± 4* | 168 ± 3* |
 (mmHg) (mmHg) | |||||||
| A | 109 ± 2 | 100 ± 2* | 95 ± 2* | 92 ± 2* | 90 ± 3* | 94 ± 2* | 97 ± 2* |
| PA | 40 ± 1 | 28 ± 1* | 26 ± 1* | 25 ± 1* | 24 ± 1* | 23 ± 1* | 21 ± 1* |
| FV | 30 ± 2 | 23 ± 1* | 20 ± 1* | 20 ± 1* | 19 ± 2* | 18 ± 2* | 16 ± 2* |
| O2 saturation (%) | |||||||
| A | 98.3 ± 0.1 | 97.6 ± 0.2 | 97.1 ± 0.2* | 96.3 ± 0.3* | 95.6 ± 0.5* | 95.2 ± 0.5* | 94.8 ± 0.4* |
| PA | 67.5 ± 1.4 | 42.5 ± 1.6 | 34.4 ± 0.9* | 28.8 ± 2.7* | 23.2 ± 2.5* | 18.0 ± 2.9* | 13.0 ± 2.2* |
| FV | 42.5 ± 4.3 | 28.3 ± 1.5* | 20.0 ± 1.3* | 18.1 ± 2.4* | 14.2 ± 2.6* | 11.4 ± 3.0* | 8.2 ± 2.0* |
| O2 content (ml l−1) | |||||||
| A | 201 ± 3 | 201 ± 3 | 202 ± 3 | 205 ± 3 | 208 ± 4* | 210 ± 4* | 211 ± 4* |
| PA | 139 ± 3 | 88 ± 4* | 72 ± 2* | 62 ± 6* | 51 ± 5* | 40 ± 7* | 29 ± 5* |
| FV | 87 ± 9 | 59 ± 3* | 42 ± 3* | 39 ± 5* | 31 ± 5* | 26 ± 7* | 19 ± 5* |
 (mmHg) (mmHg) | |||||||
| A | 38 ± 1 | 39 ± 1 | 40 ± 1 | 41 ± 1 | 41 ± 1 | 39 ± 1 | 36 ± 1 |
| PA | 44 ± 3 | 49 ± 3 | 53 ± 4* | 57 ± 4* | 60 ± 4* | 73 ± 4* | 86 ± 3* |
| FV | 58 ± 1 | 58 ± 1 | 64 ± 1 | 68 ± 1* | 75 ± 2* | 85 ± 3* | 94 ± 4* |
| pH | |||||||
| A | 7.40 ± 0.00 | 7.40 ± 0.00 | 7.39 ± 0.00 | 7.41 ± 0.02 | 7.36 ± 0.01 | 7.36 ± 0.03 | 7.27 ± 0.01* |
| PA | 7.36 ± 0.01 | 7.34 ± 0.01 | 7.33 ± 0.01* | 7.30 ± 0.01* | 7.29 ± 0.02* | 7.20 ± 0.02* | 7.09 ± 0.02* |
| FV | 7.31 ± 0.00 | 7.32 ± 0.00 | 7.30 ± 0.00 | 7.27 ± 0.00* | 7.22 ± 0.01* | 7.15 ± 0.01* | 7.06 ± 0.02* |
| Lactate (mmol l−1) | |||||||
| A | 1.1 ± 0.2 | 1.1 ± 0.2 | 1.4 ± 0.2 | 2.3 ± 0.3 | 4.1 ± 0.5* | 8.2 ± 0.9* | 12.5 ± 1.2* |
| PA | 0.8 ± 0.1 | 0.8 ± 0.1 | 1.0 ± 0.1 | 1.6 ± 0.2 | 3.5 ± 0.6* | 7.4 ± 1.0* | 12.6 ± 0.9* |
| FV | 0.9 ± 0.1 | 2.1 ± 1.3 | 1.2 ± 0.1 | 2.0 ± 0.2 | 4.2 ± 0.4* | 8.4 ± 0.6* | 13.3 ± 1.0* |
| Glucose (mmol l−1) | |||||||
| A | 5.7 ± 0.2 | 5.4 ± 0.2 | 5.4 ± 0.2 | 5.4 ± 0.2 | 5.2 ± 0.2* | 5.0 ± 0.2* | 5.0 ± 0.2* |
| PA | 5.4 ± 0.4 | 5.1 ± 0.3 | 5.2 ± 0.4 | 5.1 ± 0.3 | 4.9 ± 0.2 | 4.9 ± 0.3 | 5.3 ± 0.2 |
| FV | 5.4 ± 0.3 | 5.6 ± 0.3 | 5.7 ± 0.3 | 5.5 ± 0.2 | 5.3 ± 0.2 | 5.3 ± 0.2 | 5.1 ± 0.2 |
| Noradrenaline (nmol l−1) | |||||||
| A | 4.2 ± 0.8 | 4.8 ± 0.9 | 6.7 ± 1.3 | 11.2 ± 1.5 | 21.0 ± 2.8* | 38.6 ± 3.4* | 56.4 ± 2.9* |
| Adrenaline (nmol l−1) | |||||||
| A | 2.1 ± 0.6 | 1.9 ± 0.6 | 2.9 ± 0.9 | 4.6 ± 1.3 | 7.5 ± 2.1 | 15.2 ± 4.0* | 24.7 ± 6.7* |
| Temperature (°C) | |||||||
| PA | 37.3 ± 0.1 | 37.6 ± 0.1* | 37.8 ± 0.1* | 38.0 ± 0.2* | 38.3 ± 0.1* | 38.7 ± 0.1* | 38.9 ± 0.1* |
| FV | 37.5 ± 0.1 | 37.7 ± 0.1 | 37.9 ± 0.1* | 38.1 ± 0.1* | 38.4 ± 0.1* | 38.7 ± 0.1* | 39.0 ± 0.1* |
A, radial artery; PA, pulmonary artery; FV, femoral vein. Arterial oxygen ( ) and carbon dioxide tensions (
 ) and pH are corrected for changes in blood temperature. Data are mean ± SEM for eight (PA and FV) or 12 (A) subjects.
Different from baseline (P < 0.05).
Table 3.
Blood variables during incremental cycling with right atrial pacing (% maximal workload)
| Baseline | 25% | 40% | 55% | 70% | 85% | 100% | |
|---|---|---|---|---|---|---|---|
| Haemoglobin (g l−1) | |||||||
| A | 148 ± 3 | 149 ± 2 | 150 ± 3 | 154 ± 3* | 158 ± 3* | 161 ± 3* | 164 ± 3* |
| PA | 147 ± 1 | 150 ± 1 | 154 ± 3 | 156 ± 4 | 161 ± 3* | 162 ± 3* | 163 ± 4* |
| FV | 147 ± 2 | 147 ± 2 | 152 ± 4 | 155 ± 4* | 158 ± 4* | 161 ± 3* | 163 ± 3* |
 (mmHg) (mmHg) | |||||||
| A | 106 ± 1 | 101 ± | 93 ± 1* | 92 ± 2* | 92 ± 2* | 96 ± 3†* | 99 ± 2* |
| PA | 43 ± 2† | 31 ± 2* | 26 ± 1* | 25 ± 2* | 24 ± 2* | 23 ± 1* | 22 ± 1* |
| FV | 30 ± 2 | 26 ± 2* | 22 ± 1* | 20 ± 1* | 20 ± 1* | 18 ± 1* | 18 ± 2* |
| O2 saturation (%) | |||||||
| A | 98.3 ± 0.1 | 97.8 ± 0.2 | 97.1 ± 0.2* | 96.7 ± 0.3* | 96.3 ± 0.4†* | 95.9 ± 0.5†* | 95.1 ± 0.5* |
| PA | 72.0 ± 2.1† | 40.8 ± 3.3* | 32.6 ± 1.5* | 29.6 ± 3.9* | 23.0 ± 3.7* | 17.6 ± 3.2* | 15.3 ± 2.5* |
| FV | 47.5 ± 3.7 | 30.6 ± 2.0* | 21.1 ± 1.2* | 17.2 ± 2.6* | 16.2 ± 2.5* | 11.3 ± 2.0* | 9.7 ± 2.2* |
| O2 content (ml l−1) | |||||||
| A | 198 ± 4 | 198 ± 3 | 198 ± 4 | 202 ± 4 | 205 ± 4* | 209 ± 3* | 210 ± 3* |
| PA | 144 ± 5 | 92 ± 12* | 68 ± 4* | 63 ± 9* | 51 ± 9* | 39 ± 8* | 34 ± 6* |
| FV | 94 ± 8 | 67 ± 8* | 46 ± 4* | 38 ± 5* | 35 ± 5* | 26 ± 5* | 22 ± 5* |
 (mmHg) (mmHg) | |||||||
| A | 39 ± 0 | 40 ± 1 | 41 ± 1 | 41 ± 1 | 41 ± 1 | 37 ± 1† | 35 ± 1* |
| PA | 45 ± 2 | 49 ± 3 | 55 ± 3* | 58 ± 4* | 62 ± 3* | 66 ± 5* | 77 ± 5†* |
| FV | 56 ± 2 | 58 ± 1 | 60 ± 2 | 63 ± 3† | 73 ± 2* | 79 ± 5* | 89 ± 4†* |
| pH | |||||||
| A | 7.42 ± 0.02 | 7.42 ± 0.02 | 7.42 ± 0.05 | 7.40 ± 0.01 | 7.37 ± 0.01 | 7.32 ± 0.01* | 7.29 ± 0.02* |
| PA | 7.36 ± 0.00 | 7.34 ± 0.00 | 7.32 ± 0.01* | 7.30 ± 0.01* | 7.29 ± 0.03* | 7.17 ± 0.02* | 7.13 ± 0.02†* |
| FV | 7.32 ± 0.01 | 7.32 ± 0.00 | 7.31 ± 0.00 | 7.28 ± 0.01* | 7.25 ± 0.01* | 7.17 ± 0.02* | 7.08 ± 0.02†* |
| Lactate (mmol l−1) | |||||||
| A | 1.2 ± 0.1 | 1.2 ± 0.1 | 1.5 ± 0.2 | 2.2 ± 0.3 | 4.0 ± 0.4* | 7.9 ± 0.7* | 11.7 ± 0.8†* |
| PA | 1.0 ± 0.1 | 1.0 ± 0.1 | 1.3 ± 0.2 | 1.7 ± 0.2 | 3.8 ± 0.5* | 7.6 ± 1.0* | 12.7 ± 1.0* |
| FV | 1.0 ± 0.2 | 1.1 ± 0.1 | 1.3 ± 0.2 | 1.8 ± 0.2 | 3.6 ± 0.5 | 7.7 ± 0.9* | 13.9 ± 0.7* |
| Glucose (mmol l−1) | |||||||
| A | 5.7 ± 0.3 | 5.6 ± 0.3 | 5.5 ± 0.4 | 5.5 ± 0.4 | 5.4 ± 0.4 | 5.2 ± 0.4* | 5.4 ± 0.5 |
| PA | 5.0 ± 0.3 | 4.9 ± 0.4 | 4.6 ± 0.4 | 4.7 ± 0.3 | 5.1 ± 0.4 | 4.9 ± 0.4 | 5.0 ± 0.5 |
| FV | 4.6 ± 0.4† | 5.0 ± 0.3 | 4.8 ± 0.3 | 4.8 ± 0.4 | 4.9 ± 0.4 | 4.6 ± 0.4 | 4.8 ± 0.4 |
| Noradrenaline (nmol l−1) | |||||||
| A | 2.5 ± 0.4 | 4.4 ± 1.0 | 5.7 ± 0.8 | 12.4 ± 2.5* | 19.2 ± 1.9* | 40.6 ± 2.6* | 53.5 ± 3.0* |
| Adrenaline (nmol l−1) | |||||||
| A | 1.8 ± 0.6 | 2.4 ± 0.5 | 2.3 ± 0.4 | 5.7 ± 2.2 | 6.1 ± 0.7 | 17.4 ± 4.2* | 21.9 ± 5.5* |
| Temperature (°C) | |||||||
| PA | 37.3 ± 0.1 | 37.6 ± 0.1 | 37.8 ± 0.1* | 38.0 ± 0.1* | 38.3 ± 0.1* | 38.7 ± 0.1* | 38.9 ± 0.1* |
| FV | 37.5 ± 0.1 | 37.6 ± 0.1* | 37.8 ± 0.1* | 38.1 ± 0.1* | 38.4 ± 0.1* | 38.7 ± 0.1* | 39.0 ± 0.1* |
A, radial artery; PA, pulmonary artery; FV, femoral vein. Arterial oxygen ( ) and carbon dioxide tensions (
 ) and pH are corrected for changes in blood temperature. Data are mean ± SEM for eight (PA and FV) or 12 (A) subjects.
Different from baseline (P < 0.05).
†Different from control (P < 0.05).
Systemic and leg haemodynamics during KEE
During KEE,  , LBF, O2 delivery and
  increased from rest to exhaustion, despite a reduction in SV before exhaustion (P < 0.05; Fig. 4). Atrial pacing increased HR at all exercise intensities (20 ± 1 beats min−1; P < 0.001). However, the elevated HR did not alter
  , which increased similarly to the control trial because of a lower SV during the pacing trial (27–84% of WLmax; P < 0.05), except during resting conditions and at 27% WLmax where
  was increased in the pacing trial. During exercise, PAP was lower in the pacing trial at 52 and 100% of WLmax (P < 0.05), whereas MAP was similar although the diastolic pressure was higher at 52 and 68% of WLmax in the pacing trial (P < 0.05). Right atrial pacing lowered RAP compared to the control trial at all workloads (P < 0.05).
Figure 4.
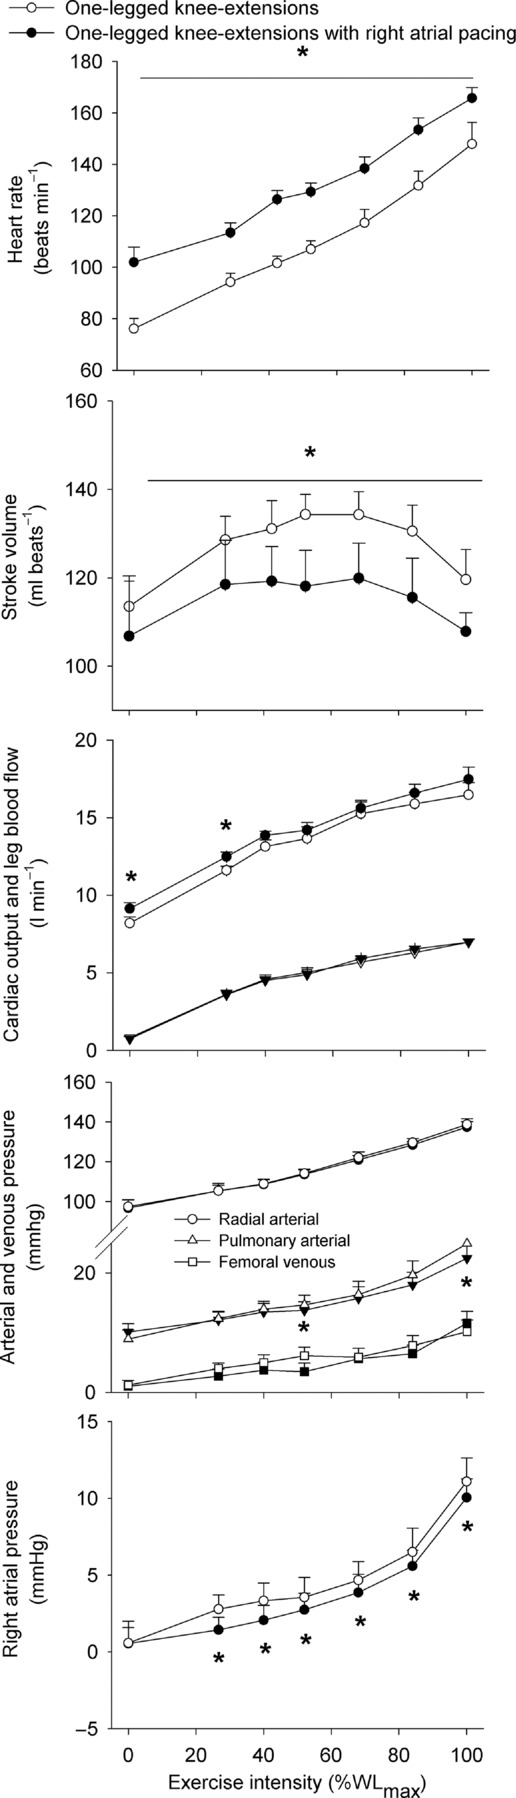
Heart rate, stroke volume, cardiac output and one-legged blood flow, arterial and femoral venous pressure, pulmonary arterial and right atrial pressure plotted against the relative intensity during knee-extensor exercise with and without right atrial pacing to increase heart rate by ∼20 beats min−1 above control conditions
Blood variables, oxygen delivery and  during KEE
Systemic and leg O2 delivery and  increased similarly from baseline to 100% of WLmax in both trials in parallel with an increase in systemic and leg a-vO 2 difference (supplemental Fig. S4). Blood gas variables are presented in supplemental Tables S3 and S4.
Discussion
To investigate the role of tachycardia on cardiovascular control during maximal exercise, we increased HR by right atrial pacing during incremental large and small muscle mass exercise in endurance trained cyclists. The main findings are that: (1) an increase in HR by ∼20 beats min−1 did not alter the  or LBF dynamics, because the concomitant SV decline was of equal magnitude; (2) atrial pacing lowered the left ventricular transmural filling pressure at all cycling intensities, and increased RAP at high cycling intensities, whereas RAP was lowered during KEE; (3) an increase in HRmax by 23 ± 3 beats min−1 did not enhance maximal
  ,
,  or exercise performance; and (4)
  and LBF increased from rest to volitional exhaustion during KEE, whereas they plateaued close to
  in both cycling trials in parallel with a plateau in the left ventricular transmural pressure. Collectively, these observations suggest that a lower left ventricular filling pressure reduces SV during atrial pacing. During maximal cycling, a plateau in ventricular filling appears to impose a limitation to
  and
and  in healthy trained individuals, whereas the attainment of HRmax and myocardial work capacity do not appear to be critical determinants of cardiovascular capacity in healthy individuals.
Effect of atrial pacing on cardiac performance
The current study demonstrates that HRmax can be substantially enhanced in exercising humans by right atrial pacing, but global cardiac performance is not affected. Right atrial pacing increased HR at all workloads during both cycling and KEE, but  and LBF remained strikingly similar even at maximal intensities due to a parallel and opposite change in SV. These findings are in general agreement with the unaltered systemic and leg dynamics with atrial pacing during submaximal KEE in healthy individuals (Bada et al. 1985; Mortensen et al. 2005) and during ventricular pacing in exercising dogs (Sheriff et al. 1988). Yet, the current study extends substantially previous work by using atrial pacing to selectively and precisely manipulate HR in healthy humans to isolate the effects of tachycardia on cardiac performance under conditions that tax the cardiovascular system to its capacity.
A critical question is how tachycardia consistently reduces SV by 12–17 ml beat−1 across a wide range of cardiovascular demands evoked by large and small muscle mass exercise. Cardiac performance is determined by a number of intrinsic and extrinsic factors that alter cardiac preload, afterload and contractility (Bevegard & Shepherd, 2012; Rowell, 2004). The consistently lower left ventricular transmural filling pressure during cycling suggests that atrial pacing lowered the cardiac preload at all cycling intensities and consequently contributed to the pacing-evoked lowering in SV (Fig. 5). With regard to cardiac afterload, atrial pacing did not alter arterial pressure at any exercise intensity or modality, suggesting that varied cardiac afterload was not contributing to the tachycardia-mediated decline in SV. We did not measure left ventricular contractility, but the catecholamine response in the control and pacing trial was similar, suggesting that the inotropic state of the heart and thus the myocardial contractility was not substantially altered by atrial pacing (Sonnenblick, 1973). In addition, we have observed a similar SV response during conditions with the same HR but different cathecholamine levels (Mortensen et al. 2005), suggesting that altered myocardial contractility per se is not reducing SV during atrial pacing. Independently of the inotropic state of the heart, the lower preload during atrial pacing is likely to have lowered the myocardial force production as a result of alterations in the length–tension relationship (Frank–Starling mechanism), leading to a reduction in the ejection fraction (Linden & Snow, 1975). Collectively, these data suggest that a lower ventricular filling and consequently lower end-diastolic volume reduces SV during atrial pacing. In addition, reduced preload and depressed myocardial contractility during atrial pacing may also lower the ejection fraction and consequently SV.
Figure 5.
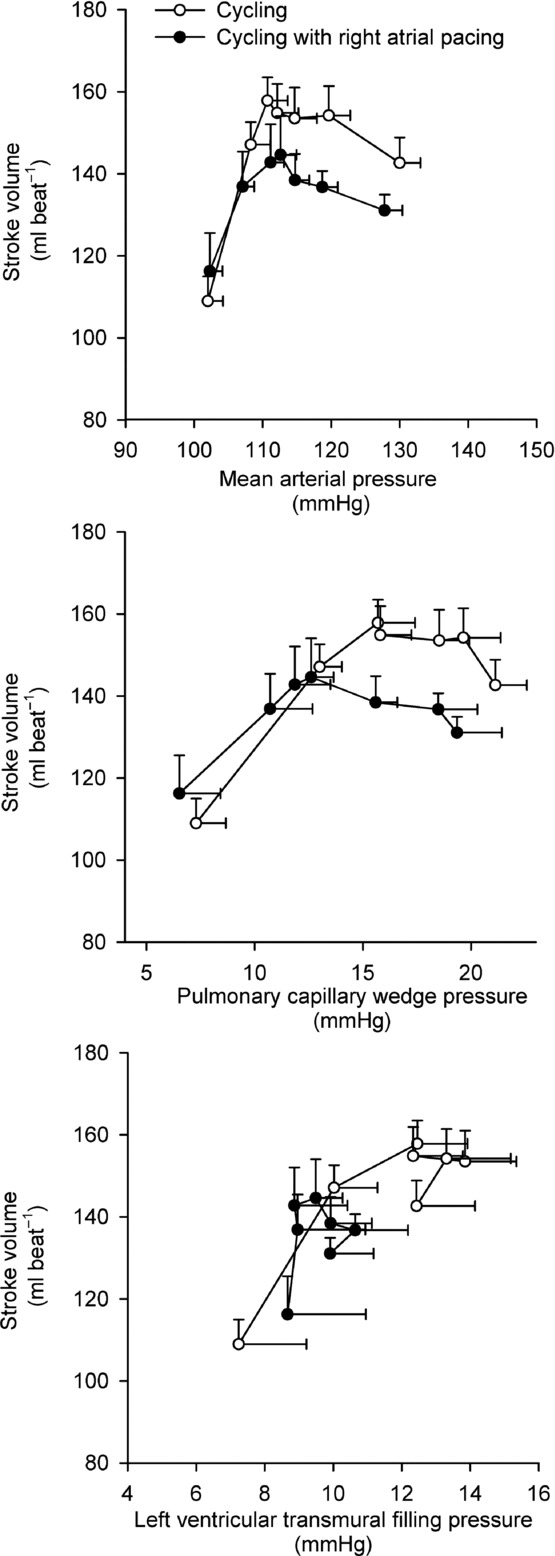
Left ventricular performance during incremental cycling with and without right atrial pacing to increase heart rate by ∼20 beats min−1 above control conditions Data are mean ± SEM.
The potential factors reducing preload include a lower ventricular filling time, diastolic suction and ventricular stiffness. The higher RAP during high intensity cycling with atrial pacing is in contrast to the lower RAP observed at all exercise intensities during KEE, suggesting that the higher RAP was coupled to the higher HR during cycling. Early ventricular filling depends on the diastolic suction arising from recoil of the systolic torsional deformation of the left ventricle (Thomas & Popović, 1991) and is accentuated by catecholamines (Rademakers et al. 1992). The exponential rise in circulating catecholamines during progressive exercise may increase diastolic suction sufficiently to offset the decrease in ventricular filling time (Notomi et al. 1974), but atrial pacing did not alter the catecholamine response. Disassociation between the decrease in filling time and the increase in catecholamines may therefore have caused diastolic suction to be insufficient to maintain adequate ventricular filling. It is plausible that a simultaneous increase in HR and myocardial contractility would result in a higher  than observed in the present conditions. RAP increased when HR was elevated above 168 beats min−1, which is similar to observations in exercising dogs, where an increase in HR to levels above 170 beats min−1 results in incomplete relaxation and compromised ventricular filling (Weisfeldt et al. 2006). The lower filling time may therefore have caused the central venous blood volume to be increased as a product of incomplete left ventricular filling (Braunwald et al. 2001; Miller et al. 2008). Alternatively, atrial contraction may have occurred against a partially or completely closed mitral valve at high HRs and/or atrial pacing resulted in a loss of atrial contraction (‘atrial kick’), both of which could underpin the increased in RAP (Mitchell et al. 1962).
Central limitations to cardiovascular capacity and 
The present data provide important insight into the mechanisms limiting cardiovascular capacity and  in healthy human subjects. In agreement with previous findings, the attainment of
  was associated with an attenuated rise in
  (Åstrand et al. 1985; Mortensen et al. 1962, 2006; Trinity et al. 1972) in parallel with a reduction in SV (González-Alonso & Calbet, 1971; Gonzaléz-Alonso et al. 2011; Mortensen et al. 1962, 2006; Trinity et al. 1972). The plateau in
  during maximal exercise could be caused by insufficient increase in HR and/or restricted SV. However, the failure of an increase in HR to augment
  during conditions where O2 delivery was clearly insufficient to meet the metabolic demand (Mortensen et al. 2006) suggests that the mechanisms limiting
  are linked to a restricted SV rather than to a limited increase in HR (Hammond & Froelicher, 1967).
The potential mechanisms restricting SV are a limited myocardial work capacity, left ventricular preload and/or increased left ventricular afterload (Rowell, 2004). With regard to myocardial work capacity, right atrial pacing increased the rate–pressure product, indicating that the myocardial O2 demand was increased during the pacing trial (Nelson et al. 2007) despite a lower SV. Therefore, limitations to myocardial work capacity and metabolism do not explain the restricted  during maximal exercise (Noakes & Marino, 2013), because maximal myocardial
  is not reached (Brink-Elfegoun et al. 1967). Second, a failure to increase left ventricular filling pressure could play a role in limiting SV at high exercise intensities, because the left ventricular transmural filling pressure did not increase from 40 to 100% of WLmax and tended to decline from peak SV to exhaustion. The unaltered left ventricular transmural pressure was linked to the continuous rise in RAP that paralleled the increase in PCWP. In this regard, an increased intrathoracic pressure during the expiration phase has been shown to reduce left ventricular transmural pressure (Stark-Leyva et al. 1993; Miller et al. 1974). Moreover, it is likely that the limited intrathoracic space impairs ventricular filling and SV as the inspiratory volume increases at high intensities (Takata & Robotham, 1967). The pericardium has been shown to restrict SV in exercising dogs (Stray-Gundersen et al. 2011) and in middle-aged humans (Fujimoto et al. 1983), but it remains unknown if that applies also to young trained humans (Levine, 1992). Thirdly, the progressive increase in arterial pressure suggests that an increased left ventricular afterload could also play a role in the compromised SV and
  during high intensity exercise, although left ventricular end-systolic volume does not increase during heavy exercise (Poliner et al. 1971; Stöhr et al. 1962). Taken together, the plateau in
  close to
  appears to be associated with a compromised ventricular filling, whereas HRmax and myocardial work capacity do not impose a limitation to cardiovascular capacity and
  .
.
Local limitations to locomotor limb blood flow and venous return
It is widely accepted that the heart is the main determinant of cardiovascular capacity and  , because the vasodilatory capacity of skeletal muscles outstrips its pumping capacity (Andersen & Saltin, 1985). Less attention has been provided to the idea that haemodynamic events in active muscles might be important determinants of cardiac function and capacity during exercise. We (González-Alonso et al. 2004; Bada et al. 1985; Mortensen et al. 2005) and others (Guyton et al. 2008; Guyton, 2006; Shepherd et al. 2012) have provided evidence that
  is mainly driven by the peripheral cardiovascular demand during submaximal exercise conditions. Moreover, pharmacologically induced limb vasoconstriction decreases
  in proportion to the decrease in peripheral blood flow (Mortensen et al. 2008; Rosenmeier et al. 1992) whereas limb vasodilation leads to a proportional increase in LBF and
  (González-Alonso et al. 2003, 2004). The strikingly similar attenuation in
  and LBF in the control and pacing cycling trials, the similar haemodynamic effects of atrial pacing during two different exercise modalities, and the similar SV decline, but increasing LBF and
  during maximal KEE (Fig. 6), supports that peripheral control of blood flow and vascular tone not only drives
  , but also imposes a limitation to
  close to
  by limiting venous return to the heart.
Figure 6.
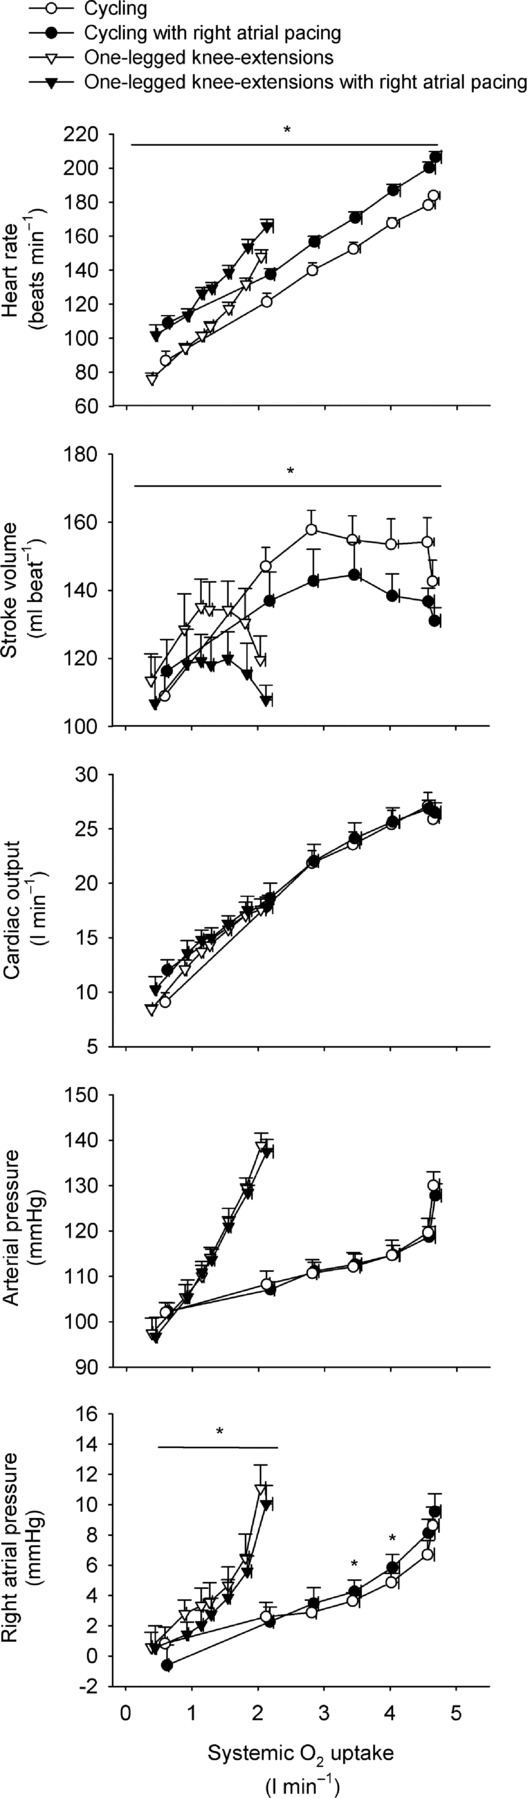
Heart rate, stroke volume, cardiac output, arterial and right atrial pressure plotted against systemic  during incremental cycling and one-legged knee extensor exercise with and without right atrial pacing to increase heart rate by ∼20 beats min−1 above control conditions
Experimental considerations
We were unable to obtain sufficient PCWP during KEE, but the effect of atrial pacing on PCWP is unlikely to differ between the two exercise modalities as the haemodynamic response was similar. Moreover, we have previously reported a lower left ventricular transmural filling pressure during low and moderate intensity KEE with atrial pacing (Mortensen et al. 2005).
We determined the PCWP as a mean over three respiratory cycles rather than at the end of expiration (Forrester et al. 2007). PCWP at the end of an expiration is less sensitive to changes in  and ventilation (Cengiz et al. 2007), but calculation of the transmural pressure can be problematic due to the rapid changes in RAP during exercise. Since the main focus of the present study was to compare conditions with and without right atrial pacing (where there was no difference in ventilation or
  ), we therefore report mean PCWP.
Conclusion
From low intensity to maximal exercise, moderate changes in HR do not alter the  dynamics, suggesting that the
  response to exercise is regulated mainly and possibly also limited by extrinsic factors. A lower ventricular filling and a reduced force of contraction due to a lower end-diastolic volume and possibly also depressed myocardial contractility appear to account for the lower SV during right atrial pacing. The heart can achieve a higher HR and rate pressure product than normally observed during maximal exercise, demonstrating that HRmax and myocardial work capacity do not impose a limitation to cardiac performance and
  in healthy, trained individuals. Instead, limited left ventricular filling appears to reduce SV during atrial pacing and restrict
  and
and  during maximal exercise.
Translational perspective
During incremental exercise, cardiac output ( ) initially increases in proportion to the augmented skeletal muscle O2 demand, and then plateaus before the attainment of aerobic capacity. We tested the hypothesis that an increase in heart rate (HR) during exercise would not alter
  because of compensatory adjustments in stroke volume (SV) and that a higher HRmax would not enhance cardiovascular capacity neither for small or large muscle mass exercise. The finding that central and peripheral haemodynamics were strikingly unaltered by a ∼20 beats min−1 increase in HR suggests that
  is determined by peripheral O2 demand. These investigations were performed in healthy subjects and the results may not directly apply to patients with cardiovascular diseases who may be treated with medication that affects peripheral vascular resistance, contractility and autonomic function. However, the results highlight that when the heart is operating within the cardiac reserve, an increase in HR alone is unlikely to enhance
  during exercise. The unaltered physical performance during atrial pacing suggests that aerobic exercise capacity is not limited by HRmax and that a lowering in HRmax is not a primary mechanism enhancing aerobic exercise performance with endurance training.
Acknowledgments
We would like to thank all the participants for their time, effort and commitment and Peter Nissen and Magnus Christensen for technical support.
Glossary
- FVP
femoral venous pressure
- Hb
haemoglobin
- HR
heart rate
- KEE
knee-extensor exercise
- LBF
leg blood flow
- LVC
leg vascular conductance
- MAP
mean arterial pressure
- PAP
pulmonary artery pressure
- PCWP
pulmonary capillary wedge pressure
- RAP
right atrial pressure

cardiac output
- SV
stroke volume
- SVC
systemic vascular conductance

oxygen uptake

maximal oxygen uptake
- WLmax
maximal workload.
Competing interests
None.
Author contributions
Experiments were performed at the Copenhagen Muscle Research Centre and the Department of Anesthesia, Rigshospitalet. Conception and design of the experiment: J.G.A. and S.P.M. Data collection: G.D.W.M., J.H.S., N.H.S., R.D., J.G.A. and S.P.M. Data analysis and interpretation of data: G.D.W.M., J.H.S., N.H.S., J.G.A. and S.P.M. Drafting the article: G.D.W.M. and S.P.M. All authors approved the final version of the manuscript.
Funding
This study was supported by a grant from Team Denmark. S.P.M. and The Copenhagen Muscle Research Centre were supported by a grant from the Capital Region of Denmark. The Centre of Inflammation and Metabolism (CIM) is supported by a grant from the Danish National Research Foundation (# 02-512-55).
References
- Andersen P, Saltin B. Maximal perfusion of skeletal muscle in man. J Physiol. 366:233–249. doi: 10.1113/jphysiol.1985.sp015794. [DOI] [PMC free article] [PubMed] [Google Scholar]
- Åstrand PO, Cuddy TE, Saltin B, Stenberg J. Cardiac output during submaxial and maximal work. J Appl Physiol. 19:268–274. doi: 10.1152/jappl.1964.19.2.268. [DOI] [PubMed] [Google Scholar]
- Bada AA, Svendsen JH, Secher NH, Saltin B, Mortensen SP. Peripheral vasodilation determines cardiac output in exercising humans: insight from atrial pacing. J Physiol. 1985;590:2051–2060. doi: 10.1113/jphysiol.2011.225334. [DOI] [PMC free article] [PubMed] [Google Scholar]
- Belenkie I, Smith ER, Tyberg JV. Ventricular interaction: from bench to bedside. Ann Med. 1964;33:236–241. doi: 10.3109/07853890108998751. [DOI] [PubMed] [Google Scholar]
- Bevegard BS, Shepherd JT. Regulation of the circulation during exercise in man. Physiol Rev. 2012;47:178–213. doi: 10.1152/physrev.1967.47.2.178. [DOI] [PubMed] [Google Scholar]
- Braunwald E, Sarnoff SJ, Stainsby WN. Determinants of duration and mean rate of ventricular ejection. Circ Res. 2001;6:319–325. doi: 10.1161/01.res.6.3.319. [DOI] [PubMed] [Google Scholar]
- Brink-Elfegoun T, Kaijser L, Gustafsson T, Ekblom B. Maximal oxygen uptake is not limited by a central nervous system governor. J Appl Physiol. 1967;102:781–786. doi: 10.1152/japplphysiol.00566.2006. [DOI] [PubMed] [Google Scholar]
- Calbet JA, González-Alonso J, Helge JW, Sondergaard H, Munch-Andersen T, Boushel R, Saltin B. Cardiac output and leg and arm blood flow during incremental exercise to exhaustion on the cycle ergometer. J Appl Physiol. 1958;103:969–978. doi: 10.1152/japplphysiol.01281.2006. [DOI] [PubMed] [Google Scholar]
- Cengiz M, Crapo RO, Gardner RM. The effect of ventilation on the accuracy of pulmonary artery and wedge pressure measurements. Crit Care Med. 2007;11:502–507. doi: 10.1097/00003246-198307000-00004. [DOI] [PubMed] [Google Scholar]
- Forrester JS, Diamond G, McHugh TJ, Swan HJ. Filling pressures in the right and left sides of the heart in acute myocardial infarction. A reappraisal of central-venous-pressure monitoring. N Engl J Med. 2007;285:190–193. doi: 10.1056/NEJM197107222850402. [DOI] [PubMed] [Google Scholar]
- Fujimoto N, Shibata S, Hastings JL, Carrick-Ranson G, Bhella PS, Palmer D, Fu Q, Levine BD. Effects of pericardial constraint and ventricular interaction on left ventricular hemodynamics in the unloaded heart. Am J Physiol Heart Circ Physiol. 1983;300:H1688–H1695. doi: 10.1152/ajpheart.01198.2010. [DOI] [PMC free article] [PubMed] [Google Scholar]
- González-Alonso J, Calbet JA. Reductions in systemic and skeletal muscle blood flow and oxygen delivery limit maximal aerobic capacity in humans. Circulation. 1971;107:824–830. doi: 10.1161/01.cir.0000049746.29175.3f. [DOI] [PubMed] [Google Scholar]
- Gonzaléz-Alonso J, Dalsgaard MK, Osada T, Volianitis S, Dawson EA, Yoshiga CC, Secher NH. Brain and central haemodynamics and oxygenation during maximal exercise in humans. J Physiol. 2011;557:331–342. doi: 10.1113/jphysiol.2004.060574. [DOI] [PMC free article] [PubMed] [Google Scholar]
- González-Alonso J, Mortensen SP, Dawson EA, Secher NH, Damsgaard R. Erythrocytes and the regulation of human skeletal muscle blood flow and oxygen delivery: role of erythrocyte count and oxygenation state of haemoglobin. J Physiol. 2003;572:295–305. doi: 10.1113/jphysiol.2005.101121. [DOI] [PMC free article] [PubMed] [Google Scholar]
- González-Alonso J, Mortensen SP, Jeppesen TD, Ali L, Barker H, Damsgaard R, Secher NH, Dawson EA, Dufour SP. Haemodynamic responses to exercise, ATP infusion and thigh compression in humans: insight into the role of muscle mechanisms on cardiovascular function. J Physiol. 2004;586:2405–2417. doi: 10.1113/jphysiol.2008.152058. [DOI] [PMC free article] [PubMed] [Google Scholar]
- Guyton AC. Regulation of cardiac output. N Engl J Med. 2006;277:805–812. doi: 10.1056/NEJM196710122771509. [DOI] [PubMed] [Google Scholar]
- Guyton AC, Douglas BH, Langston JB, Richardson TQ. Instantaneous increase in mean circulatory pressure and cardiac output at onset of muscular activity. Circ Res. 2008;11:431–441. doi: 10.1161/01.res.11.3.431. [DOI] [PubMed] [Google Scholar]
- Hammond HK, Froelicher VF. Normal and abnormal heart rate responses to exercise. Prog Cardiovasc Dis. 1967;27:271–296. doi: 10.1016/0033-0620(85)90010-6. [DOI] [PubMed] [Google Scholar]
- Hellsten Y, Nyberg M, Jensen LG, Mortensen SP. Vasodilator interactions in skeletal muscle blood flow regulation. J Physiol. 1962;590:6297–6305. doi: 10.1113/jphysiol.2012.240762. [DOI] [PMC free article] [PubMed] [Google Scholar]
- Knight DR, Poole DC, Schaffartzik W, Guy HJ, Prediletto R, Hogan MC, Wagner PD. Relationship between body and leg VO2 during maximal cycle ergometry. J Appl Physiol. 1985;73:1114–1121. doi: 10.1152/jappl.1992.73.3.1114. [DOI] [PubMed] [Google Scholar]
- Lakatta EG, Gerstenblith G, Angell CS, Shock NW, Weisfeldt ML. Diminished inotropic response of aged myocardium to catecholamines. Circ Res. 2012;36:262–269. doi: 10.1161/01.res.36.2.262. [DOI] [PubMed] [Google Scholar]
-
Levine BD
 : what do we know, and what do we still need to know. J Physiol. 1992;586:25–34. doi: 10.1113/jphysiol.2007.147629. [DOI] [PMC free article] [PubMed] [Google Scholar]
 - Linden R, Snow H. The inotropic state of the heart. In: Linden R, editor. Recent Advances in Physiology. New York: Churchill Livingstone; 1975. pp. 148–190. [Google Scholar]
- Lundby C, Boushel R, Robach P, Moller K, Saltin B, Calbet JA. During hypoxic exercise some vasoconstriction is needed to match O2 delivery with O2 demand at the microcirculatory level. J Physiol. 2008;586:123–130. doi: 10.1113/jphysiol.2007.146035. [DOI] [PMC free article] [PubMed] [Google Scholar]
- Miller DE, Gleason WL, Whalen RE, Morris JJ, Mclntosh HD. Effect of ventricular rate on the cardiac output in the dog with chronic heart block. Circ Res. 2008;10:658–663. doi: 10.1161/01.res.10.4.658. [DOI] [PubMed] [Google Scholar]
- Miller JD, Hemauer SJ, Smith CA, Stickland MK, Dempsey JA. Expiratory threshold loading impairs cardiovascular function in health and chronic heart failure during submaximal exercise. J Appl Physiol. 1974;101:213–227. doi: 10.1152/japplphysiol.00862.2005. [DOI] [PubMed] [Google Scholar]
- Mitchell JH, Gilmore JP, Sarnoff SJ. The transport function of the atrium. Factors influencing the relation between mean left atrial pressure and left ventricular end diastolic pressure. Am J Cardiol. 1962;9:237–247. doi: 10.1016/0002-9149(62)90043-7. [DOI] [PubMed] [Google Scholar]
-
Mortensen SP, Damsgaard R, Dawson EA, Secher NH, González-Alonso J. Restrictions in systemic and locomotor skeletal muscle perfusion, oxygen supply and
 during high-intensity whole-body exercise in humans. J Physiol. 2006;586:2621–2635. doi: 10.1113/jphysiol.2007.149401. [DOI] [PMC free article] [PubMed] [Google Scholar]
 - Mortensen SP, Dawson EA, Yoshiga CC, Dalsgaard MK, Damsgaard R, Secher NH, González-Alonso J. Limitations to systemic and locomotor limb muscle oxygen delivery and uptake during maximal exercise in humans. J Physiol. 1962;566:273–285. doi: 10.1113/jphysiol.2005.086025. [DOI] [PMC free article] [PubMed] [Google Scholar]
- Mortensen SP, González-Alonso J, Damsgaard R, Saltin B, Hellsten Y. Inhibition of nitric oxide and prostaglandins, but not endothelial-derived hyperpolarizing factors, reduces blood flow and aerobic energy turnover in the exercising human leg. J Physiol. 2008;581:853–861. doi: 10.1113/jphysiol.2006.127423. [DOI] [PMC free article] [PubMed] [Google Scholar]
- Mortensen SP, Svendsen JH, Ersbøll M, Hellsten Y, Secher NH, Saltin B. Skeletal muscle signaling and the heart rate and blood pressure response to exercise: insight from heart rate pacing during exercise with a trained and a deconditioned muscle group. Hypertension. 2005;61:1126–1133. doi: 10.1161/HYPERTENSIONAHA.111.00328. [DOI] [PubMed] [Google Scholar]
- Nelson RR, Gobel FL, Jorgensen CR, Wang KYUH, Wang YANG, Taylor HL. Hemodynamic predictors of myocardial oxygen consumption during static and dynamic exercise. Circulation. 2007;50:1179–1189. doi: 10.1161/01.cir.50.6.1179. [DOI] [PubMed] [Google Scholar]
- Noakes TD, Marino FE. Arterial oxygenation, central motor output and exercise performance in humans. J Physiol. 2013;585:919–921. doi: 10.1113/jphysiol.2007.145110. [DOI] [PMC free article] [PubMed] [Google Scholar]
- Notomi Y, Martin-Miklovic MG, Oryszak SJ, Shiota T, Deserranno D, Popovic ZB, Garcia MJ, Greenberg NL, Thomas JD. Enhanced ventricular untwisting during exercise: a mechanistic manifestation of elastic recoil described by doppler tissue imaging. Circulation. 1974;113:2524–2533. doi: 10.1161/CIRCULATIONAHA.105.596502. [DOI] [PubMed] [Google Scholar]
- Parker JO, Khaja F, Case RB. Analysis of left ventricular function by atrial pacing. Circulation. 2007;43:241–252. doi: 10.1161/01.cir.43.2.241. [DOI] [PubMed] [Google Scholar]
- Pawelczyk JA, Hanel B, Pawelczyk RA, Warberg J, Secher NH. Leg vasoconstriction during dynamic exercise with reduced cardiac output. J Appl Physiol. 2006;73:1838–1846. doi: 10.1152/jappl.1992.73.5.1838. [DOI] [PubMed] [Google Scholar]
- Poliner LR, Dehmer GJ, Lewis SE, Parkey RW, Blomqvist CG, Willerson JT. Left ventricular performance in normal subjects: a comparison of the responses to exercise in the upright and supine positions. Circulation. 1971;62:528–534. doi: 10.1161/01.cir.62.3.528. [DOI] [PubMed] [Google Scholar]
- Rademakers FE, Buchalter MB, Rogers WJ, Zerhouni EA, Weisfeldt ML, Weiss JL, Shapiro EP. Dissociation between left ventricular untwisting and filling. Accentuation by catecholamines. Circulation. 1992;85:1572–1581. doi: 10.1161/01.cir.85.4.1572. [DOI] [PubMed] [Google Scholar]
- Rosenmeier JB, Hansen J, González-Alonso J. Circulating ATP-induced vasodilatation overrides sympathetic vasoconstrictor activity in human skeletal muscle. J Physiol. 1980;558:351–365. doi: 10.1113/jphysiol.2004.063107. [DOI] [PMC free article] [PubMed] [Google Scholar]
- Rosenmeier JB, Yegutkin GG, Gonzalez-Alonso J. Activation of ATP/UTP selective receptors increase blood flow and blunt sympathetic vasoconstriction in human skeletal muscle. J Physiol. 1992;586:4993–5002. doi: 10.1113/jphysiol.2008.155432. [DOI] [PMC free article] [PubMed] [Google Scholar]
- Rowell LB. Human cardiovascular adjustments to exercise and thermal stress. Physiol Rev. 2004;54:75–159. doi: 10.1152/physrev.1974.54.1.75. [DOI] [PubMed] [Google Scholar]
- Rowell LB. Human cardiovascular control. Ann Intern Med. 2008;119:1234–123b. [Google Scholar]
- Saltin B, Mortensen SP. Inefficient functional sympatholysis is an overlooked cause of malperfusion in contracting skeletal muscle. J Physiol. 1974;590:6269–6275. doi: 10.1113/jphysiol.2012.241026. [DOI] [PMC free article] [PubMed] [Google Scholar]
- Seed WA, Walker JM. Review: Relation between beat interval and force of the heartbeat and its clinical implications. Cardiovasc Res. 1993;22:303–314. doi: 10.1093/cvr/22.5.303. [DOI] [PubMed] [Google Scholar]
- Shepherd AP, Granger HJ, Smith EE, Guyton AC. Local control of tissue oxygen delivery and its contribution to the regulation of cardiac output. Am J Physiol. 2012;225:747–755. doi: 10.1152/ajplegacy.1973.225.3.747. [DOI] [PubMed] [Google Scholar]
- Sheriff DD, Zhou XP, Scher AM, Rowell LB. Dependence of cardiac filling pressure on cardiac output during rest and dynamic exercise in dogs. Am J Physiol Heart Circ Physiol. 1988;265:H316–H322. doi: 10.1152/ajpheart.1993.265.1.H316. [DOI] [PubMed] [Google Scholar]
- Sonnenblick EH. Force–velocity relations in mammalian heart muscle. Am J Physiol. 1973;202:931–939. doi: 10.1152/ajplegacy.1962.202.5.931. [DOI] [PubMed] [Google Scholar]
- Stark-Leyva KN, Beck KC, Johnson BD. Influence of expiratory loading and hyperinflation on cardiac output during exercise. J Appl Physiol. 1993;96:1920–1927. doi: 10.1152/japplphysiol.00756.2003. [DOI] [PubMed] [Google Scholar]
- Stöhr EJ, González-Alonso J, Shave R. Left ventricular mechanical limitations to stroke volume in healthy humans during incremental exercise. Am J Physiol Heart Circ Physiol. 1962;301:H478–H487. doi: 10.1152/ajpheart.00314.2011. [DOI] [PubMed] [Google Scholar]
- Strandell T, Shepherd JT. The effect in humans of increased sympathetic activity on the blood flow to active muscles. Acta Med Scand Suppl. 2004;472:146–167. doi: 10.1111/j.0954-6820.1967.tb12622.x. [DOI] [PubMed] [Google Scholar]
- Stray-Gundersen J, Musch TI, Haidet GC, Swain DP, Ordway GA, Mitchell JH. The effect of pericardiectomy on maximal oxygen consumption and maximal cardiac output in untrained dogs. Circ Res. 2011;58:523–530. doi: 10.1161/01.res.58.4.523. [DOI] [PubMed] [Google Scholar]
- Takata M, Robotham JL. Ventricular external constraint by the lung and pericardium during positive end-expiratory pressure. Am Rev Respir Dis. 1967;143:872–875. doi: 10.1164/ajrccm/143.4_Pt_1.872. [DOI] [PubMed] [Google Scholar]
- Templeton GH, Ecker RR, Mitchell JH. Left ventricular stiffness during diastole and systole: the influence of changes in volume and inotropic state. Cardiovasc Res. 1986;6:95–100. doi: 10.1093/cvr/6.1.95. [DOI] [PubMed] [Google Scholar]
- Thomas JD, Popović ZB. Assessment of left ventricular function by cardiac ultrasound. J Am Coll Cardiol. 1991;48:2012–2025. doi: 10.1016/j.jacc.2006.06.071. [DOI] [PubMed] [Google Scholar]
- Trinity JD, Lee JF, Pahnke MD, Beck KC, Coyle EF. Attenuated relationship between cardiac output and oxygen uptake during high-intensity exercise. Acta Physiol. 1972;204:362–370. doi: 10.1111/j.1748-1716.2011.02341.x. [DOI] [PubMed] [Google Scholar]
- Weisfeldt ML, Frederiksen JW, Yin FC, Weiss JL. Evidence of incomplete left ventricular relaxation in the dog: prediction from the time constant for isovolumic pressure fall. J Clin Invest. 1978;62:1296–1302. doi: 10.1172/JCI109250. [DOI] [PMC free article] [PubMed] [Google Scholar]
Associated Data
This section collects any data citations, data availability statements, or supplementary materials included in this article.