

Abstract
Background
Amide proton transfer (APT) imaging is a novel molecular MRI technique to detect endogenous mobile proteins and peptides through chemical exchange saturation transfer. We prospectively assessed the usefulness of APT imaging in predicting the histological grade of adult diffuse gliomas.
Methods
Thirty-six consecutive patients with histopathologically proven diffuse glioma (48.1 ± 14.7 y old, 16 males and 20 females) were included in the study. APT MRI was conducted on a 3T clinical scanner and was obtained with 2 s saturation at 25 saturation frequency offsets ω = −6 to +6 ppm (step 0.5 ppm). δB0 maps were acquired separately for a point-by-point δB0 correction. APT signal intensity (SI) was defined as magnetization transfer asymmetry at 3.5 ppm: magnetization transfer ratio (MTR)asym = (S[−3.5 ppm] − S[+3.5 ppm])/S0. Regions of interest were carefully placed by 2 neuroradiologists in solid parts within brain tumors. The APT SI was compared with World Health Organization grade, Ki-67 labeling index (LI), and cell density.
Results
The mean APT SI values were 2.1 ± 0.4% in grade II gliomas (n = 8), 3.2 ± 0.9% in grade III gliomas (n = 10), and 4.1 ± 1.0% in grade IV gliomas (n = 18). Significant differences in APT intensity were observed between grades II and III (P < .05) and grades III and IV (P < .05), as well as between grades II and IV (P < .001). There were positive correlations between APT SI and Ki-67 LI (P = .01, R = 0.43) and between APT SI and cell density (P < .05, R = 0.38). The gliomas with microscopic necrosis showed higher APT SI than those without necrosis (P < .001).
Conclusions
APT imaging can predict the histopathological grades of adult diffuse gliomas.
Keywords: amide proton transfer (APT) imaging, chemical exchange saturation transfer (CEST), glioma.
Gliomas are the most common primary neoplasms of the brain, varying histologically from low grade to high grade.1 The grading of gliomas is of significant clinical importance. Especially the discrimination between low-grade (grade II) and high-grade (grades III, IV) glioma is critical, since the prognosis differs substantially (eg, mean survival >5 y for grade II, and 2–3 y for grade III), and thus the therapeutic strategies could differ substantially.1,2 Because of their dismal prognosis, high-grade gliomas are usually treated with surgical resection followed by adjuvant radiation therapy and chemotherapy.2 High-grade gliomas misdiagnosed as low-grade gliomas will be treated less aggressively than necessary, and vice versa.
Diagnosis of gliomas relies on the histopathology as a gold standard, and today therapeutic decision relies not only on the histopathology but also more on molecular profile and genetic information.3 However, in the clinical settings, MRI greatly contributes to the management decisions in all phases of diagnosis, treatment, and follow-up of patients with gliomas due to its noninvasive nature. The standard MRI protocols, T2-weighted or fluid level attenuated inversion recovery (FLAIR) and contrast enhanced T1-weighted imaging, provide important information regarding surrounding edema, hemorrhage, necrosis, and blood–brain barrier disruption. Although all this information is helpful for characterizing gliomas,4,5 it is inadequate for accurate grading. Thus, the criterion standard for tumor grade is still histopathological assessment based on biopsy or surgical resection, which is invasive, and there can be inherent sampling errors associated with intratumoral histological heterogeneity in gliomas. Inappropriate sampling from sites with lower histological grade in a tumor may lead to underestimation of the true grades.
Many investigators have attempted to develop imaging biomarkers for the grading of gliomas. Diffusion-weighted imaging (DWI),6,7 perfusion-weighted imaging (PWI),8–10 and proton MR spectroscopy11,12 provide in vivo physiologic information for tumor characterization, and these methods have been found to be of increasing utility in assessments of the grade of gliomas. However, despite the numerous reports and widespread interest, these methods have frequently resulted in conflicting results or overlap in measured values. For example, some studies showed that the apparent diffusion coefficient (ADC) measured by DWI is helpful for discriminating high-grade from low-grade gliomas,6,7 but others did not.13 Therefore it is desirable to develop a novel imaging method that complements other MR methods and thus improves accuracy in grading gliomas.
Chemical exchange saturation transfer (CEST) has drawn considerable attention in the field of molecular imaging as a novel contrast mechanism in MRI.14 CEST contrast is achieved by applying a saturation pulse at the resonance frequency of a slow-intermediate exchanging proton site (–NH, –OH, or metal-bound water molecule) of endogenous or exogenous agents, and the resulting saturated or partially saturated spin is transferred to bulk water via chemical exchange.14–16 The net effect of CEST is to reduce the bulk water signal intensity (SI) detected in an imaging experiment, thereby providing negative contrast in an image.
Amide proton transfer (APT) imaging was developed as one of the endogenous CEST imaging techniques by Zhou et al.17 With this method, the exchange between protons of bulk water and the amide protons (–NH) of endogenous mobile proteins and peptides can be noninvasively imaged.18 Previous studies demonstrated that the APT SI was found to increase by 3%–4% in tumor compared with peritumoral brain tissue in an experimental rat gliosarcoma model at 4.7 T19 and human brain tumor at 3 T.20 In the latter study in patients, the APT SIs in 6 high-grade gliomas were higher than those in 3 low-grade gliomas.20 This preliminary result suggested the potential of APT imaging for grading gliomas based on this novel contrast mechanism in a clinical setting.
Since APT is a newly developed technique in neuroradiology, a further verification with a larger sample size to validate the preliminary results is required to determine whether APT imaging accurately reflects the pathological condition of diffuse glioma. Therefore, the purpose of the present study was to prospectively assess the ability of APT imaging for predicting the grade of adult diffuse gliomas with histopathological evaluations.
Materials and Methods
Patients
Thirty-six consecutive adult patients with diffuse glioma (48.1 ± 14.7 y old, 16 males and 20 females) who underwent subsequent surgical resection (n = 32) or biopsy (n = 4) were included in this prospective study. Recurrent gliomas after previous treatments (n = 8) were included; however, a separate analysis without those patients was also carried out. Thirty-four patients had supratentorial lesions, and the other 2 patients had infratentorial lesions. The interval between MRI and surgery was shorter than 2 weeks in all patients. This study was approved by the institutional review board, and informed consent was obtained.
MRI
MRI was performed on a 3T clinical scanner (Achieva TX, Philips Healthcare) equipped with a second-order shim, using an 8-channel head coil for signal reception and 2-channel parallel transmission via the body coil for radiofrequency (RF) transmission. The acquisition software was modified to alternate the operation of the 2 transmission channels during the RF saturation pulse, which enables long quasi-continuous RF saturation beyond the 50% duty cycle of a single RF amplifier, and to allow a special RF shimming for the saturation homogeneity of the alternated pulse.21
On a single slice corresponding to a maximum cross-section area of a tumor, 2-dimensional (2D) APT imaging was performed using a saturation pulse with a duration of 2 s (40 × 50 ms, sinc-gauss-shaped elements) and a saturation power level corresponding to B1,rms = 2 μT. For acquiring an APT Z-spectrum, the imaging was repeated at 25 saturation frequency offsets from ω = −6 to +6 ppm with a step of 0.5 ppm as well as 1 far off-resonant frequency (ω = −160 ppm) for signal normalization.
The other imaging parameters were as follows: fast spin-echo readout with driven equilibrium refocusing; echo train length (ETL) 128 (single-shot fast spin-echo); sensitivity encoding (SENSE) factor 2; repetition time (TR) = 5000 ms; echo time (TE) = 6 ms; Matrix = 128 × 128 (reconstructed to 256 × 256); slice thickness = 5 mm, field of view = 230 × 230 mm; scan time = 2 min 20 s for one Z-spectrum. A ΔB0 map for off-resonance correction was acquired separately using a 2D gradient echo with identical spatial resolution, and it was used for a point-by-point ΔB0 correction.
For reference, several standard MRIs, including T1-weighted, T2-weighted, FLAIR, and contrast enhanced T1-weighted images, were acquired. The following parameters were used—T2-weighted: ETL = 8, TR/TE = 3000/80 ms, 18 slices, thickness = 5 mm, SENSE factor = 1.6; T1-weighted: 3D magnetization-prepared rapid-segmented gradient-echo sequence, TR/TE = 2000/20 ms, inversion time = 800 ms, 18 slices, thickness = 1 mm, SENSE factor = 1.6; FLAIR: ETL = 27, TR/TE/2800 ms, 18 slices, SENSE factor = 1.6. The APT images were acquired before the administration of the gadolinium contrast agent in all patients.
APT Imaging Data Analysis
All image data were analyzed with the software program ImageJ v1.43u (National Institutes of Health [NIH]). A plug-in was created to assess the Z-spectra and magnetization transfer ratio asymmetry (MTRasym) equipped with a correction function for B0 inhomogeneity, using interpolation among the Z-spectral image data. First, rigid body motion correction was performed using the Turboreg algorithm.22 The local B0 field shift, in hertz, was obtained from the B0 map, which was created from dual-echo gradient-echo images (TE = 1 and 2 ms) according to the following equation: deltaB0(x) = (Phase[TE2](x)-Phase[TE1](x))/(TE2-TE1)*2*Pi, where phase [TEi](x) indicates phases of the images with echo times TE1 or TE2 at position x in radians, and TE1 and TE2 are given in seconds. The deltaB0(x) is the resulting B0 map measured in hertz. Each voxel was corrected in image intensity for the nominal saturation frequency offset by Lagrange interpolation among the neighboring Z-spectral images. This procedure corresponds to a frequency shift along the saturation frequency offset axis according to the measured B0 shift.
The MTR was defined as 1 − Ssat/S0, where Ssat and S0 are the SIs obtained with and without selective saturation, respectively.17 To reduce these undesired contributions from conventional magnetization transfer (MT) effect and direct saturation of bulk water, an asymmetry analysis of MTR with respect to the water frequency was performed. For APT imaging, the asymmetry analysis at 3.5 ppm downfield from the water signal was calculated as MTRasym (3.5 ppm):
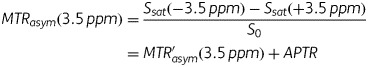 |
where MTR′asym is the inherent asymmetry of the conventional MT effect, and APTR is the amide proton transfer ratio.17 Thus, it should be noted that the measured MTRasym (3.5 ppm) is an apparent APT signal and thus it is appropriate to define the calculated MTRasym (3.5 ppm) images as APT weighted. In the present study, APT SI was defined as MTRasym (3.5 ppm) × 100 (%). The normalized APT SI was also calculated as the difference in APT SI between tumor and normal-appearing white matter (NAWM).
In the quantitative analysis, APT SIs were independently evaluated by 2 experienced neuroradiologists (14 and 12 y, respectively, of experience in neuroradiology) who were blinded to the clinical and histopathological data. Four circular regions of interest (ROIs) (∼0.3 cm2, 36 pixels) were carefully placed by each observer in the solid component of a tumor to include the area with the highest APT signal determined with visual inspection (Fig. 1), and the best effort was given to avoid cystic, large necrotic, or hemorrhagic components of the tumor with reference to conventional MRI. The strategy for the ROI analysis was based on the concept that regions of a tumor demonstrating the greatest grade determine the histological grade of the tumor. The measured APT signals in 4 ROIs were averaged to represent the tumor. The APT signal was also measured in a larger circular ROI (∼1.8 cm2, 200 pixels) placed in NAWM.
Fig. 1.

Placement of ROIs. Four circular ROIs were carefully placed in the solid component of a tumor to include the area with the highest APT signal determined by visual inspection. Cystic, necrotic, or hemorrhagic components were avoided with reference to conventional MRI. An ROI was also placed in contralateral NAWM.
Surgery and Pathological Evaluation
The pathological diagnosis was determined with specimens removed at surgical resection according to the World Health Organization (WHO) criteria by established neuropathologists. In addition to the conventional histopathological evaluation, the Ki-67 labeling index (LI) was determined using the standard procedure in 34 of the 36 patients.23 In the other 2 patients, Ki-67 LI could not be obtained due to the small biopsy sample. Briefly, fields with the highest number of Ki-67–labeled cells were initially selected through a generalized survey, and then the percentage of positively labeled cells was determined by counting more than 1000 tumor nuclei at ×200 magnification. Cell density was measured in 35 of the 36 patients. In the other patient, it could not be measured because of the small biopsy sample. In the measurement of cell density, fields with highest cell density were selected through a generalized survey, and then the number of cell nuclei was automatically measured at ×200 magnification on hematoxylin and eosin staining by using the “analyze particle” function in image-processing software (ImageJ v1.40g, NIH). A value averaged from more than 2 measurements was considered to be the representative cell density of the tumor. The presence of microscopic necrosis in tumors was evaluated by the established neuropathologists.
Statistical Analysis
All values are expressed as mean ± SD. Interobserver agreement for the tumor APT SIs from the 2 readers was analyzed by calculation of the intraclass correlation coefficient (ICC) and a simple linear regression analysis. ICCs are considered to be excellent if greater than 0.74.24 A Bland–Altman plot analysis was also carried out. Since the measured APT SIs by the 2 observers agreed well, these were averaged in each patient for further analyses. APT SIs or normalized APT SIs were compared among different WHO grades (II to IV) by one-way analysis of variance followed by Tukey's multiple comparison test or Student's t-test. The relationship between APT SI (or normalized APT SI) and Ki-67 LI or cell density was evaluated with a simple linear regression analysis. APT SIs were compared between the gliomas with and without intratumoral necrosis by Student's t-test. Statistical analyses were performed with a commercially available software package (SPSS, IBM 19, or Prism 5.0 GraphPad). P < .05 was considered significant.
Results
The numbers of patients with grades II, III, and IV gliomas were 8, 10, and 18, respectively (Table 1). Grade II gliomas included astrocytoma, oligodendroglioma, and oligoastrocytoma, and the grade III gliomas included anaplastic astrocytoma, anaplastic oligodendroglioma, and anaplastic oligoastrocytoma.
Table 1.
APT SI, normalized APT SI, and Ki-67 LI in each WHO grade and histology
| Histology | Number | APT SI (%) |
Normalized APT SI (%) |
Ki-67 LI |
|||
|---|---|---|---|---|---|---|---|
| Grade II (n = 8) | |||||||
| Astrocytoma | 4 | 2.2 ± 0.3 | 2.1 ± 0.4 | 2.1 ± 0.2 | 1.8 ± 0.7 | 6.0 ± 4.7 | 7.2 ± 5.6 |
| Oligodendroglioma | 3 | 1.8 ± 0.4 | 1.3 ± 0.9 | 5.2 ± 3.4 | |||
| Oligoastrocytoma | 1 | 2.5 | 2.3 | 17.8 | |||
| Grade III (n = 10) | |||||||
| Anaplastic astrocytoma | 3 | 3.6 ± 1.3 | 3.2 ± 0.9* | 2.7 ± 2.1 | 2.9 ± 1.6 | 16.5 ± 9.9 | 14.6 ± 7.5 |
| Anaplastic oligodendroglioma | 5 | 3.2 ± 0.6 | 3.2 ± 0.9 | 15.0 ± 6.2 | |||
| Anaplastic oligoastrocytoma | 2 | 2.5 ± 0.3 | 2.3 ± 0.7 | 14.0 ± 2.8 | |||
| Grade IV (n = 18) | |||||||
| Glioblastoma multiforme | 18 | 4.1 ± 1.0***, + | 3.8 ± 1.2** | 35.3 ± 19.2***, ++ | |||
*P < .05, **P < .01, ***P < .001, compared with grade II.
+P < .05, ++P < .01, compared with grade III.
Interobserver agreement between the 2 observers for the APT SIs of tumors in 36 patients was excellent, with an ICC of 0.81 and R2 of 0.67 (Fig. 2A). The Bland–Altman analysis of the difference in APT SIs measured by the 2 observers also showed excellent concordance, with only 2 values beyond the 95% limits of agreement (Fig. 2B).
Fig. 2.

Analyses of interobserver agreement. (A) The linear regression analysis shows high correlation in the APT SIs measured by the 2 observers. (B) The Bland–Altman analysis of the APT SIs measured by the 2 observers shows high concordance. Dashed lines show 95% limits of agreement.
Table 1 shows the mean APT SI, normalized SI, and Ki-67 LI in each grade and histology. The mean APT SI was 2.1 ± 0.4% (1.4%–2.5%) in the grade II gliomas (n = 8), 3.2 ± 0.9% (2.3%–5.1%) in the grade III gliomas (n = 10), and 4.1 ± 1.0% (2.8%–5.8%) in the grade IV gliomas (n = 18). The APT SIs of the grades III (P < .05) and IV (P < .001) gliomas were higher than those of the grade II gliomas. The APT SI of the grade IV gliomas was higher than that of the grade III gliomas (P < .05). When we grouped the grades III and IV as high-grade glioma and compared them with low-grade glioma (grade II), there was significance in APT SIs between the groups (P < .0001; Fig. 3). In the discrimination between low- (II) and high-grade gliomas (III, IV), the sensitivity and specificity were 93% and 100%, respectively, when a cutoff value of 2.54% was applied for APT SI (Fig. 3). No significant difference was found between astrocytic tumors (grades II and III, n = 7) and oligodendroglial tumors (grades II and III, n = 8) (P = .78). No difference was found between astrocytoma (grade II, n = 4) and oligodendroglioma (grade II, n = 3) (P = .21), and between anaplastic astrocytoma (grade III, n = 3) and anaplastic oligodendroglioma (grade III, n = 3) (P = .52). The normalized APT SI was higher in grade IV (P < .01) compared with grade II.
Fig. 3.

APT SI in low-grade (grade II) and high-grade (grades III and IV) glioma. The APT SIs in the high-grade gliomas were higher than in the low-grade glioma.
The mean value of Ki-67 LI was higher in grade IV than in grades II (P < .001) and III (P < .01). Figure 4 demonstrates the relationship between APT SI and Ki-67 LI or cell density. There was a moderate correlation between APT SI and Ki-67 LI (P = .01, R = 0.43). Normalized APT SI also correlated with Ki-67 LI (P < .05, R = 0.42). There was a positive correlation between APT SI and cell density (P < .05, R = 0.38). The gliomas with intratumoral necrosis (4.2 ± 1.0%, P < .0001) showed higher APT SIs than those without necrosis (2.7 ± 0.89%).
Fig. 4.

Correlation between APT SI and Ki-67 LI (A) or cell density (B). Moderate positive correlations are noted between the parameters.
When the patients with recurrent gliomas after previous treatment were excluded, the APT SIs of the grades III (2.9 ± 1.6%, P < .05) and IV (3.8 ± 1.1%, P < .001) gliomas were higher than those of the grade II gliomas (1.8 ± 0.7%), while the comparison between the grades III and IV did not reach statistical significance due to the small number of nontreated grade III patients (n = 6). There was significance in APT SIs between the low-grade (2.1 ± 0.4%) and high-grade groups (3.9 ± 1.1%, P < .0001). In the discrimination between low- and high-grade gliomas, the sensitivity and specificity were 95% and 100%, respectively, when a cutoff value of 2.54% was applied for APT SI. The normalized APT SIs were higher in grade IV (3.8 ± 1.1%, P < .001) compared with grade II (1.8 ± 0.7%).
Figures 5–7 show representative cases of grade II (astrocytoma), grade III (anaplastic oligodendroglioma), and grade IV (glioblastoma multiforme), respectively. Higher APT SI was observed in the higher-grade gliomas. The increase in APT SI was accompanied by an elevation of Ki-67 LI, which suggested more active proliferation of tumor cells in the higher-grade gliomas.
Fig. 5.

Astrocytoma (grade II) in a 42-year-old woman. (A) A transverse T2-weighted MRI shows a homogeneous hyperintensity area in the right temporal lobe. (B) A contrast enhanced transverse T1-weighted image shows no enhancement in the tumor. (C) The APT-weighted image shows a mild increase in SI (APT SI, 1.4%) in the tumor compared with normal brain tissue. (D) Ki-67 immunohistochemical staining shows few positive cells, indicating low proliferative activity of the tumor (Ki-67 LI, 1.3%).
Fig. 6.

Anaplastic oligodendroglioma (grade III) in a 25-year-old woman. (A) A transverse T2-weighted image shows a rather heterogeneously hyperintense area in the right frontal lobe. (B) A contrast enhanced transverse T1-weighted image shows faint enhancement in the tumor. (C) The APT-weighted image shows a mild to moderate increase in SI (APT SI, 2.8%) in the tumor compared with normal brain tissue. (D) Ki-67 immunohistochemical staining shows scattered positive cells (Ki-67 LI, 6.2%).
Fig. 7.

Glioblastoma multiforme (grade IV) in a 70-year-old woman. (A) A transverse T2-weighted image shows a heterogeneously hyperintense area in the left temporal lobe. (B) A contrast enhanced transverse T1-weighted image shows heterogeneous ringlike enhancement in the tumor. (C) The APT-weighted image shows high SI in the tumor compared with normal brain tissue (APT SI, 4.0%). (D) Ki-67 immunohistochemical staining shows a large number of positive cells, indicating high proliferative activity of the tumor (Ki-67 LI, 27.9%). High cell density is also noted.
Discussion
In the present study, we tested the ability of APT imaging for grading diffuse gliomas compared with histopathological grade as a gold standard. We found a significant increase in APT SI in the higher-grade gliomas: the APT SIs in high-grade gliomas (grades III and IV, 3.8 ± 1.0%) were higher than in the low-grade gliomas (grade II, 2.1 ± 0.4%). Our results in the larger cohort agree with the prediction by Zhou et al,17 demonstrating that the APT SIs in high-grade gliomas (2.9 ± 0.6%, n = 6) were higher than in low-grade gliomas (1.2 ± 0.2%, n = 3) in the limited population size. The absolute values between the studies are somehow different, but APT SI depends upon imaging and analytical method, as we will discuss. Zhou et al used shorter RF saturation (saturation duration = 500 ms) than ours (saturation duration = 2 s), which might have resulted in overall lower APT SI values. It was previously shown in an MR spectroscopy study25 that the concentration of mobile macromolecules including protein and peptides increases with the glioma grade.
We found a correlation between APT SI and Ki-67 LI or cell density. This result indicates that active proliferation of tumor cells is associated with a high concentration of mobile protein and peptides. Since it is assumed that amide protons in the cytoplasm are the major source of APT signals, it is reasonable that the APT signal is correlated with the cell proliferation marker Ki-67 and cell density. We believe that the relatively lower correlations (R = 0.43 for Ki-67 and R = 0.38 for cell density) between these parameters observed in the study was caused by the difference in sample size or location between histology and APT imaging. Other factors than intracellular component could affect ATP SI, as we will discuss.
Grades of glioma are histologically determined based on the presence of cellular and nuclear anaplasia, cellularity, mitoses, microvascular proliferation, and micro and macro necrosis. The source of high APT SI in high-grade gliomas is still unknown; however, we can assume that several histological factors contribute to the increased signal. High cellular content of proteins and peptides in high-grade glioma can cause increased signal. Our study is consistent with previous studies that also showed that tumors with high cellularity could show high APT SI, although they did not perform quantitative analyses.19,26 Concentration of mobile proteins and peptides per cell may increase with the grade of glioma. In the present study, tumors with necrosis showed higher APT SI than those without necrosis. Although it was difficult to confirm whether this was a direct relationship, highly concentrated mobile proteins and peptides in the extracellular space, such as microscopic necrosis or fluid collection in the microcystic space, might also increase APT SI in tumors. The alternation in tissue pH might affect APT SI.16,17 APT SI can be enhanced in tissues with increased pH because the amide proton exchange rate is base-catalyzed in the physiological pH range. Higher pH increases the proton exchange rate, which in turn increases the APT SI. Several studies27,28 of gliomas have indicated that a tissue pH was higher than that of normal brain tissue even though this difference was small (up to 0.2 pH unit). Further investigations are necessary to determine the source of APT.
Regarding differentiation between high- and low-grade gliomas, our study showed that APT SI provided excellent sensitivity (93%) and specificity (100%) with a cutoff value of 2.54%. The discrimination between high-grade (grades III, IV) and low-grade (grade II) glioma has been of great importance among investigators for a long time. The reported accuracy in radiologic grading of tumors by most common MRI methods (eg, T2-weighted imaging/FLAIR and contrast enhanced T1-weighted imaging) is not sufficient, with sensitivity in identifying high-grade gliomas ranging from 55.1%29 to 72.5%.30 Recently, newer MR techniques such as DWI, PWI, and MR spectroscopy could provide additional measures. Relative cerebral blood volume measured by PWI was found to increase with grade of gliomas, with sensitivity and specificity of 95.0% and 57.5%.30 MR spectroscopy showed that the choline level showed high sensitivity, 75.8%, but low specificity, 47.5%.30 Several DWI studies have found lower ADC values in high-grade gliomas than in low-grade gliomas. Lee et al31 provided sensitivity (87.5%) and specificity (79.0%) for differentiating tumor grades using DWI. Compared with these previous reports, our present results (sensitivity: 93%, specificity: 100%, with a cutoff value of 2.54%) are predominant. In addition, the method could differentiate grade II and grade III gliomas, which is the border between low and high grade. For these reasons, APT imaging appeared to provide superior diagnostic performance in grading gliomas.
Since APT imaging is a rapidly developing field, the imaging protocols have not yet been fully optimized, especially in human studies. For sensitive saturation transfer–based detection, long presaturation by continuous or quasi-continuous RF irradiation is needed (>1 s) to build up and maintain saturation of the amide protons and accumulate saturated protons in bulk water, which depend upon a relative exchange rate at a given magnetic field strength. However, duration of saturation pulse was limited to <1 s in previous studies, due to limits of the specific absorption rate and hardware limitations of clinical systems such as the RF amplifier duty cycle. This problem of saturation time limits was solved in the present study by using the 2 amplifiers of a parallel transmission MR system in alternation during the saturation pulses,21 enabling use of 2 s saturation. A recent study showed that APT contrast obtained with the 2 s saturation was higher than with 0.5 s or 1 s saturation in various types of human brain tumors, including gliomas.32 Thus, the long saturation might be helpful in the sensitive differentiation of glioma grades. It should be noted that the APT SI can be affected by many other factors, including tissue water content, pH, temperature, the T1 of water, and the background MT effect.17 To eliminate the effect of native MTRasym presumably caused by the solid-phase MT effect and possible intramolecular and intermolecular nuclear Overhauser effects of aliphatic protons, the magnitude of APT SI is often determined from the difference of MTRasym at the lesion and the contralateral regions in the previous brain studies.19,33 Hence, we calculated the normalized APT SI by NAWM, although there was no obvious difference in the results with and without the normalization because the APT SI in NAWM was stable in all patients. Data analyses that take other factors into consideration may be necessary to extract the true APT effect in future studies. In addition, it is necessary to confirm the reproducibility of APT imaging of brain tumor by a test-retest reliability study because APT imaging is a new method with limited in vivo applications.
The strengths of the present study include its prospective design, the short interval between imaging and surgery (<2 wk), and the complete histopathology-based diagnosis in all 36 patients. However, there were several limitations. First, there was a difficulty in accordance of the location for the ROIs for APT measurements with areas for the Ki-67 LI and cell density, as discussed previously. The direct matching between MRI and histology is challenging, especially in brain tumors, because the tumors are surgically removed piece by piece in most cases and the resected specimens possess little locational information. A second limitation was the single-slice acquisition used in the APT sequence due to limitation of total acquisition time in patient scans. Protocols with a fast 3D coverage like keyhole CEST34 are desirable for future studies in order to better characterize the typical tumor tissue heterogeneity in all dimensions. Thirdly, the ROIs were placed in solid parts of tumors manually by visual inspection. Cystic components as visible in the standard MRIs, which could show high APT SI, were avoided, but some contributions from microcysts that were invisible on images and extracellular fluid might have affected the results. Finally, the number of low-grade gliomas (grade II) was small compared with that of high-grade gliomas.
In conclusion, the APT SI was increased with the grade of glioma and correlated with the Ki-67 LI and cell density. APT imaging, which produces a novel endogenous contrast based on saturation transfer, can noninvasively predict the histopathological grades of adult diffuse gliomas. In the clinical setting, APT imaging can be useful in decisions regarding resection/biopsy sites and therapeutic strategy. In addition, the APT signal may be a reliable biomarker for therapeutic response and the prediction of outcome for patients with diffuse gliomas.
Funding
This work was supported by the Japanese Society of Neuroradiology, Japanese Radiological Society, Philips Electronics Japan, and Bayer Healthcare Japan.
Conflict of interest statement. Yuriko Suzuki is an employee of Philips Electronics Japan. Jochen Keupp is an employee of Philips Research Hamburg.
References
- 1.Louis DN, Ohgaki H, Wiestler OD, et al. The 2007 WHO classification of tumours of the central nervous system. Acta Neuropathol. 2007;114(2):97–109. doi: 10.1007/s00401-007-0243-4. [DOI] [PMC free article] [PubMed] [Google Scholar]
- 2.Clarke J, Butowski N, Chang S. Recent advances in therapy for glioblastoma. Arch Neurol. 2010;67(3):279–283. doi: 10.1001/archneurol.2010.5. [DOI] [PubMed] [Google Scholar]
- 3.Assi H, Candolfi M, Baker G, Mineharu Y, Lowenstein PR, Castro MG. Gene therapy for brain tumors: basic developments and clinical implementation. Neurosci Lett. 2012;527(2):71–77. doi: 10.1016/j.neulet.2012.08.003. [DOI] [PMC free article] [PubMed] [Google Scholar]
- 4.Dean BL, Drayer BP, Bird CR, et al. Gliomas: classification with MR imaging. Radiology. 1990;174(2):411–415. doi: 10.1148/radiology.174.2.2153310. [DOI] [PubMed] [Google Scholar]
- 5.Felix R, Schorner W, Laniado M, et al. Brain tumors: MR imaging with gadolinium-DTPA. Radiology. 1985;156(3):681–688. doi: 10.1148/radiology.156.3.4040643. [DOI] [PubMed] [Google Scholar]
- 6.Sugahara T, Korogi Y, Kochi M, et al. Usefulness of diffusion-weighted MRI with echo-planar technique in the evaluation of cellularity in gliomas. J Magn Reson Imaging. 1999;9(1):53–60. doi: 10.1002/(sici)1522-2586(199901)9:1<53::aid-jmri7>3.0.co;2-2. [DOI] [PubMed] [Google Scholar]
- 7.Bulakbasi N, Guvenc I, Onguru O, Erdogan E, Tayfun C, Ucoz T. The added value of the apparent diffusion coefficient calculation to magnetic resonance imaging in the differentiation and grading of malignant brain tumors. J Comput Assist Tomogr. 2004;28(6):735–746. doi: 10.1097/00004728-200411000-00003. [DOI] [PubMed] [Google Scholar]
- 8.Aronen HJ, Gazit IE, Louis DN, et al. Cerebral blood volume maps of gliomas: comparison with tumor grade and histologic findings. Radiology. 1994;191(1):41–51. doi: 10.1148/radiology.191.1.8134596. [DOI] [PubMed] [Google Scholar]
- 9.Sugahara T, Korogi Y, Kochi M, et al. Correlation of MR imaging–determined cerebral blood volume maps with histologic and angiographic determination of vascularity of gliomas. AJR Am J Roentgenol. 1998;171(6):1479–1486. doi: 10.2214/ajr.171.6.9843274. [DOI] [PubMed] [Google Scholar]
- 10.Shin JH, Lee HK, Kwun BD, et al. Using relative cerebral blood flow and volume to evaluate the histopathologic grade of cerebral gliomas: preliminary results. AJR Am J Roentgenol. 2002;179(3):783–789. doi: 10.2214/ajr.179.3.1790783. [DOI] [PubMed] [Google Scholar]
- 11.Kaminogo M, Ishimaru H, Morikawa M, et al. Diagnostic potential of short echo time MR spectroscopy of gliomas with single-voxel and point-resolved spatially localised proton spectroscopy of brain. Neuroradiology. 2001;43(5):353–363. doi: 10.1007/s002340000473. [DOI] [PubMed] [Google Scholar]
- 12.Dowling C, Bollen AW, Noworolski SM, et al. Preoperative proton MR spectroscopic imaging of brain tumors: correlation with histopathologic analysis of resection specimens. AJNR Am J Neuroradiol. 2001;22(4):604–612. [PMC free article] [PubMed] [Google Scholar]
- 13.Lam WW, Poon WS, Metreweli C. Diffusion MR imaging in glioma: does it have any role in the pre-operation determination of grading of glioma? Clin Radiol. 2002;57(3):219–225. doi: 10.1053/crad.2001.0741. [DOI] [PubMed] [Google Scholar]
- 14.Ward KM, Aletras AH, Balaban RS. A new class of contrast agents for MRI based on proton chemical exchange dependent saturation transfer (CEST) J Magn Reson. 2000;143(1):79–87. doi: 10.1006/jmre.1999.1956. [DOI] [PubMed] [Google Scholar]
- 15.Woods M, Woessner DE, Sherry AD. Paramagnetic lanthanide complexes as PARACEST agents for medical imaging. Chem Soc Rev. 2006;35(6):500–511. doi: 10.1039/b509907m. [DOI] [PMC free article] [PubMed] [Google Scholar]
- 16.van Zijl PC, Yadav NN. Chemical exchange saturation transfer (CEST): what is in a name and what isn't? Magn Reson Med. 2011;65(4):927–948. doi: 10.1002/mrm.22761. [DOI] [PMC free article] [PubMed] [Google Scholar]
- 17.Zhou J, Payen JF, Wilson DA, Traystman RJ, van Zijl PC. Using the amide proton signals of intracellular proteins and peptides to detect pH effects in MRI. Nat Med. 2003;9(8):1085–1090. doi: 10.1038/nm907. [DOI] [PubMed] [Google Scholar]
- 18.Zhou J, Lal B, Wilson DA, Laterra J, van Zijl PC. Amide proton transfer (APT) contrast for imaging of brain tumors. Magn Reson Med. 2003;50(6):1120–1126. doi: 10.1002/mrm.10651. [DOI] [PubMed] [Google Scholar]
- 19.Salhotra A, Lal B, Laterra J, Sun PZ, van Zijl PC, Zhou J. Amide proton transfer imaging of 9L gliosarcoma and human glioblastoma xenografts. NMR Biomed. 2008;21(5):489–497. doi: 10.1002/nbm.1216. [DOI] [PMC free article] [PubMed] [Google Scholar]
- 20.Zhou J, Blakeley JO, Hua J, et al. Practical data acquisition method for human brain tumor amide proton transfer (APT) imaging. Magn Reson Med. 2008;60(4):842–849. doi: 10.1002/mrm.21712. [DOI] [PMC free article] [PubMed] [Google Scholar]
- 21.Keupp J, Baltes C, Harver P, Van den Brink J. Parallel RF Transmission based MRI Technique for Highly Sensitive Detection of Amide Proton Transfer in the Human Brain at 3T [Abstract]. Proceedings of the 19th Annual Meeting of the International Society for Magnetic Resonance in Medicine; 7–13 May 2011. [Google Scholar]
- 22.Thevenaz P, Ruttimann UE, Unser M. A pyramid approach to subpixel registration based on intensity. IEEE Trans Image Process. 1998;7(1):27–41. doi: 10.1109/83.650848. [DOI] [PubMed] [Google Scholar]
- 23.Imbalzano KM, Tatarkova I, Imbalzano AN, Nickerson JA. Increasingly transformed MCF-10A cells have a progressively tumor-like phenotype in three-dimensional basement membrane culture. Cancer Cell Int. 2009;9:7. doi: 10.1186/1475-2867-9-7. [DOI] [PMC free article] [PubMed] [Google Scholar]
- 24.Shrout PE, Fleiss JL. Intraclass correlations: uses in assessing rater reliability. Psychol Bull. 1979;86(2):420–428. doi: 10.1037//0033-2909.86.2.420. [DOI] [PubMed] [Google Scholar]
- 25.Howe FA, Barton SJ, Cudlip SA, et al. Metabolic profiles of human brain tumors using quantitative in vivo1H magnetic resonance spectroscopy. Magn Reson Med. 2003;49(2):223–232. doi: 10.1002/mrm.10367. [DOI] [PubMed] [Google Scholar]
- 26.Wen Z, Hu S, Huang F, et al. MR imaging of high-grade brain tumors using endogenous protein and peptide-based contrast. Neuroimage. 2010;51(2):616–622. doi: 10.1016/j.neuroimage.2010.02.050. [DOI] [PMC free article] [PubMed] [Google Scholar]
- 27.Ha DH, Choi S, Oh JY, Yoon SK, Kang MJ, Kim KU. Application of (31)P MR spectroscopy to the brain tumors. Korean J Radiol. 2013;14(3):477–486. doi: 10.3348/kjr.2013.14.3.477. [DOI] [PMC free article] [PubMed] [Google Scholar]
- 28.Maintz D, Heindel W, Kugel H, Jaeger R, Lackner KJ. Phosphorus-31 MR spectroscopy of normal adult human brain and brain tumours. NMR Biomed. 2002;15(1):18–27. doi: 10.1002/nbm.735. [DOI] [PubMed] [Google Scholar]
- 29.Herminghaus S, Pilatus U, Moller-Hartmann W, et al. Increased choline levels coincide with enhanced proliferative activity of human neuroepithelial brain tumors. NMR Biomed. 2002;15(6):385–392. doi: 10.1002/nbm.793. [DOI] [PubMed] [Google Scholar]
- 30.Law M, Yang S, Wang H, et al. Glioma grading: sensitivity, specificity, and predictive values of perfusion MR imaging and proton MR spectroscopic imaging compared with conventional MR imaging. AJNR Am J Neuroradiol. 2003;24(10):1989–1998. [PMC free article] [PubMed] [Google Scholar]
- 31.Lee EJ, Lee SK, Agid R, Bae JM, Keller A, Terbrugge K. Preoperative grading of presumptive low-grade astrocytomas on MR imaging: diagnostic value of minimum apparent diffusion coefficient. AJNR Am J Neuroradiol. 2008;29(10):1872–1877. doi: 10.3174/ajnr.A1254. [DOI] [PMC free article] [PubMed] [Google Scholar]
- 32.Togao O, Yoshiura T, Keupp J, et al. Effect of Saturation Pulse Length on Parallel Transmission Based Amide Proton Transfer (APT) Imaging of Different Brain Tumor Types [Abstract]. Proceedings of the 20th Annual Meeting of the International Society for Magnetic Resonance in Medicine; 5–11 May 2012. [Google Scholar]
- 33.van Zijl PC, Zhou J, Mori N, Payen JF, Wilson D, Mori S. Mechanism of magnetization transfer during on-resonance water saturation. A new approach to detect mobile proteins, peptides, and lipids. Magn Reson Med. 2003;49(3):440–449. doi: 10.1002/mrm.10398. [DOI] [PubMed] [Google Scholar]
- 34.Varma G, Lenkinski RE, Vinogradov E. Keyhole chemical exchange saturation transfer. Magn Reson Med. 2012;68(4):1228–1233. doi: 10.1002/mrm.23310. [DOI] [PMC free article] [PubMed] [Google Scholar]