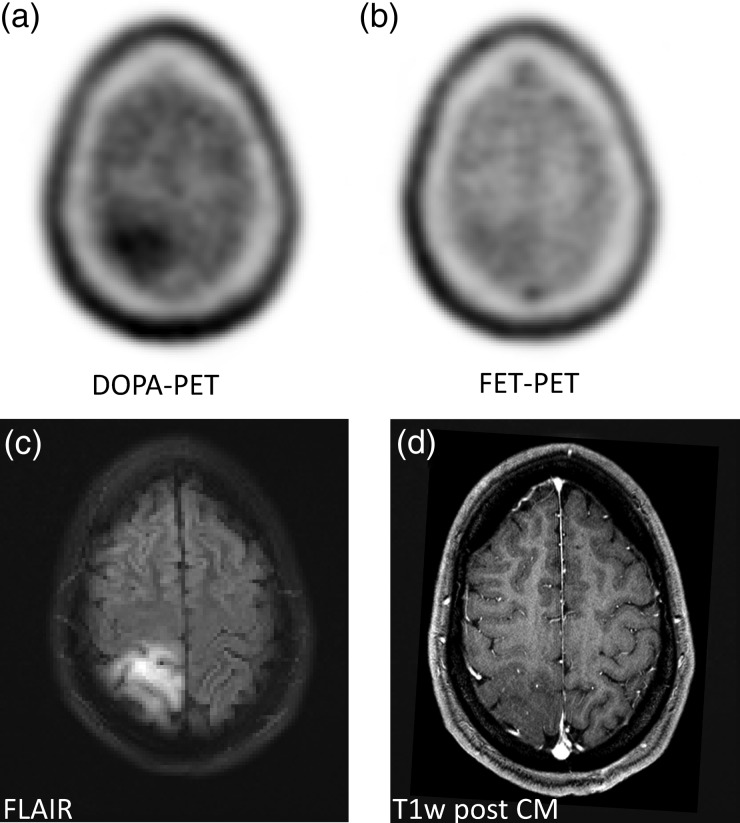
Abstract
Background
Both 18F-fluorodihydroxyphenylalanine (18F-DOPA) and 18F-fluoroethyltyrosine (18F-FET) have already been used successfully for imaging of brain tumors. The aim of this study was to evaluate differences between these 2 promising tracers to determine the consequences for imaging protocols and the interpretation of findings.
Methods
Forty minutes of dynamic PET imaging were performed on 2 consecutive days with both 18F-DOPA and 18F-FET in patients with recurrent low-grade astrocytoma (n = 8) or high-grade glioblastoma (n = 8). Time-activity-curves (TACs), standardized uptake values (SUVs) and compartment modeling of both tracers were analyzed, respectively.
Results
The TAC of DOPA-PET peaked at 8 minutes p.i. with SUV 5.23 in high-grade gliomas and 10 minutes p.i. with SUV 4.92 in low-grade gliomas. FET-PET peaked at 9 minutes p.i. with SUV 3.17 in high-grade gliomas and 40 minutes p.i. with SUV 3.24 in low-grade gliomas. Neglecting the specific uptake of DOPA into the striatum, the tumor-to-brain and tumor-to-blood ratios were higher for DOPA-PET. Kinetic modeling demonstrated a high flow constant k1 (mL/ccm/min), representing cellular internalization through AS-transporters, for DOPA in both high-grade (k1 = 0.59) and low-grade (k1 = 0.55) tumors, while lower absolute values and a relevant dependency from tumor-grading (high-grade k1 = 0.43; low-grade k1 = 0.33) were observed with FET.
Conclusions
DOPA-PET demonstrates superior contrast ratios for lesions outside the striatum, but SUVs do not correlate with grading. FET-PET can provide additional information on tumor grading and benefits from lower striatal uptake but presents lower contrast ratios and requires prolonged imaging if histology is not available in advance due to a more variable time-to-peak.
Keywords: brain tumor, DOPA, FET, positron emission tomography
Radiolabeled amino acids for single photon emission computed tomography (SPECT) and positron emission tomography (PET) have been under evaluation for several decades.1,2 However, gamma emitting tracers such as 123I-iodo-alpha-methyl-tyrosine, suffer from the limited resolution and low signal-to-noise ratio of the current SPECT technique.3,4 The first frequently used amino acid for PET was 11C-methionine (MET), but the short half-life of 11C (20 min) limited its application to centers with an on-site cyclotron.2 Therefore, 18F-labeled tracers have been introduced to provide both high resolution and practicable half-life (110 min) for routine applications.5,6 One of them, L-3,4-dihydroxy-6-18F-fluoro-phenyl-alanine (18F-DOPA), was found to be a multitargeted molecule.7 As a precursor of dopamine, it was used to trace the dopaminergic pathway in the nigrostriatal region to evaluate the presynaptic function in patients with neurodegenerative and movement disorders. Another common indication has been the evaluation of neuroendocrine tumors that present with the ability to take up amino acids and transform them into biogenic amines such as noradrenaline (pheochromocytoma) or serotonin (carcinoids) by decarboxylation (APUD tumors, “amine precursor uptake and decarboxylation”). 18F-DOPA also demonstrated the ability to distinguish between the diffuse and focal types of congenital hyperinsulinemia.7 Finally, 18F-DOPA is a substrate to the large neutral amino acid transport system that is highly expressed in primary brain tumors.8 In 2009, 18F-DOPA was approved in Europe for evaluation of recurrent brain tumors, as documented in the official product insert, and is now routinely used in our institution.9 O-(2-18F-fluoroethyl)-L-tyrosine (18F-FET) emerged in the same time frame as a promising PET tracer for brain tumors, and its scientific applications are growing rapidly because of its efficient radiosynthesis.10,11,12 However, no explicit side-by-side comparison of these 2 18F-labeled amino acid analogs has been performed until now. The present analysis evaluates 18F-FET and 18F-DOPA for glial brain tumors to compare their kinetics, correlation with tumor grading, and impact upon target tissue delineation when planning radiation treatment.
Materials and Methods
Patients
Eight participants with WHO grade II astrocytoma and 8 participants with WHO grade IV glioblastoma were evaluated; Histological validation had been performed in all participants.
18F-DOPA-PET is used routinely at our institution for diagnosis of glial brain tumors. However, for the definition of exact treatment volumes in high-precision radiation therapy, we currently relay on 18F-FET PET because for recurrent gliomas more literature is available with this compound.13,14 Thus, patients may receive both imaging modalities for diagnostic and treatment planning. For treatment planning, all participants were treated with particle therapy within protocol for the prospective clinical trials CLEOPATRA (Trial Registration NCT01165671) and CINDERELLA (NCT01166308). Ethics committee approval had been previously obtained at our institution, as was approval in accordance with our national regulations.
PET Imaging
All examinations were done with a Biograph 6 PET/CT (Siemens). First, a low-dose CT of the skull was done to allow for attenuation correction. Next, 40 minutes of list-mode acquisition were done following i.v. bolus injection of 175 ± 25 MBq 18F-DOPA (iaso-dopa; Iason,) and exactly 24 hours later following the injection of 175 ± 25 MBq 18F-FET (Iason). One hour before the injection of 18F-DOPA 100 mg carbidopa (Lodosyn;Valeant) were administered to inhibit tracer metabolism by peripheral decarboxylase activity.15,16 For high-resolution static images, a frame 20–40 min p.i. was reconstructed with an ordered-subset expectation maximization algorithm consisting of 4 iterations with 16 subsets and gauss filtering with a full width at half maximum of 3 mm. For kinetic modeling, the dynamic PET data were reconstructed into frames of 6 × 20 s, 8 × 60 s, and 6 × 300 s with ordered-subset expectation maximization algorithm using 4 iterations with 8 subsets and gauss filtering to a full width at half maximum of 5 mm. The arterial input function was derived from a region-of-interest (ROI) placed into the carotid and identified in the early vascular phase. Tumor volume-of-interest (VOI) was defined by an automatic isocontour with a cut-off at 70% of the maximum standard uptake value (SUV). The calculations of the flow constants in the 3-compartment kinetic modeling were done with the established PMOD software (PMOD Technologies Ltd).
Results
Time-activity Curves of Dynamic PET
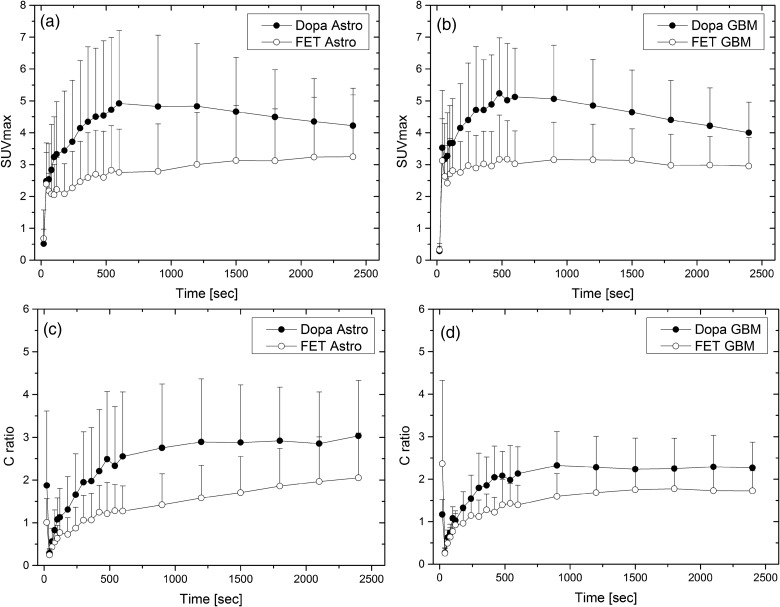
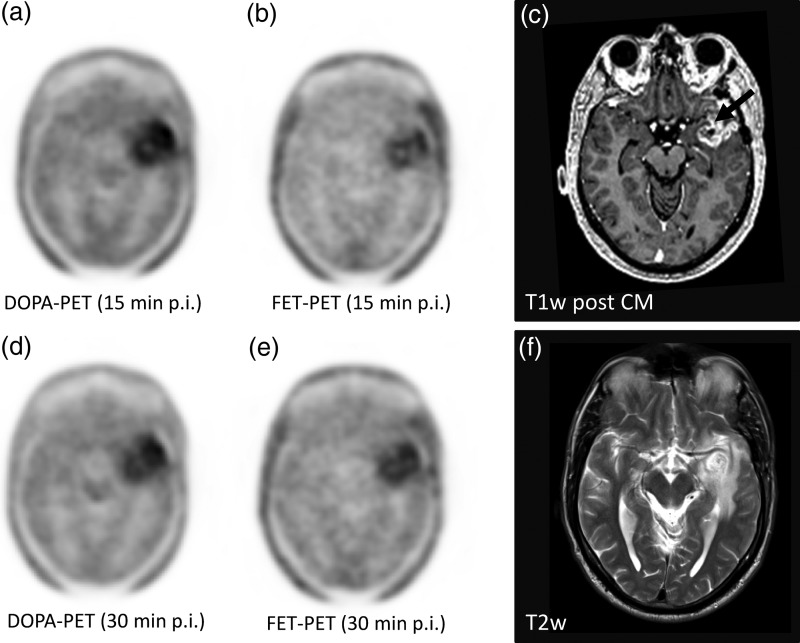
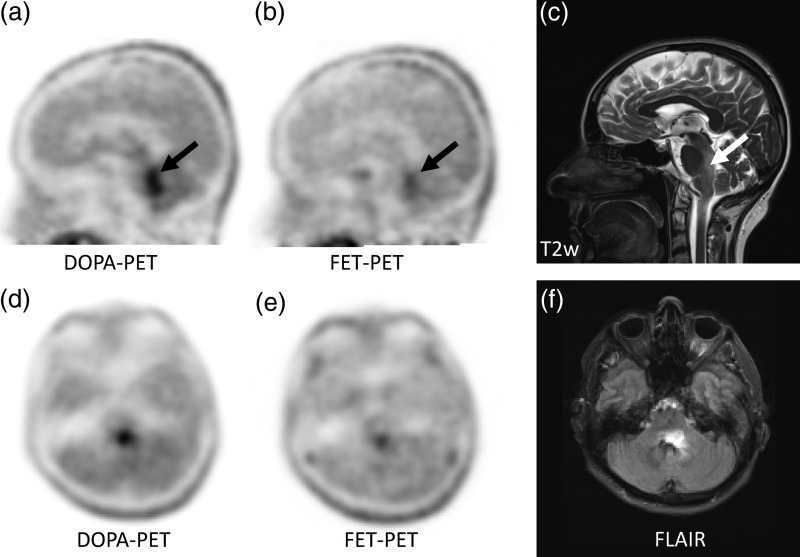
The time-activity curves (TACs) of DOPA-PET peaked at 8 minutes p.i. with a mean SUV of 5.23 in high-grade gliomas and 10 minutes p.i. with a mean SUV of 4.92 in low-grade gliomas. FET-PET peaked at 9 minutes p.i. with a mean SUV of 3.17 in high-grade gliomas and 40 minutes p.i. with a mean SUV of 3.24 in low-grade gliomas (Fig. 1a and b). Also, the contrast ratios for tumor-to-brain and tumor-to-blood were higher for DOPA-PET in all time-points (Fig. 1c and d). After peak accumulation, we found a washout phase for both histological subtypes in DOPA-PET. In contrast, we found a similar, but less pronounced, washout phase only in glioblastomas with FET (Figs 1 and 2), while the peak was not reached until 40 minutes p.i. in astrocytomas, presenting a steady increase of accumulation. However, even 40 minutes p.i., the contrast ratio of tumor-to-blood was higher with DOPA than with FET in astrocytoma (Figs 1 and 3). There was no statistically significant difference between the absolute SUVs in high- versus. low-grade gliomas for both tracers (neither 18F-DOPA nor 18F-FET).
Fig. 1.
Time-activity-curves of FET vs. DOPA-PET presented in absolute SUVs (a and b) and tumor-to-blood-ratios (c and d) for astrocytoma and glioblastoma in an intra-individual comparison, respectively.
Fig. 2.
In a participant with glioblastoma, the typical contrast media enhancement in T1-weighted MRI for high grade gliomas was found (c, arrow), surrounded by edema with higher signal intensities in T2w (f). In DOPA-PET, a washout from the 15-minute (a) to the 30-minute (d) p.i. frame and a moderate washout in FET-PET(b) versus (e) were observed.
Fig. 3.
An astrocytoma in the brain stem demonstrates superior delineation in DOPA-PET (a and d) in comparison with FET-PET (b and e). The lesion was also identified on T2w (c) and FLAIR (f) in MRI.
Kinetic Modeling
Kinetic modeling demonstrated a high flow constant k1 [mL/ccm/min], representing cellular internalization through AS-transporters for DOPA in both high-grade (k1 = 0.59) and low-grade (k1 = 0.55) tumors, while lower absolute values and relevant dependency from tumor-grading (high-grade: k1 = 0.43; low-grade k1 = 0.33; P value N/S) were observed with FET (Table 1). For the participants with astrocytoma, the k1 of DOPA was significantly higher than the k1 of FET-(P = .005). We did not find any significant differences in the other flow constants. For the participants with glioblastoma, the result was similar with significantly (P = .032) higher k1 for DOPA than for FET. None of the other flow constants demonstrated significant differences between both tracers.
Table 1.
Two-compartment modeling of tracer kinetics
| K1 | K2 | K3 | K4 | VB | Vs | Vt | Flux | |
|---|---|---|---|---|---|---|---|---|
| mL/ccm/min | 1/min | 1/min | 1/min | 1/1 | mL/ccm | mL/ccm | mL/ccm/min | |
| Astrocytoma | ||||||||
| FET | ||||||||
| Mean | 0.3274 | 0.3883 | 0.1065 | 0.0821 | 0.1766 | 1.4815 | 2.5281 | 0.0670 |
| SD | 0.2037 | 0.2390 | 0.0695 | 0.0644 | 0.0473 | 0.9214 | 1.2164 | 0.0392 |
| DOPA | ||||||||
| Mean | 0.5471 | 0.2659 | 0.0567 | 0.4956 | 0.1887 | 0.9856 | 3.5330 | 0.0925 |
| SD | 0.2908 | 0.1524 | 0.0594 | 1.2132 | 0.0872 | 0.4030 | 1.0505 | 0.1044 |
| Glioblastoma | ||||||||
| FET | ||||||||
| Mean | 0.4280 | 0.4972 | 0.1411 | 0.1044 | 0.1887 | 1.0787 | 2.0504 | 0.0875 |
| SD | 0.2300 | 0.0813 | 0.1287 | 0.0641 | 0.1258 | 0.3847 | 0.6206 | 0.0615 |
| DOPA | ||||||||
| Mean | 0.5878 | 0.3834 | 0.1911 | 0.3474 | 0.2010 | 1.2441 | 2.9583 | 0.1663 |
| SD | 0.1690 | 0.1867 | 0.2245 | 0.3256 | 0.1152 | 0.9789 | 1.0079 | 0.1227 |
Diagnostic Value Based on Static Images
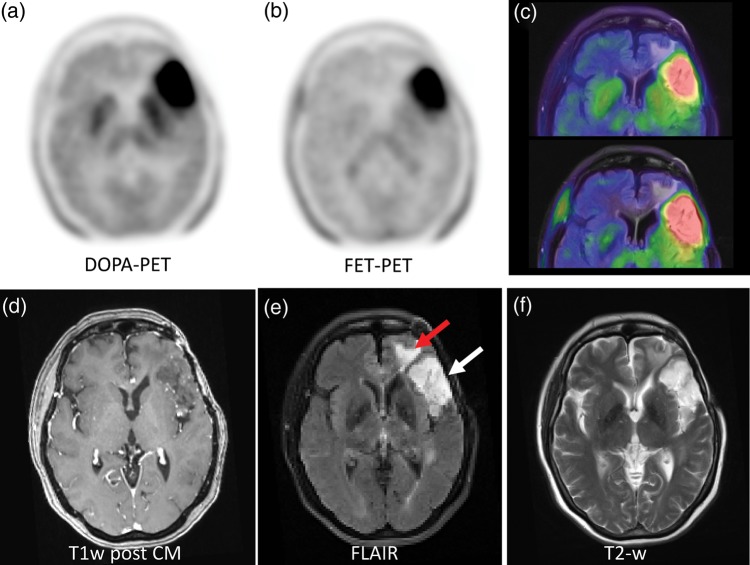
When reading the reconstructed static images, both amino acid tracers demonstrated a similar uptake pattern in tumor and normal brain. The normal distribution differs in a higher specific uptake of DOPA in the striatum. That can limit delineation of lesions close to the basal ganglia. With FET, a higher blood pool background is commonly found in the venous brain sinuses (Supplement Fig. 1). In 15 of 16 participants the diagnostic interpretation was equal with both tracers. For example, it was possible to distinguish between tumor extension and surrounding edema in low grade glioma (Fig. 4). However, in one participant with histologically proven astrocytoma grade II, FET-PET was interpreted as false-negative but DOPA true-positive (Fig. 5).
Fig. 4.
A participant with low-grade glioma, which is rarely delineable in contrast-enhanced T1w (d). The FLAIR (e) and T2 (f) weighted sequences demonstrate elevated signal intensity in the anterior temporal (e, white arrow) and the lateral frontal lobe (e, red arrow) but cannot differentiate between tumor and edema. With both, DOPA (a) and FET (b) PET, the malignant tissue was equally demarcated as presented in the fusion images (c).
Fig. 5.
A histologically proven low-grade astrocytoma (WHO grade II) was diagnosed as true-positive with DOPA but not with FET-PET (a and b). Morphologically, the lesion appeared hyperintense in the FLAIR sequence (typical for a low grade lesions) but without contrast enhancement in T1w (d).
Discussion
The present study compared 18F-DOPA and 18F-FET in participants with recurrent brain tumors. Both radiopharmaceuticals have already been used independently in PET imaging evaluation of primary brain tumors. In a study comparing newly diagnosed and recurrent gliomas, a correlation of 18F-DOPA uptake with proliferation and tumor grade was only found in untreated tumors but not previously treated tumors.17 This was in accordance with previous experience. Studies predominantly investigating newly diagnosed gliomas demonstrated a positive correlation between 18F-DOPA uptake and tumor histology;18 studies relying predominantly on recurrent tumors did not.19,20 In contrast, the uptake kinetics of 18F-FET were found to discriminate between different tumor gradings in untreated as well as recurrent gliomas.21,22 In accordance with the literature, we did not find a significant difference in SUV between high- and low-grade gliomas in our cohort of pretreated participants using 18F-DOPA.17 Also, with 18F-FET, no reliable correlation with tumor grade could be observed with static imaging and SUV alone in our investigation. In contrast with 18F-DOPA, we found the uptake kinetics of 18F-FET in dynamic PET to be superior in predicting tumor grade than SUVs derived from static PET; this result is well in line with previously published studies.21,22 In addition to the already suggested interpretation criteria for TACs,22 we also found a quantitative difference in k1 between low- and high-grade gliomas in the kinetic modeling of 18F-FET. The fact that this criterion did not reach statistical significance can most probably be explained by the limited number of participants investigated within the present study. This information warrants further investigation because precise identification of tumor grading, using noninvasive means such as imaging, can be of particular clinical interest.
Earlier studies evaluating 18F-DOPA or 18F-FET differed significantly in the imaging implementation (eg, static vs dynamic scanning), kinetic evaluation and reconstruction algorithms as well as in pretreatments of recurrent tumors. Therefore, it remained unclear whether the different results can be attributed to the particular tracer or if they were caused by the different study methodology. Also, the reported SUVs cannot be compared directly due to the lack of scanner cross-calibration. Here, we report an intra-individual comparison between examinations with 18F-DOPA and 18F-FET that were done exactly 24 hours apart with the identical PET-scanner, reconstruction protocols, and similar injected activities, respectively. Due to the strict standardization of the examination environment as the major strength of this study, the observed differences in SUVs, TACs, and tracer pharmacokinetics can be attributed to tracer-inherent characteristics. We found significantly higher absolute SUVs and higher tumor-to-blood ratios for the PET imaging with 18F-DOPA, which was most pronounced in low-grade gliomas. Consequently, one histologically proven WHO grade II astrocytoma was true-positive with DOPA but false-negative with FET (Fig. 5). However, due to the physiologic uptake of 18F-DOPA in the striatum, tumor delineation can be challenging for lesions close to the basal nuclei.
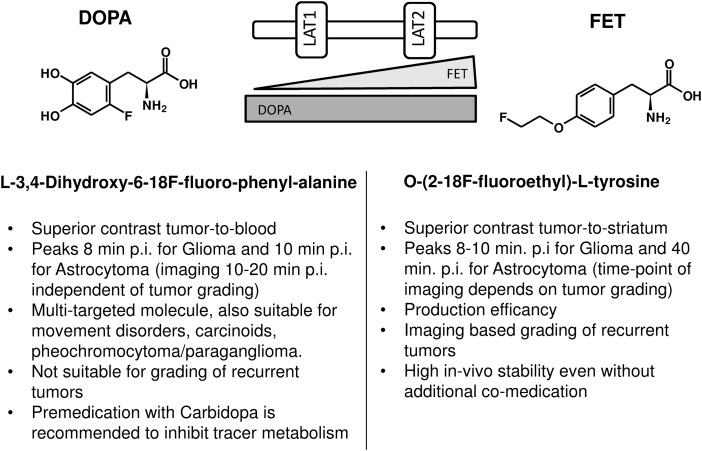
TAC analysis confirmed the hypothesis for PET with 18F-FET that a washout from 10 minutes p.i. to 40 minutes p.i. was characteristic for WHO grade IV gliomas and a continuous rise until 40 minutes p.i. was typical for WHO grade II astrocytomas.21,22 In contrast, with 18F-DOPA we found a washout curve independent from the tumor histology. Kinetic modeling revealed, that k1 (the flow constant representing internalization from the blood stream through amino acid transporters into the cells) is mainly responsible for the higher uptake of DOPA in general and also for the different uptake pattern between low- and high-grade gliomas with FET. Since DOPA is a substrate for the L-system amino acid transporters LAT1 and LAT2,23–26 the higher tumor uptake of DOPA presented in SUV and k1 is reasonable. FET is a poor substrate to LAT1 and is more selectively transported through LAT2, which might translate into lower absolute SUVs and lower k1.11,12 The first amino acid tracer for the PET-evaluation of brain tumors was 11C-Methionin (MET). MET is also transported by LAT1 and LAT2, similarly to DOPA.23,27 Therefore the extensive experience gained with MET over the last decade can be more directly transferred to DOPA than to FET. Similar to our study, the SUV of MET-PET was slightly higher than the SUV of FET-PET in a comparative study (mean SUV MET 3.3 vs. FET 2.7).28 However, it has been reported that LAT1 can be overexpressed in inflammation, while LAT2 is more tumor selective.29 Therefore, a higher risk for false-positive findings might be considered for DOPA than for FET. Since all participants had proven relapse before entering our investigation, there was no chance to find false-positive results. Another limitation of the presented study is that the observations are only valid in recurrent brain tumors and transferability to untreated gliomas might be limited.
The discussed advantages of DOPA and FET for different clinical settings are summarized in Fig. 6. Knowledge about tracer-inherent characteristics may be predominantly of interest in regard to scientific application. In the clinical setting, (eg, for radiation planning), both tracers are exchangeable, and target volume delineation is performed, taking together information obtained from CT, MRI as well as PET imaging. However, patients with low-grade gliomas without involvement of the striatum may benefit from the higher contrast of 18F-DOPA, whereas patients with possible involvement of basal ganglia should be examined with 18F-FET irrespective of tumor grade.
Fig. 6.
The respective advantages of DOPA and FET for different aspects of brain tumor imaging.
In conclusion, DOPA-PET demonstrates superior contrast ratios for lesions outside the striatum, but SUVs do not correlate with grading. FET-PET can provide additional information on tumor grading and benefits from lower striatal uptake but presents lower contrast ratios and requires prolonged imaging if histology is not available in advance due to a more variable time-to-peak.
Supplementary Material
Funding
This work was supported in part by the KlinischeForschergruppeSchwerionentherapie KFO 214.
Conflict of interest statement. None declared.
Supplementary Material
References
- 1.Langen KJ, Roosen N, Coenen HH, et al. Brain and brain tumor uptake of L-3-[123I]iodo-alpha-methyl tyrosine: competition with natural L-amino acids. J Nucl Med. 1991;32(6):1225–1229. [PubMed] [Google Scholar]
- 2.Derlon JM, Bourdet C, Bustany P, et al. [11C]L-methionine uptake in gliomas. Neurosurgery. 1989;25(5):720–728. doi: 10.1097/00006123-198911000-00006. [DOI] [PubMed] [Google Scholar]
- 3.Langen KJ, Ziemons K, Kiwit JC, et al. 3-[123I]iodo-alpha-methyltyrosine and [methyl-11C]-L-methionine uptake in cerebral gliomas: a comparative study using SPECT and PET. J Nucl Med. 1997;38(4):517–522. [PubMed] [Google Scholar]
- 4.Henze M, Mohammed A, Schlemmer HP, et al. PET and SPECT for detection of tumor progression in irradiated low-grade astrocytoma: a receiver-operating-characteristic analysis. J Nucl Med. 2004;45(4):579–586. [PubMed] [Google Scholar]
- 5.Heiss WD, Wienhard K, Wagner R, et al. F-Dopa as an amino acid tracer to detect brain tumors. J Nucl Med. 1996;37(7):1180–1182. [PubMed] [Google Scholar]
- 6.Pauleit D, Floeth F, Hamacher K, et al. O-(2-[18F]fluoroethyl)-L-tyrosine PET combined with MRI improves the diagnostic assessment of cerebral gliomas. Brain. 2005;128(Pt 3):678–687. doi: 10.1093/brain/awh399. [DOI] [PubMed] [Google Scholar]
- 7.Minn H, Kauhanen S, Seppänen M, Nuutila P. 18F-FDOPA: a multiple-target molecule. J Nucl Med. 2009;50(12):1915–1918. doi: 10.2967/jnumed.109.065664. [DOI] [PubMed] [Google Scholar]
- 8.Youland RS, Kitange GJ, Peterson TE, et al. The role of LAT1 in (18)F-DOPA uptake in malignant gliomas. J Neurooncol. 2013;111(1):11–18. doi: 10.1007/s11060-012-0986-1. [DOI] [PMC free article] [PubMed] [Google Scholar]
- 9. Iasodopa product insert available at http://www.iason.eu/en/products/iasodopa.html. Accessed June 26, 2013.
- 10.Wester HJ, Herz M, Weber W, et al. Synthesis and radiopharmacology of O-(2-[18F]fluoroethyl)-L-tyrosine for tumor imaging. J Nucl Med. 1999;40(1):205–212. [PubMed] [Google Scholar]
- 11.Heiss P, Mayer S, Herz M, Wester HJ, Schwaiger M, Senekowitsch-Schmidtke R. Investigation of transport mechanism and uptake kinetics of O-(2-[18F]fluoroethyl)-L-tyrosine in vitro and in vivo. J Nucl Med. 1999;40(8):1367–1373. [PubMed] [Google Scholar]
- 12.Langen KJ, Hamacher K, Weckesser M, et al. O-(2-[18F]fluoroethyl)-L-tyrosine: uptake mechanisms and clinical applications. Nucl Med Biol. 2006;33(3):287–294. doi: 10.1016/j.nucmedbio.2006.01.002. [DOI] [PubMed] [Google Scholar]
- 13.Combs SE, Kieser M, Rieken S, et al. Randomized phase II study evaluating a carbon ion boost applied after combined radiochemotherapy with temozolomide versus a proton boost after radiochemotherapy with temozolomide in patients with primary glioblastoma: the CLEOPATRA trial. BMC Cancer. 2010;10:478. doi: 10.1186/1471-2407-10-478. [DOI] [PMC free article] [PubMed] [Google Scholar]
- 14.Combs SE, Burkholder I, Edler L, et al. Randomised phase I/II study to evaluate carbon ion radiotherapy versus fractionated stereotactic radiotherapy in patients with recurrent or progressive gliomas: the CINDERELLA trial. BMC Cancer. 2010;10:533. doi: 10.1186/1471-2407-10-533. [DOI] [PMC free article] [PubMed] [Google Scholar]
- 15.Hoffman JM, Melega WP, Hawk TC, et al. The effects of carbidopa administration on 6-[18F]fluoro-L-dopa kinetics in positron emission tomography. J Nucl Med. 1992;33(8):1472–1477. [PubMed] [Google Scholar]
- 16.Endres CJ, DeJesus OT, Uno H, Doudet DJ, Nickles JR, Holden JE. Time profile of cerebral [18F]6-fluoro-L-DOPA metabolites in nonhuman primate: implications for the kinetics of therapeutic L-DOPA. Front Biosci. 2004;9:505–512. doi: 10.2741/1224. [DOI] [PubMed] [Google Scholar]
- 17.Fueger BJ, Czernin J, Cloughesy T, et al. Correlation of 6–18F-fluoro-L-dopa PET uptake with proliferation and tumor grade in newly diagnosed and recurrent gliomas. J Nucl Med. 2010;51(10):1532–1538. doi: 10.2967/jnumed.110.078592. [DOI] [PubMed] [Google Scholar]
- 18.Schiepers C, Chen W, Cloughesy T, Dahlbom M, Huang SC. 18F-FDOPA kinetics in brain tumors. J Nucl Med. 2007;48(10):1651–1661. doi: 10.2967/jnumed.106.039321. [DOI] [PubMed] [Google Scholar]
- 19.Becherer A, Karanikas G, Szabó M, et al. Brain tumour imaging with PET: a comparison between [18F]fluorodopa and [11C]methionine. Eur J Nucl Med Mol Imaging. 2003;30(11):1561–1567. doi: 10.1007/s00259-003-1259-1. [DOI] [PubMed] [Google Scholar]
- 20.Chen W, Silverman DH, Delaloye S, et al. 18F-FDOPA PET imaging of brain tumors: comparison study with 18F-FDG PET and evaluation of diagnostic accuracy. J Nucl Med. 2006;47(6):904–911. [PubMed] [Google Scholar]
- 21.Pöpperl G, Kreth FW, Mehrkens JH, et al. FET PET for the evaluation of untreated gliomas: correlation of FET uptake and uptake kinetics with tumour grading. Eur J Nucl Med Mol Imaging. 2007;34(12):1933–1942. doi: 10.1007/s00259-007-0534-y. [DOI] [PubMed] [Google Scholar]
- 22.Pöpperl G, Kreth FW, Herms J, et al. Analysis of 18F-FET PET for grading of recurrent gliomas: is evaluation of uptake kinetics superior to standard methods? J Nucl Med. 2006;47(3):393–403. [PubMed] [Google Scholar]
- 23.Lahoutte T, Caveliers V, Camargo SM, et al. SPECT and PET amino acid tracer influx via system L (h4F2hc-hLAT1) and its transstimulation. J Nucl Med. 2004;45(9):1591–1596. [PubMed] [Google Scholar]
- 24.Youland RS, Kitange GJ, Peterson TE, et al. The role of LAT1 in (18)F-DOPA uptake in malignant gliomas. J Neurooncol. 2013;111(1):11–18. doi: 10.1007/s11060-012-0986-1. [DOI] [PMC free article] [PubMed] [Google Scholar]
- 25.Kido Y, Tamai I, Uchino H, Suzuki F, Sai Y, Tsuji A. Molecular and functional identification of large neutral amino acid transporters LAT1 and LAT2 and their pharmacological relevance at the blood-brain barrier. J Pharm Pharmacol. 2001;53(4):497–503. doi: 10.1211/0022357011775794. [DOI] [PubMed] [Google Scholar]
- 26.del Amo EM, Urtti A, Yliperttula M. Pharmacokinetic role of L-type amino acid transporters LAT1 and LAT2. Eur J Pharm Sci. 2008;35(3):161–174. doi: 10.1016/j.ejps.2008.06.015. [DOI] [PubMed] [Google Scholar]
- 27.Shikano N, Kanai Y, Kawai K, et al. Isoform selectivity of 3–125I-iodo-alpha-methyl-L-tyrosine membrane transport in human L-type amino acid transporters. J Nucl Med. 2003;44(2):244–246. [PubMed] [Google Scholar]
- 28.Weber WA, Wester HJ, Grosu AL, et al. O-(2-[18F]fluoroethyl)-L-tyrosine and L-[methyl-11C]methionine uptake in brain tumours: initial results of a comparative study. Eur J Nucl Med. 2000;27(5):542–549. doi: 10.1007/s002590050541. [DOI] [PubMed] [Google Scholar]
- 29.Rau FC, Weber WA, Wester HJ, et al. O-(2-[(18)F]fluoroethyl)-L-tyrosine (FET): a tracer for differentiation of tumour from inflammation in murine lymph nodes. Eur J Nucl Med Mol Imaging. 2002;29(8):1039–1046. doi: 10.1007/s00259-002-0821-6. [DOI] [PubMed] [Google Scholar]
Associated Data
This section collects any data citations, data availability statements, or supplementary materials included in this article.


