Abstract
Objective
Six million stillbirths (SB) and early neonatal deaths (END) occur annually worldwide, mostly in rural settings distant from health facilities. We used verbal autopsy (VA), to understand causes of non-hospital, community-based SB and END from four low-income countries.
Study Design
This prospective observational study utilized the train-the-trainer method. VA interviewers conducted standardized interviews; in each country data were reviewed by two local physicians who assigned an underlying causes of deaths (COD).
Result
There were 252 perinatal deaths (118 END; 134 SB) studied from pooled data. Almost half (45%) the END occurred on postnatal day 1, 19%on the second day and 16% the third day. Major early neonatal COD were infections (49%), birth asphyxia (26%), prematurity (17%) and congenital malformations (3%). Major causes of SB were infection (37%), prolonged labor (11%), antepartum hemorrhage (10%), preterm delivery (7%), cord complications (6%) and accidents (5%).
Conclusion
Many of these SB and END were from easily preventable causes. Over 80% of END occurred during the first 3 days of postnatal life, and >90% were due to infection, birth asphyxia and prematurity. The causes of SB were more varied, and maternal infections were the most common cause. Increased attention should be targeting at interventions that reduce maternal and neonatal infections and prevent END, particularly during the first 3 days of life.
Each year, there are more than 3 million stillbirths (SB) and 4 million early neonatal deaths (END) (newborn deaths within the first 7 days of life), worldwide1–3. These END and SBs, termed perinatal deaths, cause the highest proportion of deaths among children 0–14 years old and in this age group result in twice as many deaths as due to malaria and HIV/AIDS combined4, 5. Over 98% of these perinatal deaths occur in low and middle-income countries (LMIC), with more than 70% occurring in community settings, often the home, far from vital registration/formal health systems6–8.
Vital registration data that include cause of death (COD) are unavailable for over 97% of perinatal deaths9. Additionally, in many parts of the world, babies are not named for the first few weeks of life, and if they die, strong cultural barriers exist to discussing their death10. In many LMIC countries, existing data on perinatal COD are often derived from hospital-based deaths, extrapolated from non-perinatal studies, or use reported data from small sample sizes with modeling techniques7, 11.
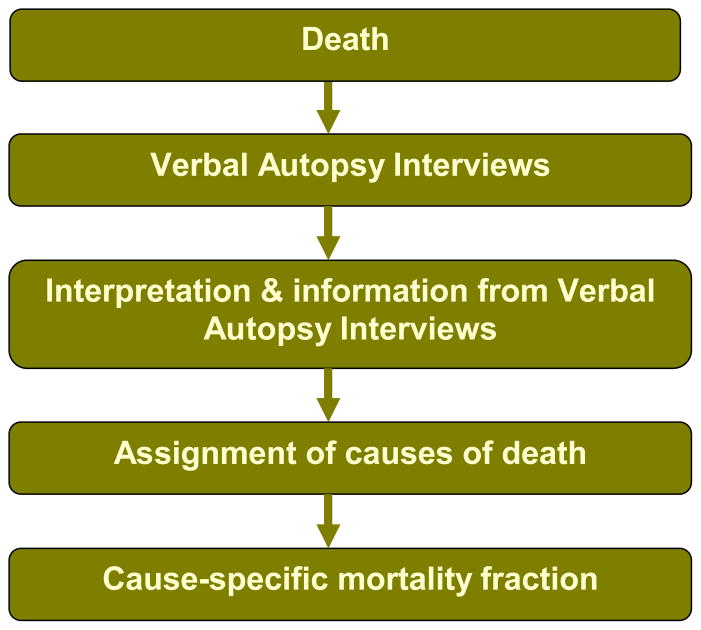
To reduce perinatal mortality, a coherent perinatal health policy needs to be developed that recognizes the most common causes of perinatal deaths. One of the techniques that has been developed to address the lack of mortality data from deaths that occur in community settings is Verbal Autopsy (VA). VA is an indirect method of ascertaining biomedical COD where civil registration and health systems are weak. During perinatal VA, an interview with the primary caregiver (usually the mother of the deceased child) is conducted with open and close-ended questions from a VA questionnaire which elicit a systematic description of the signs, symptoms and circumstances preceding death12, 13. The most common determination of COD is by physician panels. These are physicians “at their desks” who independently review VA data and assign COD. Any discrepancies are resolved by a third physician or physician consensus (Figure 1). Other less commonly utilized methods for determining COD are through the use of algorithms or neural networks14. VA is a widely- used, rigorously validated technique to gather data on cause-specific mortality fractions of certain populations, investigating infectious diseases, outbreaks and risk factors for certain diseases, and in measuring the effect of public health interventions. Currently over 35 Demographic and Health Surveillance Systems (DHSS) sites in 18 countries, the Sample Registration System in India, and the Disease Surveillance Points system in China regularly use VA on a large scale primarily to assess COD structure of defined populations14–16.
Figure 1.
The Verbal Autopsy Process
Because of the lack of population-based perinatal data available from many countries, the National Institutes of Child Health and Human Development Global Network for Women and Children’s Health (GN) undertook a prospective study of the causes of perinatal death using VA. The objective of our study was to describe community-based, non-hospital causes of SBs and ENDs in 4 GN countries, using VA.
Methods
Setting, Subjects and Study Design
This prospective observational study was nested within an ongoing, cluster randomized control trial, the FIRST BREATH Trial, conducted by the GN. The GN is a multi-country research network funded by the National Institutes of Health, representing partnerships of US and international investigators committed to improving the health of mothers and infants, building local capacity for performing research, and strengthening scientific and community partnerships. There are 10 GN research sites in sub-Saharan Africa, Southeast Asia and South America, partnered with collaborating centers in the US. The FIRST BREATH trial investigated the effects of implementing a neonatal care package training program and a neonatal resuscitation training program in community settings. As part of this study, birth attendants were trained to collect basic maternal, fetal and neonatal outcomes data which included demographics, mode of delivery, birthweight, gestational age, need for resuscitation, and adverse events. They received knowledge and skills training in newborn care using the World Health Organization (WHO) Essential Newborn Care (ENC) program and a simplified version of the American Academy of Pediatrics Neonatal Resuscitation Program. All birth attendants were trained to check for fetal and neonatal vital signs on every baby by auscultating the abdomen of every pregnant woman before delivery, and after delivery by feeling the umbilical cord of the neonate for a pulse, auscultating lungs for breath sounds, and assessing for any movement. Gestational age was determined using the mothers last menstrual period. Birth weights were taken within 48 hours of delivery using UNICEF spring Salter Scales (UNICEF model 145555) provided for the study.
This VA study involved sites in Guatemala, the Democratic Republic of Congo, Zambia and Pakistan and was conducted between May 2007 and June 2008. Within the four countries, 38 communities, each defined as a distinct geographic region whose birth attendants did not overlap with other communities, participated in this study. Each community was comprised of a number of villages with a total of approximately 300 deliveries per year. Pregnant women in these communities were enrolled at the first antenatal visit with a skilled provider or home visit by a traditional birth attendant, which generally was by 24 weeks gestation, and trained nurses or health workers appointed as Community Coordinators (CC) oversaw the data collection of all birth attendants in the community. Delivery locations included health centers, home (including the Traditional Birth Attendants (TBAs) home) or other (in transit). After each delivery, the CC collected the data from the birth attendant. To adequately conduct the VA interview, CC were trained how to interview the mother and TBA and to administer the VA questionnaire. To assign COD, physicians were trained in ICD-10 classification, rules and guidelines for assigning COD, as well as VA methodology.
At the time of a neonatal death or SB, birth attendants notified CC’s who then visited the family and TBA within 7 days of the death, screened participants for the study, determined eligibility and requested consent from eligible mothers. Provider-level eligibility criteria included CC’s willing to be trained in VA interview techniques, and physicians willing to be trained in VA and ICD-10 methodology, and guidelines for COD determination. Participant-level eligibility included mothers of a SB or END which occurred in a participating FIRST BREATH study community. Perinatal deaths that occurred in a hospital or in cases where the mother also died were ineligible for the study. Informed consent was obtained from mothers and TBAs in a private and confidential setting. The consent form was read aloud to all mothers and TBAs who then provided their signatures or thumbprints (if they were illiterate). The VA questionnaire was then administered by the CC who then sent these data separately to two local physicians who independently assigned an underlying COD.
Assigning cause of death
Each physician independently assigned one underlying COD on the basis of information extracted from the data-collection forms completed during the FIRST BREATH and verbal autopsy studies. They did this in a non-hierarchical manner and commensurate with their knowledge of prevailing local diseases and health conditions/patterns. Where there was a discrepancy between diagnoses, the two physicians met face to face, discussed the case and determined a consensus underlying COD, if possible.
Underlying COD was defined as the single most important disease or condition which initiated the train of morbid events leading directly to fetal or neonatal death, or the circumstances of the accident or violence which produced the fatal injury. Contributing COD was defined as all other causes of death, after the underlying COD is documented. The Final COD was defined as the final event that occurred causing the baby to die.
Data collection and analysis
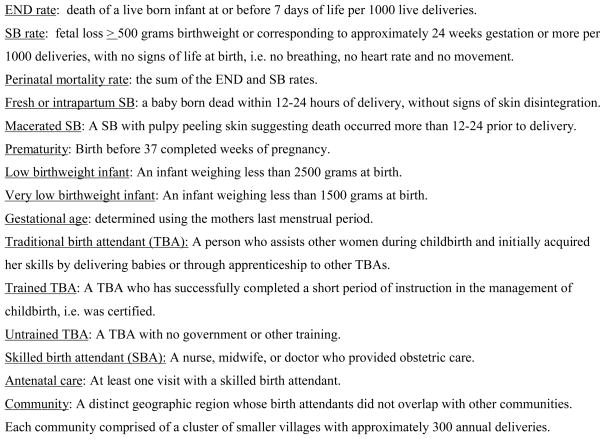
Data were collected between May 2007 and June 2008. The research teams reviewed data collection instruments for accuracy and consistency, and made every attempt to reconcile inconsistent or incomplete data. After editing, data were entered into a Microsoft Access database in-country. From there, data were transmitted to the data coordinating center (RTI International, Research Triangle Park, NC, USA) where data edits, including inter- and intra-form consistency checks were performed. The study was reviewed and approved by the institutional ethics review committees of the NICHD, RTI and in-country- IRB’s. Operational definitions used for the study are outlined in Figure 2.
Figure 2.
Operational definitions
Data were analyzed using SAS (SAS/STAT® Software version 9.0. [cited; Available from: http://www.sas.com]). Descriptive statistics were generated for participant demographics and circumstances surrounding the deaths. Relationships between categorical variables were evaluated by examining cross-tabulations. Relationships between continuous variables were evaluated by examining means, standard deviations, medians and ranges.
Results
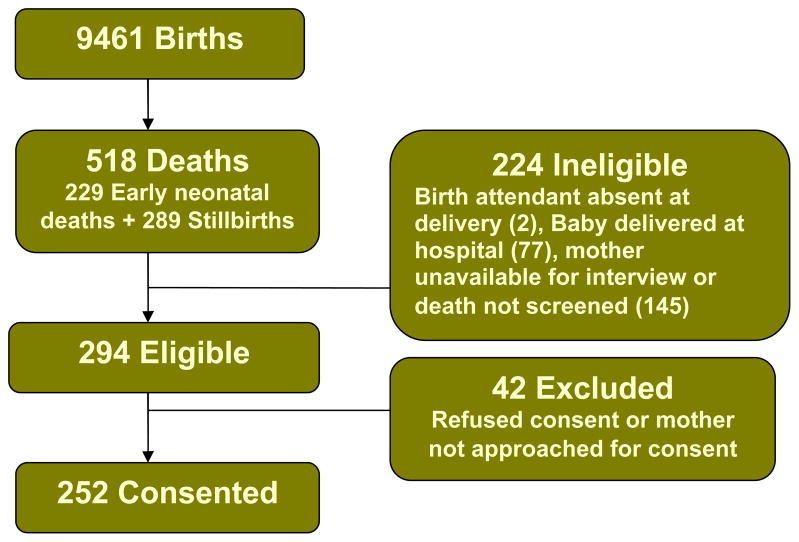
Figure 3 shows the flowchart of recruitment. There were a total of 9461 babies born during the VA study period in 38 participating communities. Among these, there were 518 deaths. The END rate was 25/1000 live births and the SB rate was 30/1000 deliveries. The perinatal mortality rate was 55/1000 deliveries. Of the 518 deaths, 224 were ineligible for the study because the birth attendant was absent at delivery (2), the baby was delivered at the hospital (77), or the mother was unavailable for the interview or the death was not screened within 7 days of the death (145). A total of 294 deaths met eligibility criteria. Of these, 42 were subsequently excluded because their mothers refused consent or were not approached for consent. Consent was obtained from 244 mothers for 252 deaths. There were 118 eligible ENDs and 134 eligible SBs during the study period.
Figure 3.
Flowchart of recruitment
Table 1 describes maternal socio-demographic characteristics of women enrolled. Nearly 75% of perinatal deaths occurred to mothers aged 20–35 years, with similar percentages occurring in mothers below the age of 20 years and above the age of 35. Most mothers had 3 prior pregnancies and were either illiterate (54%) or had primary education (36%). Almost all the mothers were married or lived with a male partner (94%). Over 90% of the END’s were vaginal vertex deliveries as were over 80% of the SBs. None of the mothers had caesarean sections. About 6% of mothers had multiple deliveries and in half the cases at least one baby died.
Table 1.
Maternal socio-demographic characteristics by outcome
| Characteristic – n (%) | Outcome | Total | |
|---|---|---|---|
| Early Neonatal Death | Stillbirth | ||
| MOTHERS (n) | 114 | 130 | 244 |
|
| |||
| Maternal age (yrs) | 110 | 125 | 235 |
| <20 | 18 (16.4) | 17 (13.6) | 35 (14.9) |
|
| |||
| 20–35 | 81 (73.6) | 94 (75.2) | 175 (74.5) |
|
| |||
| >35 | 11 (10.0) | 14 (11.2) | 25 (10.6) |
|
| |||
| Parity (excluding index pregnancy) (mean(SD)) | 2.6 (2.9) | 3.1 (2.9) | 2.9 (2.9) |
|
| |||
| Formal schooling completed | 111 | 129 | 240 |
| None, illiterate | 59 (53.2) | 70 (54.3) | 129 (53.8) |
|
| |||
| None, literate/primary | 40 (36.0) | 47 (36.4) | 87 (36.3) |
|
| |||
| Some secondary/university | 12 (10.8) | 12 (9.3) | 24 (10.0) |
|
| |||
| Mother has partner or spouse | 103 (92.0) | 124 (96.1) | 227 (94.2) |
|
| |||
| Antenatal care for index pregnancy | 97 (87.4) | 100 (76.9) | 197 (81.7) |
| Mode of delivery | 114 | 130 | 244 |
| Vaginal vertex | 106 (93.0) | 109 (83.8) | 215 (88.1) |
|
| |||
| Vaginal breech | 8 (7.0) | 21 (16.2) | 29 (11.9) |
|
| |||
| Woman had twins/triplets | 8 (7.0) | 8 (6.2) | 16 (6.6) |
|
| |||
| Deaths among twins/triplets | |||
| All babies died | 3 (37.5) | 4 (50.0) | 7 (43.8) |
|
| |||
| One baby died | 5 (62.5) | 4 (50.0) | 9 (56.3) |
Note: Denominators for reported percentages vary. Missing responses and responses of “don’t know” are excluded from the denominators.
Table 2 describes perinatal characteristics. There were fewer perinatal deaths (45%) which occurred in low birth weight babies, than in babies over 2500 grams (55%). Approximately 60% of all perinatal deaths were male, and among multiple births, there were equal numbers of SBs and ENDs. Of twin and triplet perinatal deaths, one baby died approximately one-third of the time and all babies died two-thirds of the time.
Table 2.
Perinatal characteristics by outcome
| Characteristic – n (%) | Outcome | Total | |
|---|---|---|---|
| Early Neonatal Death | Stillbirth | ||
| BABIES | 118 | 134 | 252 |
|
| |||
| Birth weight (grams) | 104 | 101 | 205 |
|
| |||
| <1500 | 11 (10.6) | 16 (15.8) | 27 (13.2) |
|
| |||
| 1500 – 2499 | 32 (30.8) | 32 (31.7) | 64 (31.2) |
|
| |||
| ≥ 2500 | 61 (58.6) | 53 (52.5) | 114 (55.6) |
|
| |||
| Gender (Male) | 72 (61.5) | 83 (61.9) | 155 (61.8) |
|
| |||
| Gestational age – median (min – max) | 37 (26 – 44) | 36 (24 – 44) | 37 (24 – 44) |
|
| |||
| Term | 117 | 133 | 250 |
|
| |||
| Preterm | 57 (48.7) | 70 (52.6) | 127 (50.8) |
|
| |||
| Full term | 57 (48.7) | 58 (43.6) | 115 (46.0) |
|
| |||
| Post term | 3 (2.6) | 5 (3.8) | 8 (3.2) |
|
| |||
| Twins/triplets | 12 (10.2) | 12 (9.0) | 24 (9.5) |
|
| |||
| Deaths among twins/triplets | 12 | 12 | 24 |
|
| |||
| Both babies died | 7 (58.3) | 8 (66.7) | 15 (62.5) |
|
| |||
| One baby died | 5 (41.7) | 4 (33.3) | 9 (37.5) |
| Day(s) between birth & death | 112 | -- | -- |
|
| |||
| 0 (died same day as born) | 50 (44.6) | -- | -- |
|
| |||
| 1 | 21 (18.8) | -- | -- |
|
| |||
| 2 | 18 (16.1) | -- | -- |
|
| |||
| 3 | 6 (5.4) | -- | -- |
|
| |||
| 4 – 6 | 17 (15.2) | -- | -- |
|
| |||
| Timing of SB | -- | 126 | -- |
|
| |||
| Fresh | -- | 79 (62.7) | -- |
|
| |||
| Macerated | -- | 47 (37.3) | -- |
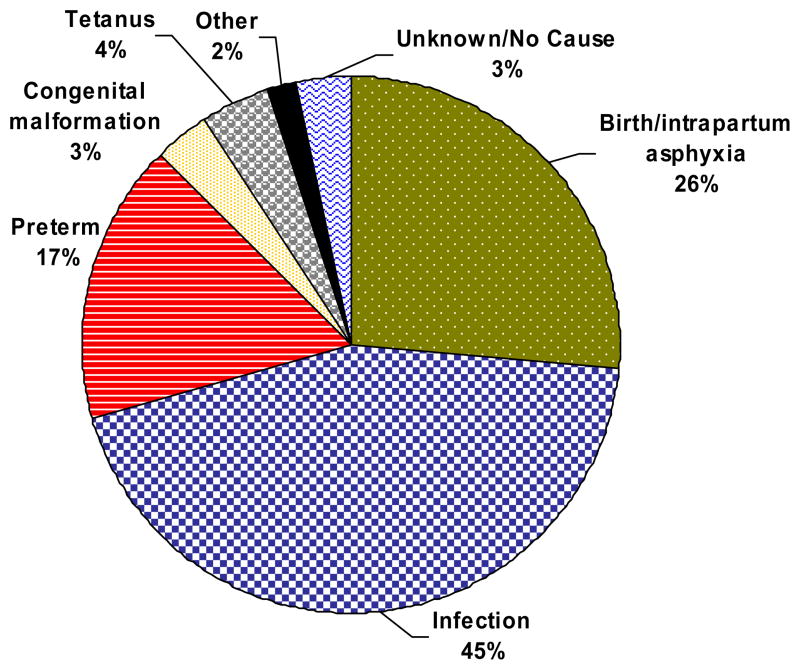
Figure 4 represents the physician consensus for underlying cause of END. Nearly half of all END’s were due to infections (including tetanus). Approximately a quarter of deaths were due to birth asphyxia and 17% to prematurity. There were 3% of deaths due to congenital malformations and 5% due to other/unknown causes.
Figure 4.
Causes of early neonatal death
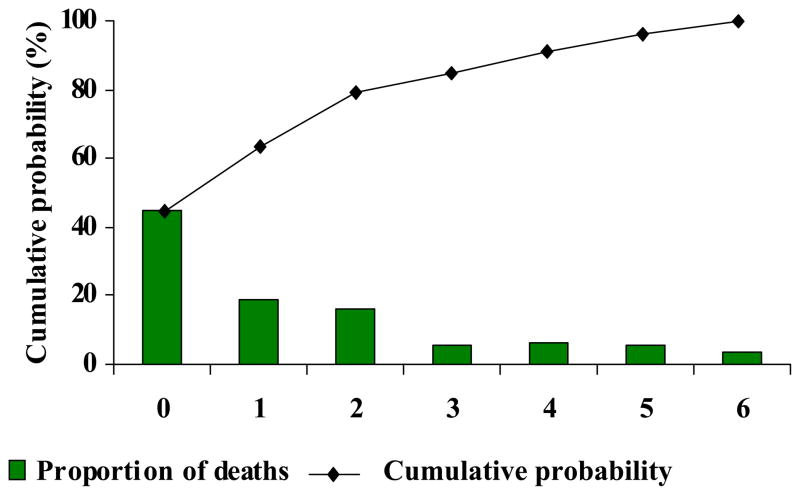
Figure 5 shows the timing and cumulative probability of END. Nearly 80% of all ENDs occurred on the first 3 days of life with approximately half (45%) on day 0 of life, 19% on day 1 and 16% on day 2. There was a sharp drop in death thereafter, concomitant with a flattening of the cumulative probability of END curve after day 2
Figure 5.
Timing and cumulative probability of early neonatal death
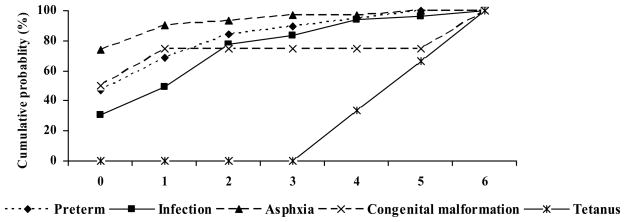
Figure 6 describes the cumulative probability of END by age and COD. Birth asphyxia was most likely to result in death on day 0 and throughout the first six days. By contrast infections were least likely to result in a death on day 0. No cases of tetanus were determined to have occurred in the first 2 days, in keeping with the definition commonly adopted by the WHO. On day 5 of life, the cumulative probability of END for the big three causes - asphyxia, infections and prematurity, was approximately the same.
Figure 6.
Underlying cause of early neonatal death determined by physician consensus by age at death
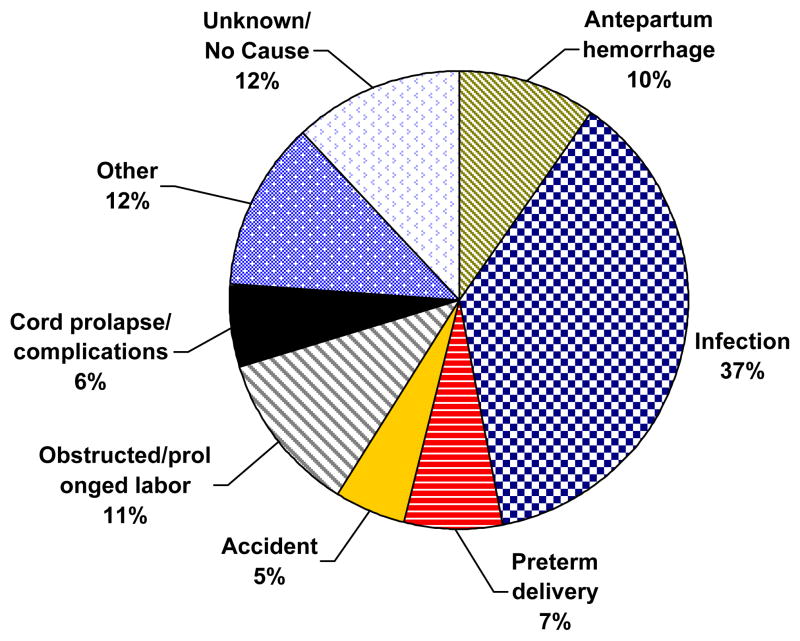
Figure 7 represents physician consensus for underlying cause of SB. Over one-third of all SBs were attributable to maternal infection, while approximately 20% were due to prolonged labor and antepartum hemorrhage. Prematurity, cord complications and accidents were equally responsible for 18% of SBs. Other causes of SB included multiple delivery, hypertension, malpresentation and 12% of cases deemed unknown.
Figure 7.
Causes of stillbirth
Discussion
The END and SB rates among the study population are consistent with other studies, including a large review of data for 190 countries estimated a SB rate of 32/1000 deliveries in South Asia and Sub-Saharan Africa. [insert ref - Stillbirth rates: delivering estimates in 190 countries. The Lancet, Volume 367, Issue 9521, Pages 1487–1494. C. Stanton, J. Lawn, H. Rahman, K. Wilczynska-Ketende, K. Hill]
The major findings from this study were that in remote, rural areas, infections caused nearly half of all cases of END, with birth asphyxia and prematurity causing 26% and 17% respectively. This study also underscores that in such regions, nearly half of all ENDs occurred on day of life 0 and by the third day 80% of deaths had occurred. In a large hospital-based study of 7993 pregnancies enrolled in the WHO calcium supplementation trial, Nhu et al reported that while prematurity caused 62% of the ENDs and birth asphyxia 22.5%, infections were only responsible for 1.4% of cases8. The authors note that the study was conducted in hospitals that had neonatal intensive care units or where referral to tertiary care was possible. A single site analysis by the Navrongo group of causes of neonatal death from rural Ghana concluded that infections were responsible for 23% of deaths, while prematurity was responsible for 38%. Of note they report no cases of birth asphyxia, highlighting the inherent difficulties of comparing across studies17. Although the data on rural causes of early neonatal death are sparse, our findings are in keeping with community-based studies from South Asia which since 1995 have reported the following ranges for neonatal COD; preterm 8–38%, sepsis 7–52% and birth asphyxia 10–28%, and tetanus 2–6%6, 18–24. Modeled estimates from the World Health Organization estimated the proportions of neonatal death to be due to infections (36%, including tetanus), preterm birth (27%) and birth asphyxia (23%). Although results from these modeled estimates suggests that infections play a predominant role in late neonatal death and not in END17, 25, our data from careful birth and death counts and VA suggest that infections in such rural areas do play a major role in causing END.
Another major finding of this study was that though maternal causes of SB were more varied, the largest category remained sepsis (37%). Prolonged labor and antepartum hemorrhage each caused 10% of SBs, while prematurity, cord complications, and accidents were responsible for 5 to 7%. The infectious etiology of SB resonates with those described by Zupan and McClure who report that infectious causes of SB range between 25 to 50%26, 27. Infection may result in fetal death through several pathways. Maternal infection may lead to systemic illness and because of maternal respiratory distress or fever, the fetus may die without the organisms transmitted to the placenta or fetus. Alternatively, the placenta may be directly infected without spread of the organisms to the fetus. In such situations, reduced blood flow may result in SB. Fetal infection may damage vital organs resulting in death or an anomaly that later kills the fetus28, 29. Each of these mechanisms is postulated to more commonly occur with SBs in developing countries26. A substantial proportion of infection-related SBs are associated with gram-negative organisms such as Klebsiella pneumoniae or Escherichea coli, although syphilis and malaria are highly prevalent and substantially increase the risks of SB26, 30, 31. Ngoc et al reported that preterm delivery and hypertensive disorders caused 29% and 26% respectively of SBs in their hospital-based study. Prolonged labor most often due to feto-pelvic disproportion from contracted pelvises due to childhood malnutrition is an important cause of SB in developing countries26. Various authors have reported basal Cesarean section (CS) rates of 5% as necessary to reduce mortality and morbidity associated with prolonged labors26. Since our study looked at births outside of a hospital setting, none of the women delivered by CS.
Our population had some of the most common risk factors for SB including lack of the following: adequate antenatal care, a skilled birth attendant at delivery, low socio-economic status and poor education26, 32. It is a challenge to determine causes of SB even in the presence of placental examinations, autopsies, cultures, karyotypes, X-rays, MRIs and other imaging, and up to 60% of SBs are unexplained26, 33. It is remarkable that in this study only 12% of SBs were unexplained.
Examining causes of death by number of days since birth can produce useful insights for health programme planning and illustrates the need for a continuum of care. For example, certain evidence-based behaviors during and immediately after birth, such as clean delivery practices, immediate breastfeeding and care seeking for complications require antenatal education for families. Our study showed that 45% of nENDs occurred on day of life 0. This is in keeping with estimates from Lawn et al from a sample of over 10,000 neonatal deaths, where 25–45% of these deaths occurred the same day the child was born1, 34. The cumulative probability of neonatal death from our study was highest for birth asphyxia, and lowest for infections on day of life 0 in keeping with observations made by Baqui et al in their single-site study in India6. Such data underscores the critical need to increase coverage of skilled birth attendants, to ensure prompt referral and access to quality emergency obstetric and neonatal services, and to equip birth attendants with the capabilities to identify and manage birth asphyxia.
In settings where most deaths occur outside of the health or vital registration system, VA is used as a “real-world, data information system” and may be virtually the only practical, available tool for ascertaining COD13, 35. Complex statistical models are not a panacea and cannot replace the sensitivity of counting births and deaths. As the shift continues from global and regional estimates of COD to national and sub-national estimates for monitoring progress towards MDG4 and providing evidence for backing national policies, increasing numbers of VA validation studies to ascertain cause of SB and neonatal death are emerging in the literature13, 15–17, 21. The findings from these studies have generally been favorable and VA has been found to reliably identify several of the most common causes of neonatal illness and death, although generalizability is limited by the differences in methods and procedures used in different settings. There continues to be progress achieved in harmonizing VA methods internationally, although continued efforts are needed to realize the full potential of this methodology in obtaining internationally comparable causes-of-death data. Most recently, a WHO expert panel produced a standardized perinatal VA questionnaire with both open-ended and closed sections with filter questions. This panel also authored a standardized cause-of-death classification list that identified globally important causes of death and related them to ICD-10 codes, for improved comparisons across locations and over time36, 37. These recommendations were not incorporated into this study as they came after the study was initiated.
The strengths of this study were that a large sample of women living in very different cultures in rural Zambia, DRC, Pakistan and Guatemala were sampled, with rigorous oversight provided by in-country staff of the GN. Additionally, previously validated VA questionnaires were all independently read and coded by experienced in-country physicians who each assigned COD, based on standardized case-definitions. Unlike many other VA studies where hierarchical outlines are provided for coders, we thought it would be instructive to provide general COD determinations as requested by ICD-10, and a framework for coders to use to determine COD. Coding physicians were also given the flexibility to determine COD, based on country norms and their familiarity with disease processes in their countries. Although sample sizes were small, the same overall trends and causes of SB and END occurred when individual site analyses were performed.
There are a number of important limitations to this study. We interviewed mothers within two weeks of a death, and it is conceivable that the mothers’ grief may have precluded accurate responses to VA. This possibility has not been borne out in other VA studies, where recall bias has been noted to sometimes occur if mothers are interviewed one year or later than the death14, 21, 38. There is also no validation component of this study per se with the use of laboratory, radiologic or microbiologic investigations; however, VA has been widely used and subjected to rigorous investigation. When held up to validation studies, the results have also been favorable. Additionally, there are limitations to the use of single diagnostic categories, as multiple rather than single causes of death probably more accurately reflects the complex interaction of different diseases/conditions that lead to death14. ICD-10 rules and regulations however, determine that a distinction is made between multiple causes of death with an underlying, contributing and final COD clearly distinguished.
Conclusions
Despite the widespread perception that improving neonatal health requires specialized neonatal intensive care units, increasing data suggests that community or home-based “packages” of care which include inexpensive interventions such as breast feeding, maternal tetanus immunization, clean cord practices, skin-to-skin (kangaroo) care and effective resuscitative practices can significantly alter neonatal mortality. Many of the causes of SB also appear potentially preventable by increased access to and provision of skilled obstetric care. An enhanced understanding of causes of perinatal death in rural remote areas is critical for programmatic and research development. Many of these causes appear potentially modifiable.
References
- 1.Lawn JE, Cousens S, Zupan J. 4 million neonatal deaths: when? Where? Why? Lancet. 2005;365:891–900. doi: 10.1016/S0140-6736(05)71048-5. [DOI] [PubMed] [Google Scholar]
- 2.Organization WH. World Health Organization Statistics 2008. 2008 [Google Scholar]
- 3.UNICEF. State of the Worlds Children. 2004 [Google Scholar]
- 4.Mathers CD, Loncar D. Projections of global mortality and burden of disease from 2002 to 2030. PLoS Med. 2006;3:e442. doi: 10.1371/journal.pmed.0030442. [DOI] [PMC free article] [PubMed] [Google Scholar]
- 5.Lopez AD, Mathers CD, Ezzati M, Jamison DT, Murray CJ. Global and regional burden of disease and risk factors, 2001: systematic analysis of population health data. Lancet. 2006;367:1747–57. doi: 10.1016/S0140-6736(06)68770-9. [DOI] [PubMed] [Google Scholar]
- 6.Baqui AH, Darmstadt GL, Williams EK, et al. Rates, timing and causes of neonatal deaths in rural India: implications for neonatal health programmes. Bull World Health Organ. 2006;84:706–13. doi: 10.2471/blt.05.026443. [DOI] [PMC free article] [PubMed] [Google Scholar]
- 7.Engmann CMR, Kinoshita R, Ditekemena J, Moore J, Goldenberg R, et al. Stillbirth and Early Neonatal Mortality in Rural Central Africa. International Journal of Gynecology and Obstetrics. 2009 doi: 10.1016/j.ijgo.2008.12.012. in press. [DOI] [PMC free article] [PubMed] [Google Scholar]
- 8.Ngoc NT, Merialdi M, Abdel-Aleem H, et al. Causes of stillbirths and early neonatal deaths: data from 7993 pregnancies in six developing countries. Bull World Health Organ. 2006;84:699–705. doi: 10.2471/blt.05.027300. [DOI] [PMC free article] [PubMed] [Google Scholar]
- 9.Jehan I, McClure EM, Salat S, et al. Stillbirths in an urban community in Pakistan. Am J Obstet Gynecol. 2007;197:257, e1–8. doi: 10.1016/j.ajog.2007.07.012. [DOI] [PMC free article] [PubMed] [Google Scholar]
- 10.Lawn JE, Yakoob MY, Haws RA, Soomro T, Darmstadt GL, Bhutta ZA. 3. 2 million stillbirths: epidemiology and overview of the evidence review. BMC Pregnancy Childbirth. 2009;9 (Suppl 1):S2. doi: 10.1186/1471-2393-9-S1-S2. [DOI] [PMC free article] [PubMed] [Google Scholar]
- 11.Lawn JE, Manandhar A, Haws RA, Darmstadt GL. Reducing one million child deaths from birth asphyxia--a survey of health systems gaps and priorities. Health Res Policy Syst. 2007;5:4. doi: 10.1186/1478-4505-5-4. [DOI] [PMC free article] [PubMed] [Google Scholar]
- 12.Fauveau V. Assessing probable causes of death without death registration or certificates: a new science? Bull World Health Organ. 2006;84:246–7. [PMC free article] [PubMed] [Google Scholar]
- 13.Garenne M, Fauveau V. Potential and limits of verbal autopsies. Bull World Health Organ. 2006;84:164. [PMC free article] [PubMed] [Google Scholar]
- 14.Soleman N, Chandramohan D, Shibuya K. Verbal autopsy: current practices and challenges. Bull World Health Organ. 2006;84:239–45. doi: 10.2471/blt.05.027003. [DOI] [PMC free article] [PubMed] [Google Scholar]
- 15.Setel PW, Whiting DR, Hemed Y, et al. Validity of verbal autopsy procedures for determining cause of death in Tanzania. Trop Med Int Health. 2006;11:681–96. doi: 10.1111/j.1365-3156.2006.01603.x. [DOI] [PubMed] [Google Scholar]
- 16.Setel PW, Rao C, Hemed Y, et al. Core verbal autopsy procedures with comparative validation results from two countries. PLoS Med. 2006;3:e268. doi: 10.1371/journal.pmed.0030268. [DOI] [PMC free article] [PubMed] [Google Scholar]
- 17.Baiden F, Hodgson A, Adjuik M, Adongo P, Ayaga B, Binka F. Trend and causes of neonatal mortality in the Kassena-Nankana district of northern Ghana, 1995–2002. Trop Med Int Health. 2006;11:532–9. doi: 10.1111/j.1365-3156.2006.01582.x. [DOI] [PubMed] [Google Scholar]
- 18.Bang AT, Paul VK, Reddy HM, Baitule SB. Why do neonates die in rural Gadchiroli, India? (Part I): primary causes of death assigned by neonatologist based on prospectively observed records. J Perinatol. 2005;25 (Suppl 1):S29–34. doi: 10.1038/sj.jp.7211269. [DOI] [PubMed] [Google Scholar]
- 19.Bang AT, Reddy HM, Bang RA, Deshmukh MD. Why do neonates die in rural Gadchiroli, India? (Part II): estimating population attributable risks and contribution of multiple morbidities for identifying a strategy to prevent deaths. J Perinatol. 2005;25 (Suppl 1):S35–43. doi: 10.1038/sj.jp.7211270. [DOI] [PubMed] [Google Scholar]
- 20.Bang AT, Bang RA. Diagnosis of causes of childhood deaths in developing countries by verbal autopsy: suggested criteria. The SEARCH Team. Bull World Health Organ. 1992;70:499–507. [PMC free article] [PubMed] [Google Scholar]
- 21.Thatte N, Kalter HD, Baqui AH, Williams EM, Darmstadt GL. Ascertaining causes of neonatal deaths using verbal autopsy: current methods and challenges. J Perinatol. 2009;29:187–94. doi: 10.1038/jp.2008.138. [DOI] [PubMed] [Google Scholar]
- 22.Patel Z, Kumar V, Singh P, et al. Feasibility of community neonatal death audits in rural Uttar Pradesh, India. J Perinatol. 2007;27:556–64. doi: 10.1038/sj.jp.7211788. [DOI] [PubMed] [Google Scholar]
- 23.Baqui AH, Sabir AA, Begum N, Arifeen SE, Mitra SN, Black RE. Causes of childhood deaths in Bangladesh: an update. Acta Paediatr. 2001;90:682–90. [PubMed] [Google Scholar]
- 24.Baqui AH, Black RE, Arifeen SE, Hill K, Mitra SN, al Sabir A. Causes of childhood deaths in Bangladesh: results of a nationwide verbal autopsy study. Bull World Health Organ. 1998;76:161–71. [PMC free article] [PubMed] [Google Scholar]
- 25.Organization WH. World Health Report - Make Every Mother and Child Count. 2005 [Google Scholar]
- 26.McClure EM, Nalubamba-Phiri M, Goldenberg RL. Stillbirth in developing countries. Int J Gynaecol Obstet. 2006;94:82–90. doi: 10.1016/j.ijgo.2006.03.023. [DOI] [PubMed] [Google Scholar]
- 27.Zupan J. Perinatal mortality in developing countries. N Engl J Med. 2005;352:2047–8. doi: 10.1056/NEJMp058032. [DOI] [PubMed] [Google Scholar]
- 28.Goldenberg RL, Thompson C. The infectious origins of stillbirth. Am J Obstet Gynecol. 2003;189:861–73. doi: 10.1067/s0002-9378(03)00470-8. [DOI] [PubMed] [Google Scholar]
- 29.Goldenberg RL, Kirby R, Culhane JF. Stillbirth: a review. J Matern Fetal Neonatal Med. 2004;16:79–94. doi: 10.1080/14767050400003801. [DOI] [PubMed] [Google Scholar]
- 30.Potter D, Goldenberg RL, Read JS, et al. Correlates of syphilis seroreactivity among pregnant women: the HIVNET 024 Trial in Malawi, Tanzania, and Zambia. Sex Transm Dis. 2006;33:604–9. doi: 10.1097/01.olq.0000216029.00424.ae. [DOI] [PMC free article] [PubMed] [Google Scholar]
- 31.McClure EM, Goldenberg RL, Bann CM. Maternal mortality, stillbirth and measures of obstetric care in developing and developed countries. Int J Gynaecol Obstet. 2007;96:139–46. doi: 10.1016/j.ijgo.2006.10.010. [DOI] [PubMed] [Google Scholar]
- 32.Chi BH, Wang L, Read JS, et al. Predictors of stillbirth in sub-saharan Africa. Obstet Gynecol. 2007;110:989–97. doi: 10.1097/01.AOG.0000281667.35113.a5. [DOI] [PubMed] [Google Scholar]
- 33.Silver RM, Varner MW, Reddy U, et al. Work-up of stillbirth: a review of the evidence. Am J Obstet Gynecol. 2007;196:433–44. doi: 10.1016/j.ajog.2006.11.041. [DOI] [PMC free article] [PubMed] [Google Scholar]
- 34.Lawn JE, Osrin D, Adler A, Cousens S. Four million neonatal deaths: counting and attribution of cause of death. Paediatr Perinat Epidemiol. 2008;22:410–6. doi: 10.1111/j.1365-3016.2008.00960.x. [DOI] [PMC free article] [PubMed] [Google Scholar]
- 35.Nykanen M, Tamaona W, Cullinan T, Van Oosterzee V, Ashorn P. Verbal autopsy as a technique to establish causes of infant and child mortality. East Afr Med J. 1995;72:731–4. [PubMed] [Google Scholar]
- 36.Baiden F, Bawah A, Biai S, et al. Setting international standards for verbal autopsy. Bull World Health Organ. 2007;85:570–1. doi: 10.2471/BLT.07.043745. [DOI] [PMC free article] [PubMed] [Google Scholar]
- 37.Autopsy. AMoV, Ascertaining and Attributing Cause of Death. A Manual on Verbal Autopsy: Ascertaining and Attributing Cause of Death. 2007 [Google Scholar]
- 38.Chandramohan D, Soleman N, Shibuya K, Porter J. Ethical issues in the application of verbal autopsies in mortality surveillance systems. Trop Med Int Health. 2005;10:1087–9. doi: 10.1111/j.1365-3156.2005.01510.x. [DOI] [PubMed] [Google Scholar]


