

Abstract
Recent work in neuroscience supports the idea that variability in brain function is necessary for optimal brain responsivity to a changing environment. In this review, we discuss a series of functional magnetic resonance imaging (fMRI) studies in younger and older adults to assess age-related differences in variability of the fMRI signal. This work shows that moment-to-moment brain variability represents an important “signal” within what is typically considered measurement-related “noise” in fMRI. This accumulation of evidence suggests that moving beyond the mean will provide a complementary window into aging-related neural processes.
Functional magnetic resonance imaging (fMRI) research has typically focused on changes in mean activity of brain regions across different experimental conditions or between different groups of individuals. This approach draws from statistical and scientific traditions, in which a primary assumption is that central tendency reflects the most representative value in a distribution, and thus, “signal” within distributional “noise.” Researchers in this field often attribute blood oxygen level-dependent (BOLD) signal variance to measurement-related confounds and attempt to remove all sources of “noise” to hone the signal related to cognitive activity. Substantial intra-subject variability in the BOLD signal within and across testing sessions is often discounted as merely reflecting issues with task, image acquisition and preprocessing, statistical power, reliability, or other nuisance effects (Huettel et al. 2004; Miller et al. 2002; Neumann et al. 2003; Aguirre et al. 1998; Smith et al. 2005; Jones et al. 2008; Kannurpatti et al. 2010a; Birn 2012). The focus on mean BOLD signal has clearly been very fruitful, and has led to a rapidly growing literature that shows no signs of slowing down (Bandettini 2012). However, no matter how brain activity is measured, it has been shown repeatedly that the brain’s natural state is inherently variable (Faisal et al. 2008; Stein et al. 2005; Garrett et al. in press-b). Several areas of neuroscience research have examined the properties and unique functionality of variance, and suggest that by considering rather than ignoring variance, our ability to understand and predict several important phenomena can improve dramatically (Faisal et al. 2008; MacDonald et al. 2006; Stein et al. 2005). We have recently attempted to take advantage of BOLD variance as a within-person measure with intrinsic theoretical and predictive meaning.
In this review we will describe three experiments that contrast the more traditional measurement of adult age differences in mean activity with assessment of within-subject variability on a voxel-by-voxel basis. We were particularly interested in examining variability of brain activity in aging, in light of a decades-old assumption that cognitive aging may be conceptualized as due to “noisy” and inefficient neural processing (Cremer and Zeef 1987; Salthouse and Lichty 1985; Welford 1981). Human and computational modeling evidence (Li et al. 2001; MacDonald et al. 2009) suggests that various neural processing inefficiencies associated with older age reflect degradations in neurotransmission (Backman et al. 2006), reduced integrity of white and grey matter (e.g., Raz et al. 2005), and functional network change (e.g., Andrews-Hanna et al. 2007; Grady et al. 2010). However, until recently, the notion of “age-related neural noise” has not been formally tested in vivo by examining within-subject brain signal variability directly. Importantly, evidence continues to mount in favor of the functional (developmental, cognitive, health) benefits of greater variability in neural systems, including flexibility/adaptability, heightened dynamic range, Bayesian optimality, and itinerancy/multi-stability (Garrett et al. in press-b). Thus, from this evidence and perspective, one may expect brain signal variability to be generally lower in older, poorer performing adults. Our work supports this hypothesis by showing that BOLD variability indeed is lower in older and poorer performing adults. Further, BOLD variability has several advantages over mean activity measures in differentiating age groups and predicting behaviour, as we describe below.
BOLD variability is lower in older adults
In all three studies, we used data obtained from an fMRI experiment (Grady et al. 2010) carried out on 19 young adults (mean age = 25.79 ± 3.28 yrs, range 22–31 years, 10 women) and 28 older adults (mean age = 66.46 ± 8.25 yrs, range 56–85 years, 14 women) screened to exclude health problems and/or medications that might affect cognitive function and brain activity, including strokes and cardiovascular disease. fMRI scanning was performed during a series of cognitive tasks (perceptual matching, attentional cueing, and delayed match-to-sample), alternating with fixation blocks. In the first experiment (Garrett et al. 2010), we examined fMRI signal variability during fixation baseline periods in these young and older adults (as a proxy for the resting state), and then compared standard deviation (SD) and mean-based spatial patterns and their relations with chronological age (for a detailed description of the calculation of SD, see Garrett et al. 2010). The data were analyzed with a multivariate approach called Partial Least Squares, or PLS (A.R. McIntosh and Lobaugh 2004; Krishnan et al. 2011), that can identify whole-brain patterns of activity that covary across experimental conditions or that are correlated with an external variable or multiple variables. This method uses singular value decomposition (similar to principal component analysis) to identify a set of latent variables (LVs) that optimally capture the correlation/covariance between two sets of measurements. Resampling via permutations and bootstrapping is used to determine the significance of each LV as a whole and the robustness of each voxel’s contribution to a particular LV, respectively. In this first study, we used separate PLS models to identify patterns of a) variability and b) mean activity that were correlated with age. Once we obtained patterns of brain activity and variability that differentiated younger from older adults, we used regression analysis to determine which brain measure was a better predictor of chronological age.
We found a very strong relation between BOLD SD during fixation and age (R2 = 0.81, p < .0001). A few brain areas showed greater variability with age, e.g., superior frontal gyrus and various subcortical regions (for convergence on the subcortical level, see Samanez-Larkin et al. 2010), but many others showed less variability with older age (e.g., lingual gyrus, middle temporal gyrus, inferior frontal gyrus, supplementary motor area; Figure 1a). Although this pattern suggests bidirectionality in voxel variability, the majority of brain voxels showed more variability in younger adults (67%). The mean-based brain measure also showed a relation with age (R2 = 0.59, p < .0001), but this association was weaker than that seen for the SD-based brain pattern. The vast majority of regions identified in the mean-brain pattern exhibited less activity with age (e.g., superior parietal lobule, inferior temporal gyrus, dorsolateral prefrontal cortex; Figure 1b). Of particular interest was the finding that the mean- and SD-based patterns appeared to be largely distinct, which suggests that the two brain measures (mean and SD) revealed very different brain effects with age.
Figure 1.
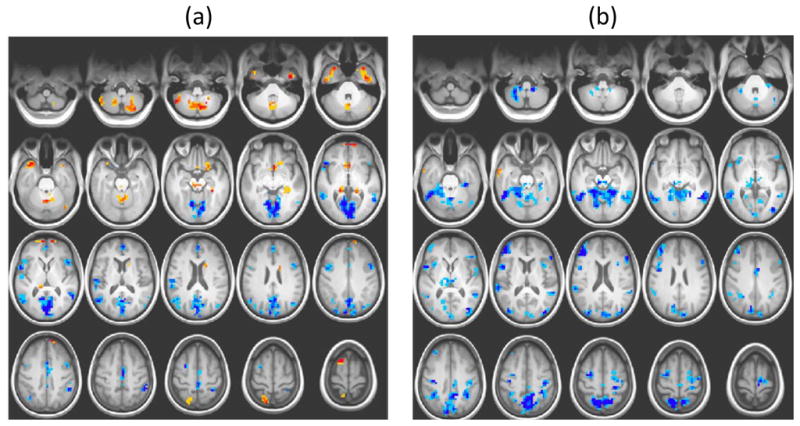
PLS brain patterns from the first study (Garrett et al. 2010). (a) Yellow/red regions indicate robust age-related increases, and blue regions indicate age-related decreases, in BOLD SDs. (b) Yellow/red regions indicate robust age-related increases, and blue regions indicate age-related decreases, in BOLD means. In both (a) and (b), darker colors indicate greater robustness (i.e., a stronger contribution to the pattern of age differences). In this and subsequent figures, the threshold for coloured regions was set to a bootstrap ratio of ± 3, i.e. where the weight for each voxel was 3 times an estimate of its standard error.
Beyond showing that the spatial patterns differ between mean and SD brain measures, demonstrating the relative ability of each measure to predict age will better characterize their unique contributions to modeling age-related brain differences. To assess these contributions, we extracted “brain scores” from the SD and mean-based analyses representing each participant’s expression of the regional brain pattern identified by each analysis (as seen in Figure 1). We then used both sets of brain scores (mean- and SD-based) to predict age using hierarchical linear regression. We found a sizable shared effect across both measures (R2 = 0.54). However, mean-based brain scores had only a very small unique contribution to age (R2change = 0.05), whereas the unique contribution of SD-based brain scores to age was more than 5 times larger (R2change = 0.27). This suggests that our SD-based analysis yielded substantial predictive utility over and above mean-based effects.
Thus, in the first study we found a robust SD-based pattern during periods of “rest”, which differed greatly, both spatially and statistically, from the mean-based pattern. Notably, the unique age-predictive power of the SD-based pattern exceeded that of the mean-based pattern, indicating that BOLD variability represents an important “signal” within what is often considered measurement-related “noise.” In our next study, we evaluated the functional consequences of greater signal variability in younger and older adults by assessing the relation between variability and performance on three cognitive tasks.
BOLD variability is associated with cognitive performance
In the second experiment (Garrett et al. 2011), we aimed to examine the influence of variability on behaviour, by assessing BOLD variability in relation to age, average reaction time (RT), and RT variability in our younger and older adults on the three cognitive tasks (perception, attention, delayed matching). It is important to note that although the older adults performed more slowly than the younger adults, there were no age differences in accuracy on the tasks because we adjusted the stimulus parameters to match accuracy between the two groups. Our multivariate approach is ideal for this kind of analysis because it allows us to measure simultaneously the correlations between brain SD and multiple external variables. Based on the preceding study, we predicted that younger adults would not only have greater BOLD variability, but that this variability would be associated with faster and more consistent responses. We found strong correlations between brain variability and the two RT measures, as well as with age (p < .0001), and these correlations were similar across the three tasks (Figure 2b). The pattern of voxels demonstrating this relation between SD-brain and age and behaviour effects was widely distributed and is shown in Figure 2a. The majority of regions (84% of all robust voxels) showed an association between greater variability and younger age, faster RT, and less variable RTs (e.g., occipital cortex, cingulate cortex, angular gyrus)1. Several small clusters (16% of all robust voxels) showed the opposite pattern, in which more variability occurred with older age, slower RT, and more variable RTs (e.g., cerebellum, right anterior prefrontal cortex).
Figure 2.

PLS results from the second study (Garrett et al. 2011). (a) Blue regions indicate greater variability with younger age, and faster and more consistent RT performance. Yellow/red regions show the opposite pattern of an association between more brain variability and older age, and slower and less consistent RT performance. Darker colors indicate greater robustness. (b) The graph shows the correlations (Pearson r) between age, mean RT, and within-subject variability of RT (ISDRT) across tasks and pattern of BOLD SD seen in (a). PMT = perceptual matching. ATT = attentional cueing. DMS = delayed match-to-sample. Error bars represent bootstrapped 95% confidence intervals. (c) The graph shows levels of brain variability in robust blue and yellow/red regions seen in (a). “Fast” and “slow” refer to greater than −1 and greater than +1 SD from the sample mean RT across tasks; “Consistent” and “inconsistent” refer to greater than −1 and greater than +1 SD from the sample average ISDRT across tasks. Younger, faster, more consistent individuals exhibited considerably more variability across brain regions than older, slower, more inconsistent adults.
We also found a mean-based pattern of activity that was related to age and behaviour, but it accounted for less covariance in the data (53% for the mean vs. 69% for SD). As for SD-brain, there were similar effects across tasks; however, the magnitudes of these correlations were somewhat lower and the confidence intervals larger. Unlike the SD pattern, the mean-based measure showed a pattern predominantly of more activity correlated with older age, slower RT, and more variable RTs (e.g., occipital cortex, middle frontal gyri, and left anterior cingulate). Again, as we had originally noted (Garrett et al., 2010), the SD and mean-based patterns showed largely different brain areas. For the few regions with both SD and mean effects, these effects were in the opposite direction. For example, medial occipital cortex showed higher variability in younger and better performing individuals, whereas increased mean activity in this region was associated with older age and worse performance on task. Finally, in a comparison of the range of SD values exhibited across regions within group, we found that younger, faster, and more consistent participants had 78% more brain variability in those regions with age decreases in SD (blue regions in Figure 2a) than they had in those areas with age increases in SD (yellow regions in Fig 2a). In contrast, older, slower, and more inconsistent participants had essentially the same magnitude of signal variability across blue and yellow regions (see Figure 2c). This suggests that older, poorer performers are also characterized by less between-region variability in within-region BOLD variability magnitude, thus highlighting another level of variability degradation in this group.
Thus, we found that younger, faster, and more consistent performers exhibited significantly higher brain variability across tasks in a distributed set of brain regions, compared to older, poorer performers. Further, variability- and mean-based brain patterns were largely non-overlapping, as we had found in the first study. Finally, the SD measure appeared to more strongly predict behaviour than the mean measure, as we had also found when predicting age with the two measures. We argue that BOLD variability indeed provides a critical within-subject index of both age and cognitive function, and in this experiment the SD measure was sensitive to age differences even when the older adults performed the tasks as accurately as the younger adults. Our results highlight that the precise nature of relations between age, cognition, and brain function is not fully appreciated by using mean-brain measures exclusively. The next question that we addressed was whether BOLD variability modulates when there is a transition between resting and carrying out a task, and whether this change would be smaller in older adults, commensurate with their reduced SDs seen in our first two studies.
Older adults modulate BOLD variability less than young adults
Recent work suggests that neural variability may be a basis for the probabilistic nature of the brain (Knill and Pouget 2004; Ma et al. 2006; Beck et al. 2008), whereby neurons may utilize a Bayesian process that generates optimal responses in the face of external stimuli of varying reliabilities. In this view, neural variability yields adaptability in the presence of stimulus uncertainty, such that brain variability would be greater when there is greater stimulus uncertainty (which might occur when stimuli become degraded or increase in frequency) relative to conditions in which there is less stimulus uncertainty (e.g., if an external stimulus is unchanging, but see He 2011). Given the importance of neural variability for state-to-state transitions (Ghosh et al. 2008; Deco et al. 2009, 2011; McIntosh et al. 2010), and that older adults exhibited less signal variability both at fixation and on task in our first two studies (Garrett et al. 2010, 2011), we expected that any variability-based transition from fixation to task may be also more subtle in older adults.
In this third study (Garrett et al. 2013), we used the same sample of younger and older adults, and examined variability changes from fixation to the three task states listed above. This analysis is analogous to the kinds of fixation vs. task contrasts that have been examined extensively in the literature. Using mean brain measures, activity differences between rest and task are among the most reliable findings, both statistically and topographically, in functional neuroimaging (e.g., Fox et al. 2005; Grady et al. 2010; McKiernan et al. 2003; Shulman et al. 1997). This contrast often reveals more activity at rest in so-called default mode regions (Raichle et al. 2001), primarily involving medial prefrontal cortex, posterior cingulate/precuneus, and lateral parietal regions, and more task-related activity in a different set of areas, including lateral inferior frontal and parietal areas, dorsolateral prefrontal cortex, and sensorimotor regions (Toro et al. 2008; Fox et al. 2005). The modulation of these rest/task patterns is known to change with older age; e.g., there is reduced modulation of the default mode during externally-driven tasks (Grady et al. 2010; Lustig et al. 2003; Persson et al. 2007; Park et al. 2010), and expansion of the task positive network (Grady et al. 2010). In the study that we describe next, we examined whether variability (the SD measure used above) would increase when participants transition from a condition of low uncertainty in which there is a single stimulus (fixation) to conditions where there are multiple stimulus presentations and higher uncertainty. A critical question was whether this increase may be of smaller magnitude in older, poorer performing adults. Our prior studies suggest that any changes might well be exhibited in different regions from those showing mean changes in activity from fixation to task.
We found that brain variability increased on task compared to fixation across a distributed set of regions, in both younger and older adults (Figure 3). However, this increase was significantly larger in younger, higher performing adults. In addition, the increase in SD was reliable for all three tasks in younger and higher performers, but only in two of the tasks in older and lower performers. Interestingly, this fixation vs. task effect was unidirectional (i.e., no regions decreased in variability when tasks were being carried out). In addition, the regions with SD increases included both default mode regions (such as ventromedial prefrontal cortex) and task related areas (including inferior frontal gyri and supplemental motor area). Heightened variability within and across experimental conditions may thus represent a more complex neural system capable of greater dynamic range within and between brain states, as well as an enhanced ability to efficiently process varying and unexpected external stimuli. If so, then the reduced modulation of BOLD variability in older and poorer performing adults when under cognitive load may indicate a brain that is less flexible and adaptive.
Figure 3.

Brain scores (a) and brain regions showing increased SD from fixation to task (b) from the third study (Garrett et al. 2013). Brain scores (a) represent the degree to which young and older adults, as a group, show increased SD in the regions seen in (b). Error bars represent bootstrapped 95% confidence intervals. Non-overlapping confidence intervals indicate that the increase in SD from fixation to tasks is larger in the younger adults. In the brain regions seen in (b), darker colours (i.e., more red) indicate regions with a more robust increase in variability on task compared to fixation. Fix = fixation. PMT = perceptual matching. ATT = attentional cueing. DMS = delayed match-to-sample.
At this point one might wonder if the differences in BOLD variability between young and older adults are driven solely by the fact that these groups differ on a number of factors in addition to age, such as behaviour. That is, would we observe condition-related changes in SD within age groups where these factors would not represent such a confound? To address this in the third study we examined the fixation vs. task contrast in the young and older adults separately. We found that indeed both groups showed an increase in variability during the tasks, relative to fixation, but the older adults showed a dampening of this effect both in terms of the fixation/task difference and the extent of the brain regions showing this response (Figure 4). This indicates that even within an age group, we can detect increased variability during tasks vs fixation, in similar regions, regardless of performance level.
Figure 4.

The data in Figure 3 were analyzed in each age group separately. Young adults (a) showed a robust increase in BOLD variability from fixation to tasks. Older adults showed a similar but more muted response (b) both in terms of magnitude of the increase and extent of brain regions showing the effect. Abbreviations and interpretation of the graphs are the same as in Figure 3.
Summary
Considering these studies together, we conclude that there are three ways that older adults can show reduced BOLD variability relative to younger adults. First, when a given region is examined during a particular experimental condition, whether it be one of very low cognitive load (such as fixation) or during a cognitive task, young, higher performing adults’ brain signals are likely to be more variable than for older, poorer performing adults (Figure 5a). When transitioning from rest or fixation to task, both younger adults and older adults will show an increase in variability to meet this task load, but again the modulation will be lower in older adults (Figure 5b). Finally, when looking across brain regions within any given experimental state, younger, higher performers will have higher between-region variability in within-region SD magnitude, relative to older, poorer performers (Figure 5c). Taking this idea further, it may be the case that older adults who show equivalent task performance to younger adults would also show greater BOLD variability than their more poorly performing peers, or might even have young adult levels of BOLD variability if they have aged particularly successfully.
Figure 5.

Three dimensions of age- and performance-related group differences in dynamic range supported by the present studies. (a) Within-region, within-condition: example that captures group differences in moment-to-moment variability in signal. (b) Within-region, across conditions: example that captures group differences in signal variability as the brain transitions from fixation to task, or from one task to another. (c) Between-region, within task: example that captures group differences in the extent of region differentiation in SD level.
Another aspect of brain variability that is apparent from these studies is that variability levels within a given cognitive condition and modulation of these levels when transitioning between different levels of cognitive demand are both predictive of task performance. This suggests that both state and trait levels of variability might provide useful indicators of cognitive ability. For example, variability differences between groups (trait) can be found in those with behavioural differences, as we see in young vs. old adults. It may also be the case, although no data yet exist, that those individuals who maintain higher levels of trait variability across different levels of cognitive demand may have better cognitive function as a rule. As well, variability during a given cognitive condition (state) can be correlated with performance on the task within a group of individuals. Other studies exploring brain variability measures in children and patient groups support this idea that variability is a powerful tool for understanding the mechanisms of behaviour. For example, variability in the EEG and MEG signals increases during development and this increased variability is associated with improvements in behaviour (Misic et al. 2010; A.R. McIntosh et al. 2008). Similarly, variability is lower in patients with traumatic brain injury (Raja Beharelle et al. 2012), and variability measures reliably predict task performance in these patients and in those with epilepsy (Protzner et al. 2013), just as they do in healthy children, young adults and older adults. Thus, brain variability has been shown to be a useful way to understand both normal and abnormal brain function, particularly in its senstivity to individual differences in cognition.
Future Directions
The studies described in this review provide strong evidence that examination of BOLD signal variability may reveal a host of novel effects that hold great potential for our understanding of the aging brain. Nevertheless, these studies have barely scratched the surface of work that could be done in this area, and there are many questions that remain to be answered. Some key future directions are as follows:
Most of what we know from cognitive neuroscience is based on mean brain measures, and so far these mean-based patterns appear to be quite different from SD patterns. This suggests that regions with mean changes in activity and those with variability changes during a given cognitive task are performing different roles to support performance on that task. Two possibilities come to mind, and surely there are many others. Given that most if not all cognitive tasks involve multiple cognitive processes (e.g., attention, working memory, sensory integration) one possibility is that regions with changes in mean activity support one set of processes and those showing variability changes support another. A second possibility is that regions with more variable activity provide some sort of support that enables the function of the regions showing mean changes in activity (or vice versa). In order to understand how cognitive processes might be represented in terms of signal variability, cognitive neuroscientists will need to examine BOLD SD in a number of different experimental conditions, and in relation to a number of key structural and functional brain-related variables of interest.
Variability patterns in young and old adults need to be examined in tasks that are more internally-driven (such as autobiographical memory retrieval) to see if the patterns of task- and age-related differences are similar to those we have identified so far with more externally-driven tasks. Because a single set of participants was used for the studies reviewed here, we do not know whether the specific regions showing age differences will generalize to other experimental conditions. However, another research group has reported age increases in variability in similar subcortical regions to those seen in Figures 1 and 2 in a decision-making task (Samanez-Larkin et al. 2010; Garrett et al. in press-b), indicating that there is some consistency of findings.
We need to explore whether age-related BOLD variability is influenced by changing task demands, such as parametrically increasing task difficulty or a systematic change in stimulus properties. Our recent work in young adults shows that signal variability is parametrically modulated with only incremental increases in task difficulty and that this modulation is related to declines in task performance (see Garrett et al. in press-a). Although we do not yet have information on whether this occurs in older adults, this result in young adults again supports the idea that BOLD variability can provide useful information on an individual-differences level even in participants who presumably have optimal brain function.
It is unknown whether age-related reductions in white matter connectivity and signal variability co-occur, although one would expect that reductions of white matter connectivity would be related to reduced modulations of integrated activity among cortical regions, and hence associated with reduced BOLD variability.
It will be critical to determine whether variability of brain activity is a fundamental property of underlying neural function, such that it can predict other aspects of brain activity. For example, the study of links between signal variability and functional connectivity between regions is inherently interesting in the context of aging-related network change. Some existing developmental work on signal variability has already moved in this direction (for studies in early development see Misic et al. 2011; Vakorin et al. 2011). However, before comprehensive work can proceed, it should be noted that many common functional connectivity metrics (e.g., Pearson r, mutual information/joint entropy) scale away variance in their calculation. Although variance normalization allows the relation between a pair of brain regions to be directly compared to another pair, it remains unclear how signal variance and functional connectivity estimation interact (e.g., when using Pearson r, does the covariance of x and y (numerator) consistently scale with standard deviations of x and y (denominator) across age groups?). This is critically important when age differences are sought, because, as we review here, age group differences in voxel variability levels are already known to exist.
Finally, there are physiological factors associated with aging, whose influence on BOLD variability is unknown. For example, there are age-related alterations in neurovascular coupling and vascular dynamics that may yield a narrower dynamic range of BOLD signal responses and decreased signal-to-noise in older adults (Andrews-Hanna et al. 2007; D’Esposito et al. 2003; Handwerker et al. 2007; Huettel et al. 2001). These confounds are not easily controlled, but some have suggested ways to account for them in BOLD data. Examples include the use of hypercapnia (i.e., the establishment of a baseline BOLD signal through breath-holding), CO2 inhalation, or using resting state activity as a baseline (Handwerker et al. 2007; Kannurpatti et al. 2010a, 2010b). However, the evidence to date for the need to control for such group differences has been inconclusive, as minimal or inconsistent age differences have been found in the brain response to breath-holding (Handwerker et al. 2007), or in vascular reactivity (Kannurpatti et al. 2010a, 2010b; Liu et al. 2013). Because of such concerns, we attempted to remove all “unwanted” sources of noise in our data by means of rigorous denoising using ICA (Garrett et al. 2010), so it is unlikely that the age differences we observed were due solely to such influences. In addition, age increases and decreases in signal variability have been found in EEG and MEG data (A. R. McIntosh et al. 2013), which do not share the same confounds as fMRI data. Nevertheless, more work needs to be done to establish the constraints that age differences in vascular function or other factors (such as neurotransmitter levels) might place on measures of BOLD variability.
In conclusion, the studies reviewed here continue to support the idea that moment-to-moment brain variability represents an important “signal” within what is typically considered measurement-related “noise” in fMRI (for other reviews, see A.R. McIntosh et al. 2010; Garrett et al. in press-b). This accumulation of evidence suggests that moving beyond the mean will provide a complementary window into both development and aging-related neural processes.
Acknowledgments
This work was supported by the Canadian Institutes of Health Research (grant #MOP14036). C.L.G. also is supported by the Canada Research Chairs program, the Ontario Research Fund, and the Canadian Foundation for Innovation.
Footnotes
A similar pattern of increased variability in these regions correlated with better performance was seen when the two age groups were analyzed separately.
References
- Aguirre GK, Zarahn E, D’Esposito M. The variability of human, BOLD hemodynamic responses. NeuroImage. 1998;8(4):360–369. doi: 10.1006/nimg.1998.0369. [DOI] [PubMed] [Google Scholar]
- Andrews-Hanna JR, Snyder AZ, Vincent JL, Lustig C, Head D, Raichle ME, et al. Disruption of large-scale brain systems in advanced aging. Neuron. 2007;56(5):924–935. doi: 10.1016/j.neuron.2007.10.038. [DOI] [PMC free article] [PubMed] [Google Scholar]
- Backman L, Nyberg L, Lindenberger U, Li SC, Farde L. The correlative triad among aging, dopamine, and cognition: current status and future prospects. Neuroscience and Biobehavioral Reviews. 2006;30(6):791–807. doi: 10.1016/j.neubiorev.2006.06.005. [DOI] [PubMed] [Google Scholar]
- Bandettini PA. Functional MRI: A confluence of fortunate circumstances. NeuroImage. 2012 doi: 10.1016/j.neuroimage.2012.01.130. [DOI] [PMC free article] [PubMed] [Google Scholar]
- Beck JM, Ma WJ, Kiani R, Hanks T, Churchland AK, Roitman J, et al. Probabilistic population codes for Bayesian decision making. Neuron. 2008;60(6):1142–1152. doi: 10.1016/j.neuron.2008.09.021. [DOI] [PMC free article] [PubMed] [Google Scholar]
- Birn RM. The role of physiological noise in resting-state functional connectivity. NeuroImage. 2012;62(2):864–870. doi: 10.1016/j.neuroimage.2012.01.016. [DOI] [PubMed] [Google Scholar]
- Cremer R, Zeef EJ. What kind of noise increases with age? Journal of Gerontology. 1987;42:515–518. doi: 10.1093/geronj/42.5.515. [DOI] [PubMed] [Google Scholar]
- D’Esposito M, Deouell LY, Gazzaley A. Alterations in the BOLD fMRI signal with ageing and disease: a challenge for neuroimaging. Nature reviews Neuroscience. 2003;4(11):863–872. doi: 10.1038/nrn1246. [DOI] [PubMed] [Google Scholar]
- Faisal AA, Selen LP, Wolpert DM. Noise in the nervous system. Nature Reviews Neuroscience. 2008;9(4):292–303. doi: 10.1038/nrn2258. [DOI] [PMC free article] [PubMed] [Google Scholar]
- Fox MD, Snyder AZ, Vincent JL, Corbetta M, Van Essen DC, Raichle ME. The human brain is intrinsically organized into dynamic, anticorrelated functional networks. Proceedings of the National Academy of Science U S A. 2005;102(27):9673–9678. doi: 10.1073/pnas.0504136102. [DOI] [PMC free article] [PubMed] [Google Scholar]
- Garrett DD, Kovacevic N, McIntosh AR, Grady CL. Blood oxygen level-dependent signal variability is more than just noise. Journal of Neuroscience. 2010;30:4914–4921. doi: 10.1523/JNEUROSCI.5166-09.2010. [DOI] [PMC free article] [PubMed] [Google Scholar]
- Garrett DD, Kovacevic N, McIntosh AR, Grady CL. The importance of being variable. Journal of Neuroscience. 2011;31:4496–4503. doi: 10.1523/JNEUROSCI.5641-10.2011. [DOI] [PMC free article] [PubMed] [Google Scholar]
- Garrett DD, Kovacevic N, McIntosh AR, Grady CL. The modulation of BOLD variability between cognitive states varies by age and processing speed. Cerebral Cortex. 2013;23(3):684–693. doi: 10.1093/cercor/bhs055. [DOI] [PMC free article] [PubMed] [Google Scholar]
- Garrett DD, McIntosh AR, Grady CL. Moment-to-moment brain signal variability is parametrically modifiable. Cerebral Cortex. doi: 10.1093/cercor/bht150. (in press-a) [DOI] [PMC free article] [PubMed] [Google Scholar]
- Garrett DD, Samanez-Larkin GR, MacDonald SWS, McIntosh AR, Grady CL. Moment-to-moment brain variability: A next frontier in human brain mapping? Neuroscience and Biobehavioral Reviews. doi: 10.1016/j.neubiorev.2013.02.015. (in press-b) [DOI] [PMC free article] [PubMed] [Google Scholar]
- Grady CL, Protzner AB, Kovacevic N, Strother SC, Afshin-Pour B, Wojtowicz M, et al. A multivariate analysis of age-related differences in default mode and task-positive networks across multiple cognitive domains. Cerebral Cortex. 2010;20(6):1432–1447. doi: 10.1093/cercor/bhp207. [DOI] [PMC free article] [PubMed] [Google Scholar]
- Handwerker DA, Gazzaley A, Inglis BA, D’Esposito M. Reducing vascular variability of fMRI data across aging populations using a breathholding task. Human Brain Mapping. 2007;28:846–859. doi: 10.1002/hbm.20307. [DOI] [PMC free article] [PubMed] [Google Scholar]
- He BJ. Scale-free properties of the functional magnetic resonance imaging signal during rest and task. Journal of Neuroscience. 2011;31(39):13786–13795. doi: 10.1523/JNEUROSCI.2111-11.2011. [DOI] [PMC free article] [PubMed] [Google Scholar]
- Huettel SA, Singerman JD, McCarthy G. The effects of aging upon the hemodynamic response measured by functional MRI. NeuroImage. 2001;13(1):161–175. doi: 10.1006/nimg.2000.0675. [DOI] [PubMed] [Google Scholar]
- Huettel SA, Song AW, McCarthy G. Functional Magnetic Resonance Imaging. Sunderland, MA: Sinauer Associates; 2004. [Google Scholar]
- Jones TB, Bandettini PA, Birn RM. Integration of motion correction and physiological noise regression in fMRI. NeuroImage. 2008;42(2):582–590. doi: 10.1016/j.neuroimage.2008.05.019. [DOI] [PMC free article] [PubMed] [Google Scholar]
- Kannurpatti SS, Motes MA, Rypma B, Biswal BB. Increasing measurement accuracy of age-related BOLD signal change: Minimizing vascular contributions by resting-state-fluctuation-of-amplitude scaling. Human Brain Mapping. 2010a;32(7):1125–1140. doi: 10.1002/hbm.21097. [DOI] [PMC free article] [PubMed] [Google Scholar]
- Kannurpatti SS, Motes MA, Rypma B, Biswal BB. Neural and vascular variability and the fMRI-BOLD response in normal aging. Magnetic resonance imaging. 2010b;28(4):466–476. doi: 10.1016/j.mri.2009.12.007. [DOI] [PMC free article] [PubMed] [Google Scholar]
- Knill DC, Pouget A. The Bayesian brain: the role of uncertainty in neural coding and computation. Trends in Neurosciences. 2004;27(12):712–719. doi: 10.1016/j.tins.2004.10.007. [DOI] [PubMed] [Google Scholar]
- Krishnan A, Williams LJ, McIntosh AR, Abdi H. Partial Least Squares (PLS) methods for neuroimaging: a tutorial and review. NeuroImage. 2011;56(2):455–475. doi: 10.1016/j.neuroimage.2010.07.034. [DOI] [PubMed] [Google Scholar]
- Li SC, Lindenberger U, Sikstrom S. Aging cognition: from neuromodulation to representation. Trends in Cognitive Sciences. 2001;5(11):479–486. doi: 10.1016/s1364-6613(00)01769-1. [DOI] [PubMed] [Google Scholar]
- Liu P, Hebrank AC, Rodrigue KM, Kennedy KM, Section J, Park DC, et al. Age-related differences in memory-encoding fMRI responses after accounting for decline in vascular reactivity. NeuroImage. 2013;78:415–425. doi: 10.1016/j.neuroimage.2013.04.053. [DOI] [PMC free article] [PubMed] [Google Scholar]
- Lustig C, Snyder AZ, Bhakta M, O’Brien KC, McAvoy M, Raichle ME, et al. Functional deactivations: change with age and dementia of the Alzheimer type. Proceedings of the National Academy of Science U S A. 2003;100(24):14504–14509. doi: 10.1073/pnas.2235925100. [DOI] [PMC free article] [PubMed] [Google Scholar]
- Ma WJ, Beck JM, Latham PE, Pouget A. Bayesian inference with probabilistic population codes. Nature Neuroscience. 2006;9(11):1432–1438. doi: 10.1038/nn1790. [DOI] [PubMed] [Google Scholar]
- MacDonald SW, Li SC, Backman L. Neural underpinnings of within-person variability in cognitive functioning. Psychology and Aging. 2009;24(4):792–808. doi: 10.1037/a0017798. [DOI] [PubMed] [Google Scholar]
- MacDonald SW, Nyberg L, Backman L. Intra-individual variability in behavior: links to brain structure, neurotransmission and neuronal activity. Trends in Neurosciences. 2006;29(8):474–480. doi: 10.1016/j.tins.2006.06.011. [DOI] [PubMed] [Google Scholar]
- McIntosh AR, Kovacevic N, Itier RJ. Increased brain signal variability accompanies lower behavioral variability in development. PLoS computational biology. 2008;4(7):e1000106. doi: 10.1371/journal.pcbi.1000106. [DOI] [PMC free article] [PubMed] [Google Scholar]
- McIntosh AR, Kovacevic N, Lippe S, Garrett DD, Grady CL, Jirsa V. The development of a noisy brain. Archives Italiennes de Biologie. 2010;148(3):323–337. [PubMed] [Google Scholar]
- McIntosh AR, Lobaugh NL. Partial least squates analysis of neuroimaging data: applications and advances. NeuroImage. 2004;23(Supplement 1):S250–S263. doi: 10.1016/j.neuroimage.2004.07.020. [DOI] [PubMed] [Google Scholar]
- McIntosh AR, Vakorin V, Kovacevic N, Wang H, Diaconescu A, Protzner AB. Spatiotemporal Dependency of Age-Related Changes in Brain Signal Variability. Cerebral Cortex. doi: 10.1093/cercor/bht030. (in press) [DOI] [PMC free article] [PubMed] [Google Scholar]
- McKiernan KA, Kaufman JN, Kucera-Thompson J, Binder JR. A parametric manipulation of factors affecting task-induced deactivation in functional neuroimaging. Journal of Cognitive Neuroscience. 2003;15(3):394–408. doi: 10.1162/089892903321593117. [DOI] [PubMed] [Google Scholar]
- Miller MB, Van Horn JD, Wolford GL, Handy TC, Valsangkar-Smyth M, Inati S, et al. Extensive individual differences in brain activations associated with episodic retrieval are reliable over time. Journal of Cognitive Neuroscience. 2002;14(8):1200–1214. doi: 10.1162/089892902760807203. [DOI] [PubMed] [Google Scholar]
- Misic B, Mills T, Taylor MJ, McIntosh AR. Brain noise is task dependent and region specific. Journal of Neurophysiology. 2010;104(5):2667–2676. doi: 10.1152/jn.00648.2010. [DOI] [PubMed] [Google Scholar]
- Misic B, Vakorin VA, Paus T, McIntosh AR. Functional embedding predicts the variability of neural activity. Frontiers in Systems Neuroscience. 2011;5:90. doi: 10.3389/fnsys.2011.00090. [DOI] [PMC free article] [PubMed] [Google Scholar]
- Neumann J, Lohmann G, Zysset S, von Cramon DY. Within-subject variability of BOLD response dynamics. NeuroImage. 2003;19(3):784–796. doi: 10.1016/s1053-8119(03)00177-0. [DOI] [PubMed] [Google Scholar]
- Park DC, Polk TA, Hebrank AC, Jenkins LJ. Age differences in default mode activity on easy and difficult spatial judgment tasks. Frontiers in Human Neuroscience. 2010;3 doi: 10.3389/neuro.3309.3075.2009. [DOI] [PMC free article] [PubMed] [Google Scholar]
- Persson J, Lustig C, Nelson JK, Reuter-Lorenz PA. Age differences in deactivation: a link to cognitive control? Journal of Cognitive Neuroscience. 2007;19(6):1021–1032. doi: 10.1162/jocn.2007.19.6.1021. [DOI] [PubMed] [Google Scholar]
- Protzner AB, Kovacevic N, Cohn M, McAndrews MP. Characterizing functional integrity: intraindividual brain signal variability predicts memory performance in patients with medial temporal lobe epilepsy. Journal of Neuroscience. 2013;33(23):9855–9865. doi: 10.1523/JNEUROSCI.3009-12.2013. [DOI] [PMC free article] [PubMed] [Google Scholar]
- Raichle ME, MacLeod AM, Snyder AZ, Powers WJ, Gusnard DA, Shulman GL. A default mode of brain function. Proceedings of the National Academy of Science U S A. 2001;98(2):676–682. doi: 10.1073/pnas.98.2.676. [DOI] [PMC free article] [PubMed] [Google Scholar]
- Raja Beharelle A, Kovacevic N, McIntosh AR, Levine B. Brain signal variability relates to stability of behavior after recovery from diffuse brain injury. NeuroImage. 2012;60(2):1528–1537. doi: 10.1016/j.neuroimage.2012.01.037. [DOI] [PMC free article] [PubMed] [Google Scholar]
- Raz N, Lindenberger U, Rodrigue KM, Kennedy KM, Head D, Williamson A, et al. Regional brain changes in aging healthy adults: general trends, individual differences and modifiers. Cerebral Cortex. 2005;15(11):1676–1689. doi: 10.1093/cercor/bhi044. [DOI] [PubMed] [Google Scholar]
- Salthouse TA, Lichty W. Tests of the neural noise hypothesis of age-related cognitive change. Journal of Gerontology. 1985;40:443–450. doi: 10.1093/geronj/40.4.443. [DOI] [PubMed] [Google Scholar]
- Samanez-Larkin GR, Kuhnen CM, Yoo DJ, Knutson B. Variability in nucleus accumbens activity mediates age-related suboptimal financial risk taking. Journal of Neuroscience. 2010;30(4):1426–1434. doi: 10.1523/JNEUROSCI.4902-09.2010. [DOI] [PMC free article] [PubMed] [Google Scholar]
- Shulman GL, Fiez J, Corbetta M, Buckner RL, Miezin F, Raichle ME, et al. Common Blood Flow Changes Across Visual Tasks: Decreases in cerebral cortex. Journal of Cognitive Neuroscience. 1997;9(5):648–663. doi: 10.1162/jocn.1997.9.5.648. [DOI] [PubMed] [Google Scholar]
- Smith SM, Beckmann CF, Ramnani N, Woolrich MW, Bannister PR, Jenkinson M, et al. Variability in fMRI: a re-examination of inter-session differences. Human Brain Mapping. 2005;24(3):248–257. doi: 10.1002/hbm.20080. [DOI] [PMC free article] [PubMed] [Google Scholar]
- Stein RB, Gossen ER, Jones KE. Neuronal variability: noise or part of the signal? Nature Reviews Neuroscience. 2005;6(5):389–397. doi: 10.1038/nrn1668. [DOI] [PubMed] [Google Scholar]
- Toro R, Fox PT, Paus T. Functional Coactivation Map of the Human Brain. Cerebral Cortex. 2008;18:2553–2559. doi: 10.1093/cercor/bhn014. [DOI] [PMC free article] [PubMed] [Google Scholar]
- Vakorin VA, Lippe S, McIntosh AR. Variability of brain signals processed locally transforms into higher connectivity with brain development. Journal of Neuroscience. 2011;31(17):6405–6413. doi: 10.1523/JNEUROSCI.3153-10.2011. [DOI] [PMC free article] [PubMed] [Google Scholar]
- Welford AT. Signal, noise, performance, and age. Human Factors. 1981;23:97–109. doi: 10.1177/001872088102300109. [DOI] [PubMed] [Google Scholar]