

Abstract
Background
An increasing number of people on antiretroviral therapy (ART) in sub-Saharan Africa has led to declines in HIV related morbidity and mortality. However, virologic failure (VF) and acquired drug resistance (ADR) may negatively affect these gains. This study describes the prevalence and correlates of HIV-1 VF and ADR among first-line ART experienced adults at a rural HIV clinic in Coastal Kenya.
Methods
HIV-infected adults on first-line ART for ≥6 months were cross-sectionally recruited between November 2008 and March 2011. The primary outcome was VF, defined as a one-off plasma viral load of ≥400 copies/ml. The secondary outcome was ADR, defined as the presence of resistance associated mutations. Logistic regression and Fishers exact test were used to describe correlates of VF and ADR respectively.
Results
Of the 232 eligible participants on ART over a median duration of 13.9 months, 57 (24.6% [95% CI: 19.2 – 30.6]) had VF. Fifty-five viraemic samples were successfully amplified and sequenced. Of these, 29 (52.7% [95% CI: 38.8 – 66.3]) had at least one ADR, with 25 samples having dual-class resistance mutations. The most prevalent ADR mutations were the M184V (n = 24), K103N/S (n = 14) and Y181C/Y/I/V (n = 8). Twenty-six of the 55 successfully amplified viraemic samples (47.3%) did not have any detectable resistance mutation. Younger age (15–34 vs. ≥35 years: adjusted odd ratios [95% CI], p-value: 0.3 [0.1–0.6], p = 0.002) and unsatisfactory adherence (<95% vs. ≥95%: 3.0 [1.5–6.5], p = 0.003) were strong correlates of VF. Younger age, unsatisfactory adherence and high viral load were also strong correlates of ADR.
Conclusions
High levels of VF and ADR were observed in younger patients and those with unsatisfactory adherence. Youth-friendly ART initiatives and strengthened adherence support should be prioritized in this Coastal Kenyan setting. To prevent unnecessary/premature switches, targeted HIV drug resistance testing for patients with confirmed VF should be considered.
Keywords: HIV, Virologic failure, Acquired drug resistance, Correlates, Rural, Kenya
Background
By the end of 2011, approximately 34 million people were living with HIV globally, with almost all (97%) coming from low and middle income countries (LMIC) [1]. In the same year, more than 8 million HIV-infected individuals in LMIC were receiving antiretroviral therapy (ART), up from just 400,000 in 2003 [2]. In Kenya, approximately 10,000 HIV-infected individuals were on ART in 2003. By the end of 2011, more than 400,000 individuals had initiated ART in the country [3]. The increase in the number of people with access to ART has resulted in substantial declines in HIV related incidence, morbidity and mortality [4-6]. However, emerging HIV-drug resistance and subsequent treatment failure threatens to reverse these gains. This is especially important in sub-Saharan Africa (sSA) where the scale up of ART has not always been done in tandem with the relevant support for virological monitoring and HIVDR testing.
Regular virological monitoring has been shown to be useful both in resource rich and resource limited settings [7,8]. However, due to cost implications, this is not currently recommended for routine use in most developing country settings. Instead, the World Health Organization (WHO) recommend use of clinical and immunological criteria to monitor treatment failure in resource limited settings [9]. These criteria have been demonstrated to be poor indicators of treatment failure, leading to missed opportunities or unnecessary medication switches [10-14], which not only increase treatment costs, but also limit future treatment options.
A systematic review of virological efficacy and drug resistance outcomes of patients on ART programmes in sSA has reported 76% virological suppression after 12 months on ART and 67% after 24 months [15]. Similarly, a recent systematic review from resource limited settings report HIV drug resistance of 11% in patients on ART for 12–23 months, 15% at 24–36 months and 21% at >36 months [16]. The most common resistance profiles identified include the M184V mutation (associated with nucleoside reverse transcriptase inhibitors; NRTIs), followed by the K103N mutation (associated with non-nucleoside reverse transcriptase inhibitors; NNRTIs). Thymidine analogue mutations (TAMs) and the K65R mutation were less common.
Emerging drug resistance and subsequent treatment failure poses a major concern for HIV programs in resource-limited settings where treatment options are limited. This study aimed to describe the prevalence and correlates of HIV-1 virologic failure and acquired drug resistance among first-line ART-experienced adults from a rural HIV clinic in coastal Kenya.
Methods
Study site
The study was carried out at the HIV clinic in Kilifi District Hospital; a rural public health facility located in Coastal Kenya. HIV services in the clinic are provided according to the Kenyan national guidelines [17]. In brief, immunological monitoring is recommended at enrolment into care and six-monthly (or when clinically indicated) thereafter. Individuals meeting the ART eligibility criteria (WHO clinical staging III/IV regardless of CD4 T-cell count or CD4 T-cell count of <350 cells/mm3 regardless of clinical staging) undergo ART preparedness counseling and are initiated on a standard first-line regimen.
At the time of the study, the national recommended first-line therapy comprised two NRTIs (stavudine/zidovudine and lamivudine) and one NNRTI (nevirapine/efavirenz). A gradual phase-out of stavudine as a first-line agent was recommended in mid-2010. Adherence counseling was done by nurse counselors. Individuals failing first-line therapy were switched to an alternative combination of two NRTIs and a boosted protease inhibitor (bPI) as the recommended second line of choice.
At the time of the study, routine HIV-1 virologic monitoring and drug resistance testing were not recommended in the Kenyan national guidelines. Targeted viral load monitoring was introduced in 2011. A switch to the recommended second line regimen was recommended for individuals with virologic failure (persistent viral load ≥1000 copies/ml).
For this study, remnant blood from routine CD4 count samples was centrifuged to obtain plasma, which was archived at −80 degrees centigrade and used for viral load quantification and HIVDR testing.
Study design
An analytical cross-sectional study design was used. We included HIV-infected adults (≥15 years old) who had been on first-line ART for more than six months. Participants with a previous history of ART exposure for prevention of mother to child transmission (PMTCT) or for post-exposure prophylaxis (PEP), and those on second line regimens were excluded from the study.
Eligible participants were recruited in two phases. In the first cross-section, all consenting eligible participants were recruited between November 2008 and January 2009. At the same time, a prospective cohort was established in order to describe long-term outcomes of new clients enrolling for HIV care. All available plasma samples from participants recruited in the prospective cohort and meeting our eligibility criteria as at March 2011 were cross-sectionally retrieved.
Sources of data
These have been previously described elsewhere [18]. In brief, socio-demographic data including date of birth, gender, marital status, level of education, religion and sub-location of residence were routinely collected using standardized questionnaires from all individuals at enrolment into HIV care by trained fieldworkers and counselors. Actual distance to the clinic was estimated from centroid co-ordinates of sub-locations in which participants resided to the clinic using ArcInfo (ArcCatalog version 9.2, ESRI Corp).
Clinical data including anthropometry, opportunistic infections, WHO staging, ART regimen, drug substitutions, drug pick up dates and appointments were routinely collected by trained clinicians on standardized forms at every clinic encounter. Hematology and CD4 T-cell count data were also collected. A trained data entry clerk entered these data into an electronic data system.
Medicine Possession Ratio (MPR), defined as the amount of time a participant is in possession of antiretrovirals divided by the time between ARV drug pick-ups, is increasingly being used as a proxy for assessing adherence in retrospective analyses. We therefore retrospectively retrieved pharmacy drug refill data from 12 months (or from the date of ART initiation if follow up period <12 months) prior to the date of sampling for every individual participant. MPRs were calculated as proportions of the total number of days between drug pick-ups less the equivalent number of days in possession of ART divided by the time between drug pick-ups for all visits. A mean MPR for each individual was computed, subtracted from 100% and stratified to satisfactory (≥95%) and unsatisfactory (<95%) adherence according to previously published conventions [19,20].
Outcome definitions
The primary outcome was HIV-1 virologic failure (VF), defined as a one-off HIV-1 plasma RNA viral load of ≥400 copies/ml. Viral load quantification was done using an in-house assay. In brief, a multiplex real time quantitative probe-based assay with an internal control and a series of quantified HIV-1 standards was used to determine virus concentration. The assay is designed to quantify HIV-1 plasma RNA for thresholds of 100 – 10,000,000 copies/ml.
The secondary outcome was acquired drug resistance (ADR), determined by HIV-1 genotyping. Genotypic resistance testing was done for all samples with VF using an in-house assay which has been described elsewhere [21]. In brief, the assay amplifies and sequences part of the pol sub-genomic region containing the protease and part of the reverse transcriptase genes. Sequences were manually edited and assembled against a reference sequence using Sequencher software (GeneCodes, version 4.1). Sequences were submitted to the Stanford HIV drug resistance database to identify and interpret HIV-1 drug resistance mutations [22,23].
Viral subtypes were identified by ‘Subtype Classification Using Evolutionary Algorithm tool (SCUEAL)’ (http://www.datamonkey.org/dataupload.php) [24].
Sample size
A post-hoc sample size calculation was done to describe whether the data would produce results with sufficient statistical precision. This study assessed for HIV-1 VF among 232 patients on first-line antiretroviral therapy. Assuming a HIV-1 VF prevalence of 24% after a median follow-up period of 12 months on ART in our setting (based on 76% virological suppression after 12 months on ART as reported in a systematic review elsewhere [15]), the risk of 232 ART naïve adults started on first-line regimen and developing VF over a median follow up period of twelve months could be estimated with a precision of +/−6% at 95% confidence level.
Data analysis
Continuous data are presented using medians (inter-quartile ranges, IQR). Because of the relatively small sample size, and except for marital status, all the exposure variables were grouped into two categories. Continuous data were stratified into two categories, using the median as the guide to the stratification threshold. Frequencies and column percentages were used to describe categorical data.
The prevalence of HIV-1 VF was determined as a percentage of plasma samples with detectable viral load ≥400 copies/ml. The prevalence of ADR was determined as a percentage of samples with detectable resistance associated mutations (as identified by the Stanford HIV drug resistance database) over the total number of samples with VF that were successfully amplified and sequenced.
Univariable and multivariable logistic regression was used to determine correlates of VF. Correlates with a likelihood ratio test (LRT) p-value of <0.05 from the univariable analysis were carried to the multivariable models using the forward stepwise approach. Crude and adjusted odd ratios (OR), 95% confidence intervals (CI) and LRT p-values were presented. Because of the low frequency observed, the Fishers exact test was used to assess for correlates of ADR among all the participants included in the study. Frequencies, row percentages and the Fisher’s exact p-values were presented.
From a public health perspective, the Kenyan national ART guidelines recommend use of persistent viral loads of ≥1000 copies/ml as indicative of VF [25]. For comparison purposes with the study outcomes, this definition was also considered in the analyses, albeit from a one-off sampling approach.
All analyses were carried out using STATA statistical software (STATA Intercooled version 11, StataCorp, College Station, Texas, USA).
Ethical considerations
The Kenya Medical Research Institute (KEMRI) Scientific Steering Committee and the National ethics review committee provided scientific and ethics approval respectively (SSC No. 1341). All the participants provided written informed consent.
Results
Study population characteristics
Overall, 232 adults on first-line ART for a median duration of 13.9 (IQR: 10.0 – 18.3) months were recruited. The characteristics of participants recruited in the first cross-section were not substantially different from those recruited in the second cross-section (Table 1).
Table 1.
Distribution of characteristics among first-line antiretroviral experienced adults on care at a rural HIV clinic in coastal Kenya (N = 232)
|
Characteristic |
Categories |
Frequency [column %] |
||
|---|---|---|---|---|
| Cross-section 1 (n = 86) | Cross-section 2 (n = 146) | Total (n = 232) | ||
|
Gender |
Male |
16 [18.6] |
38 [26.0] |
54 [23.3] |
| Female |
70 [81.4] |
108 [74.0] |
178 [76.7] |
|
|
*Age (years) |
Median |
36.5 |
39.3 |
38.5 |
| [IQR] |
[31.4 – 44.4] |
[32.7 – 46.1] |
[32.2 – 44.8] |
|
|
Age group (years) |
15.0 – 34.9 |
33 [38.4] |
47 [32.2] |
80 [34.5] |
| ≥ 35.0 |
53 [61.6] |
99 [67.8] |
152 [65.5] |
|
|
Marital status |
Single |
10 [11.6] |
9 [6.2] |
19 [8.2] |
| Married (monogamous/polygamous) |
52 [60.5] |
80 [54.8] |
132 [56.9] |
|
| Separated/divorced/widowed |
24 [27.9] |
57 [39.0] |
81 [34.9] |
|
|
Religion |
Christian |
64 [74.4] |
88 [60.3] |
152 [65.5] |
| Muslim |
13 [15.1] |
28 [19.2] |
41 [17.7] |
|
| Others |
9 [10.5] |
30 [20.6] |
39 [16.8] |
|
|
Education status |
Primary schooling/less |
68 [79.1] |
119 [81.5] |
187 [80.6] |
| Secondary/higher |
18 [20.9] |
27 [18.5] |
45 [19.4] |
|
|
*Distance (km) |
Median |
7.8 |
7.8 |
7.8 |
| [IQR] |
[2.2 – 21.0] |
[2.2 – 13.4] |
[2.2 – 15.7] |
|
|
Group distance (km) |
< 10.0 |
50 [58.1] |
98 [67.1] |
148 [63.8] |
| ≥ 10.0 |
36 [41.9] |
48 [32.9] |
84 [36.2] |
|
|
Starting 1
st
line regimen |
Zidovudine based |
37 [43.0] |
81 [55.5] |
118 [50.9] |
| Stavudine based |
49 [57.0] |
65 [44.5] |
114 [49.1] |
|
|
*Baseline WHO staging |
I/II |
41 [47.7] |
90 [61.6] |
131 [56.5] |
| III/IV |
44 [51.2] |
56 [38.4] |
100 [43.1] |
|
| Missing |
1 [0.0] |
0 [0.0] |
1 [0.4] |
|
|
*Baseline BMI (Kg/m
2
) |
Median |
19.3 |
19.0 |
19.3 |
| (IQR) |
[17.6 – 20.7] |
[17.3 – 21.1] |
[17.4 – 21.1] |
|
|
Baseline BMI groups (Kg/m
2
) |
< 18.5 |
32 [37.2] |
63 [43.2] |
95 [41.0] |
| ≥ 18.5 |
53 [61.6] |
83 [56.9] |
136 [58.6] |
|
| Missing |
1 [1.2] |
0 [0.0] |
1 [0.4] |
|
|
*Baseline CD4 count (cells/uL) |
Median |
124 |
126 |
124 |
| (IQR) |
[61 – 197] |
[35–193] |
[40–196] |
|
|
Baseline CD4 groups (cells/uL) |
< 100 |
33 [38.4] |
63 [43.2] |
96 [41.4] |
| ≥ 100 |
51 [59.3] |
83 [56.9] |
134 [57.8] |
|
| Missing |
2 [2.3] |
0 [0.0] |
2 [0.9] |
|
|
*Duration on ART (months) |
Median |
13.3 |
15.0 |
13.9 |
| [IQR] |
[9.0 – 16.1] |
[10.8 – 20.3] |
[10.0 – 18.3] |
|
|
Group duration on ART (months) |
<12.0 |
32 [37.2] |
49 [33.6] |
81 [34.9] |
| ≥ 12.0 |
54 [62.8] |
97 [66.4] |
151 [65.1] |
|
|
Drug substitution |
No |
68 [79.1] |
100 [68.5] |
168 [72.4] |
| Yes |
18 [20.9] |
46 [31.5] |
64 [27.6] |
|
|
WHO staging |
Stage I/II |
54 [62.8] |
78 [53.4] |
132 [56.9] |
| Stage III/IV |
32 [37.2] |
68 [46.6] |
100 [43.1] |
|
|
*BMI (Kg/m
2
) |
Median |
21.2 |
21.1 |
21.1 |
| (IQR) |
[19.2 – 22.2] |
[19.4 – 24.5] |
[19.4 – 23.6] |
|
|
BMI groups (Kg/m
2
) |
< 18.5 |
12 [14.0] |
24 [16.4] |
36 [15.5] |
| ≥ 18.5 |
74 [86.1] |
122 [83.6] |
196 [84.5] |
|
|
*CD4 count (cells/uL) |
Median |
282 |
288 |
286 |
| (IQR) |
[205–419] |
[193–387] |
[199–388] |
|
|
CD4 groups (cells/uL) |
< 350.0 |
49 [57.0] |
82 [56.2] |
131 [56.5] |
| ≥ 350.1 |
29 [33.7] |
41 [28.1] |
70 [30.2] |
|
| Missing |
8 [9.3] |
23 [15.8] |
31 [13.4] |
|
|
MPR adherence |
≥ 95% (Satisfactory) |
59 [68.6] |
122 [83.6] |
181 [78.0] |
| < 95% (Unsatisfactory) |
24 [27.9] |
19 [13.0] |
43 [18.5] |
|
| Missing | 3 [3.5] | 5 [3.4] | 8 [3.5] | |
Baseline refers to indicators at ART initiation; Follow up refers to indicators at the time of sampling; *Median [IQR, Inter-quartile ranges] for continuous variables; BMI (Body Mass Index); WHO (World Health Organization); MPR (Medicine Possession Ratio); Zidovudine based (plus lamivudine/Nevirapine [n = 107] or lamivudine/efavirenz [n = 11]); stavudine based (plus lamivudine/Nevirapine [n = 111] or lamivudine/efavirenz [n = 3]).
The majority of the participants were female (n = 178 [77%]), aged more than 35 years (n = 152 [66%]), married (n = 132 [57%]), with a primary education or less (n = 187 [81%]) and living within 10 kilometers of the clinic (n = 148 [64%]) (Table 1). Half of the participants (n = 118) initiated ART on a zidovudine-based regimen (plus lamivudine/nevirapine, n = 107 [46%] or lamivudine/efavirenz, n = 11 [5%]); the other half (n = 114) started on a stavudine-based regimen (plus lamivudine/nevirapine, n = 111 [48%] or lamivudine/efavirenz, n = 3 [1%]). Over the follow up duration on ART, 64 (28%) participants had undergone at least one drug substitution and 43 (19%) had an average unsatisfactory MPR adherence.
HIV-1 virologic failure
Of the 232 samples that underwent HIV-1 RNA viral load quantification, 57 (24.6% [95% CI: 19.2 – 30.6]) demonstrated VF. In univariable analysis, MPR adherence, age group and marital status were significantly correlated with VF. In multivariable analysis, only MPR adherence and age group remained independently associated with VF (Table 2). Participants with an average unsatisfactory MPR adherence had three-fold odds of having VF, compared to those with an average satisfactory MPR adherence (aOR [95% CI], p-value: 3.0 [1.5 – 6.5], p = 0.003). Likewise, participants aged ≥35 years had 70% lower odds of having VF, compared to those aged 15 – 34 years old (0.3 [0.1 – 0.6], p < 0.001). Adjusting for age attenuated the effect of marital status on VF towards the null (Separated/divorced/widowed vs. single, 0.4 [0.1 – 1.2], p = 0.137).
Table 2.
Logistic regression analysis describing correlates of HIV-1 virologic failure (viral load ≥400 copies/ml) among first-line antiretroviral experienced adults at a rural HIV clinic in coastal Kenya (N = 232)
| |
Logistic univariable analysis |
Logistic multivariable analysis (n = 201) |
||||||
|---|---|---|---|---|---|---|---|---|
| Risk factors | Categories | Viraemia, n = 57 [%] | Crude OR | 95% C.I | *P-value | Adjusted OR | 95% C. I | *P-value |
|
Gender |
Male |
12/54 [22.2] |
1.0 |
|
|
|
|
|
| Female |
45/177 [25.3] |
1.2 |
0.6 – 2.4 |
0.645 |
- |
- |
- |
|
|
Age group (years) |
15.0 – 34.9 |
31/80 [38.8] |
1.0 |
|
|
1.0 |
|
|
| ≥ 35.0 |
26/152 [17.1] |
0.3 |
0.2 – 0.6 |
<0.001 |
0.3 |
0.2 – 0.7 |
0.002 |
|
|
Marital status |
Single |
8/19 [42.1] |
1.0 |
|
|
|
|
|
| Married (monogamous/polygamous) |
36/132 [27.3] |
0.5 |
0.2 – 1.4 |
|
|
|
|
|
| Separated/Divorced/Widowed |
13/81 [16.1] |
0.3 |
0.1 – 0.8 |
0.034 |
- |
- |
- |
|
|
Religion |
Christian |
38/152 [25.0] |
1.0 |
|
|
|
|
|
| Muslim |
7/41 [17.1] |
0.6 |
0.3 – 1.5 |
|
|
|
|
|
| Others |
12/39 [30.8] |
1.3 |
0.6 – 2.9 |
0.345 |
- |
- |
- |
|
|
Education status |
Primary schooling/Less |
46/187 [24.6] |
1.0 |
|
|
|
|
|
| Secondary/Higher |
11/45 [24.4] |
1.0 |
0.5 – 2.1 |
0.983 |
- |
- |
- |
|
|
Group distance (km) |
<10.0 |
37/148 [25.0] |
1.0 |
|
|
|
|
|
| ≥ 10.0 |
20/84 [23.8] |
0.9 |
0.5 – 1.8 |
0.839 |
- |
- |
- |
|
|
Starting 1
st
line regimen |
Zidovudine based |
33/118 [28.0] |
1.0 |
|
|
|
|
|
| Stavudine based |
24/114 [21.1] |
0.7 |
0.4 – 1.3 |
0.221 |
- |
- |
- |
|
|
Baseline
WHO staging |
I/II |
28/131 [21.4] |
1.0 |
|
|
|
|
|
| III/IV |
28/100 [28.0] |
1. 4 |
0.8 – 2.6 |
0.246 |
- |
- |
- |
|
|
Baseline
BMI groups (Kg/m
2
) |
< 18.5 |
26/95 [27.4] |
1.0 |
|
|
|
|
|
| ≥ 18.5 |
30/136 [22.1] |
0.8 |
0.4 – 1.4 |
0.356 |
- |
- |
- |
|
|
Baseline
CD4 groups (cells/uL) |
< 100 |
25/96 [26.0] |
1.0 |
|
|
|
|
|
| ≥ 100 |
30/134 [22.4] |
0.8 |
0.4 – 1.5 |
0.523 |
- |
- |
- |
|
|
Duration on ART (months) |
<12.0 |
23/81 [28.4] |
1.0 |
|
|
|
|
|
| ≥ 12.0 |
34/151 [22.5] |
0.7 |
0.4 - 1.4 |
0.325 |
- |
- |
- |
|
|
Drug substitution |
No |
40/168 [23.8] |
1.0 |
|
|
|
|
|
| Yes |
17/64 [26.6] |
1.2 |
0.6 – 2.2 |
0.665 |
- |
- |
- |
|
|
Follow up
WHO staging |
Stage I/II |
29/132 [22.0] |
1.0 |
|
|
|
|
|
| Stage III/IV |
28/100 [28.0] |
1.4 |
0.8 – 2.5 |
0.292 |
- |
- |
- |
|
|
Follow up
BMI groups (Kg/m
2
) |
< 18.5 |
10/36 [27.8] |
1.0 |
|
|
|
|
|
| ≥ 18.5 |
47/196 [24.0] |
0.8 |
0.4 – 1.8 |
0.627 |
- |
- |
- |
|
|
Follow up
CD4 groups (cells/uL) |
< 350 |
35/131 [26.7] |
1.0 |
|
|
|
|
|
| ≥ 350 |
12/70 [17.1] |
0.6 |
0.3 – 1.2 |
0.120 |
- |
- |
- |
|
|
MPR adherence |
≥ 95% (Satisfactory) |
34/181 [18.8] |
1.0 |
|
|
1.0 |
|
|
| <95% (Unsatisfactory) | 18/43 [41.9] | 3.1 | 1.5 – 6.3 | 0.002 | 3.0 | 1.5 – 6.5 | 0.003 | |
Baseline refers to indicators at ART initiation; Follow up refers to indicators at the time of sampling; *Likelihood Ratio Test p-value; BMI (Body Mass Index); WHO (World Health Organization); MPR (Medicine Possession Ratio). Missing data; Baseline WHO staging (n = 1 [0.4%]), Baseline BMI (n = 1 [0.4%]), Baseline CD4 count (n = 2 [0.9%]), CD4 count (n = 31 [13.4%]) and MPR adherence (n = 8 [3.5%]).
HIV-1 acquired drug resistance
Fifty-five of the 57 samples with VF were successfully amplified and sequenced for HIV drug resistance testing. Of the 55 samples that were successfully amplified and sequenced, 29 (52.7% [95% CI: 38.8 – 66.3]) had at least one detectable HIV-1 resistance associated mutation, giving an overall ADR prevalence of 12.5% (95% CI: 8.5 – 17.5) among all participants included in the study. While all 29 samples had mutations conferring resistance to NNRTIs, 25 (86%) of those with resistance had dual-class (both NRTIs and NNRTIs) mutations (Table 3). The most prevalent variant were the M184V mutation (n = 24), the K103N/S mutation (n = 14) and the Y181C/Y/I/V mutation (n = 8) within the reverse transcriptase genome. Thymidine analogue mutations (TAMs) were present in 4 participants. Twenty-six of the 55 successfully amplified viraemic samples (47.3%) did not have any detectable resistance associated mutations.
Table 3.
Distribution and characteristics of first-line antiretroviral experienced adults with HIV-1 acquired drug resistance mutations from a rural HIV clinic in coastal Kenya
| No. | Gender | Age (years) | Sample date | ART date | ART duration # | Viral load | Subtype* | NRTI mutations | NNRTI mutations |
|---|---|---|---|---|---|---|---|---|---|
|
1. |
Male |
30.5 |
28-Nov-08 |
28-Mar-08 |
8.0 |
697796 |
Complex |
D67DG |
K103N, G190A |
|
2. |
Female |
38.5 |
02-Dec-08 |
22-May-08 |
6.4 |
5006 |
A1 |
M184V |
K103N, K238T |
|
3. |
Male |
36.6 |
06-Jan-09 |
11-Apr-08 |
8.9 |
861730 |
A1 |
M184V |
Y188L |
|
4. |
Female |
33.4 |
17-Nov-08 |
19-May-08 |
6.0 |
64435 |
A1 |
M184V, K219EK |
V108IV, Y181CY, G190AG |
|
5. |
Female |
44.5 |
16-Dec-08 |
26-Nov-07 |
12.7 |
3087 |
A1 |
M184V |
G190A |
|
6. |
Female |
26.5 |
17-Dec-08 |
01-Nov-07 |
13.5 |
1158 |
D |
M184V |
K103N, K238T |
|
7. |
Female |
22.5 |
05-Dec-08 |
30-Oct-07 |
13.2 |
4051 |
A1 |
M184V |
K103N |
|
8. |
Female |
48.4 |
12-Nov-08 |
02-Jul-07 |
16.4 |
5274 |
A1 |
M184V |
K103N, M230LM |
|
9. |
Female |
24.4 |
12-Nov-08 |
29-Aug-07 |
14.5 |
24529 |
D |
T69NT, M184V |
K103N |
|
10. |
Female |
63.4 |
21-Nov-08 |
03-May-07 |
18.7 |
576 |
A1, AE |
|
K103N |
|
11. |
Female |
25.6 |
14-Jan-09 |
22-Oct-07 |
14.8 |
219766 |
A-ancestral, A1 |
M184V, T215Y |
Y181C |
|
12. |
Female |
31.3 |
07-Oct-10 |
22-Aug-08 |
25.5 |
315800 |
A1 |
M184V |
K103N |
|
13. |
Female |
34.0 |
22-Jun-10 |
07-Oct-09 |
8.5 |
17248 |
A1 |
M184V |
Y181C |
|
14. |
Female |
25.2 |
13-Sep-10 |
19-Aug-09 |
12.8 |
109090 |
D |
M184V |
V106A, F227L |
|
15. |
Female |
51.2 |
10-Aug-10 |
15-Jun-09 |
13.8 |
5396 |
A1 |
M184V |
K103N |
|
16. |
Female |
23.7 |
08-Mar-11 |
22-Sep-09 |
17.5 |
12408 |
A1 |
M184V |
Y181C |
|
17. |
Female |
32.1 |
06-Jul-10 |
15-Dec-08 |
18.7 |
199362 |
A1 |
M41L, D67N, K70R, M184V, T215Y, K219Q |
Y181IV |
|
18. |
Female |
31.8 |
23-Mar-11 |
27-Feb-09 |
24.8 |
834656 |
A-ancestral, A1 |
|
K101E, G190A |
|
19. |
Female |
38.7 |
16-Feb-10 |
22-May-09 |
8.9 |
34186 |
A2 |
M184V |
V106A |
|
20. |
Female |
41.8 |
20-Apr-10 |
22-Jun-09 |
9.9 |
4729 |
A1 |
M184V |
Y181C |
|
21. |
Female |
31.7 |
04-Mar-11 |
24-Mar-09 |
23.3 |
20392 |
A1 |
M184V |
V106A |
|
22. |
Female |
15.1 |
16-Mar-10 |
13-Apr-09 |
11.1 |
1046760 |
A1 |
M184V |
K103S, G190A |
|
23. |
Female |
31.3 |
29-Sep-10 |
11-Jan-10 |
8.6 |
129493 |
A1, A2 |
|
K103N |
|
24. |
Female |
41.7 |
11-Mar-11 |
18-Aug-09 |
18.7 |
1452 |
A, A1 |
M184V |
Y181C |
|
25. |
Female |
17.8 |
07-Mar-11 |
08-Dec-09 |
14.9 |
130222 |
A1 |
M184V |
K103N, Y318FY |
|
26. |
Female |
25.7 |
04-Mar-11 |
13-Apr-10 |
10.7 |
47795 |
A1 |
M184V |
K101Q, G190A |
|
27. |
Female |
21.7 |
11-Mar-11 |
01-Sep-09 |
18.3 |
2029880 |
A1 |
L74V, M184V |
K103N, Y181C |
|
28. |
Female |
48.1 |
02-Aug-10 |
08-Oct-08 |
21.8 |
72430 |
A1 |
|
G190A |
| 29. | Male | 29.5 | 14-Dec-10 | 06-Jan-10 | 11.2 | 74152 | A, A1 | K65R, M184V | K103N |
#Time (in months) since patient started taking antiretroviral therapy, *HIV-1 subtypes identified using the ‘Subtype Classification Using Evolutionary ALgorithm (SCUEAL)’ tool, available at (http://www.datamonkey.org/dataupload_scueal.php).
Viral load, MPR adherence and age group were strongly associated with ADR (Table 4). Participants with higher viral loads (≥ 4.0 log copies/ml) had a higher prevalence of ADR, compared to those with lower viral loads (< 4.0 log copies/ml), (frequency [%]: 20 [62.5] vs 9 [4.6], p < 0.001). Likewise, participants with unsatisfactory MPR adherence had a higher prevalence of ADR, compared to those with satisfactory MPR adherence (frequency [%]: 12 [27.9] vs 17 [9.5], p = 0.004). Similarly, participants aged 15– 34 had a higher prevalence of ADR compared to those aged ≥35 years (frequency [%]: 19 [23.8] vs 10 [6.7], p < 0.001).
Table 4.
Distribution and correlates of HIV-1 acquired drug resistance among first-line antiretroviral experienced adults at a rural HIV clinic in coastal Kenya (N = 230)
| |
Acquired drug resistance [row %] |
|||
|---|---|---|---|---|
| Risk factors | Categories | No (n = 201) | Yes (n = 29) | *P-value |
|
Gender |
Male |
51 [94.4] |
3 [5.6] |
|
| Female |
150 [85.2] |
26 [14.8] |
0.100 |
|
|
Age group (years) |
15.0 – 34.9 |
61 [76.3] |
19 [23.8] |
|
| ≥ 35.0 |
140 [93.3] |
10 [6.7] |
<0.001 |
|
|
Marital status |
Single |
13 [68.4] |
6 [31.6 |
|
| Married (monogamous/polygamous) |
113 [86.3] |
18 [13.7] |
|
|
| Separated/divorced/widowed |
75 [93.8] |
5 [6.3] |
0.013 |
|
|
Religion |
Christian |
132 [87.4] |
19 [12.6] |
|
| Muslim |
36 [87.8] |
5 [12.2] |
|
|
| Others |
33 [86.8] |
5 [13.2] |
1.000 |
|
|
Education status |
Primary schooling/less |
162 [87.6] |
23 [12.4] |
|
| Secondary/higher |
39 [86.7] |
6 [13.3] |
0.807 |
|
|
Group distance (km) |
<10.0 |
128 [86.5] |
20 [13.5] |
|
| ≥10.0 |
73 [89.0] |
9 [11.0] |
0.681 |
|
|
Starting 1
st
line regimen |
Zidovudine based |
102 [86.4] |
16 [13.6] |
|
| Stavudine based |
99 [88.4] |
13 [11.6] |
0.695 |
|
|
Baseline
WHO staging |
I/II |
117 [90.0] |
13 [10.0] |
|
| III/IV |
83 [83.8] |
16 [16.2] |
0.228 |
|
|
Baseline
BMI groups (Kg/m
2
) |
< 18.5 |
82 [88.2] |
11 [11.8] |
|
| ≥ 18.5 |
118 [86.8] |
18 [13.2] |
0.841 |
|
|
Baseline
CD4 groups (cells/uL) |
<100 |
82 [86.3] |
13 [13.7] |
|
| > 100 |
118 [88.7] |
15 [11.3] |
0.683 |
|
|
Duration on ART (months) |
< 12.0 |
70 [86.4] |
11 [13.6] |
|
| ≥ 12.0 |
131 [87.9] |
18 [12.1] |
0.836 |
|
|
Drug substitution |
No |
145 [87.4] |
21 [12.7] |
|
| Yes |
56 [87.5] |
8 [12.5] |
1.000 |
|
|
Follow up
WHO staging |
Stage I/II |
119 [91.5] |
11 [8.5] |
|
| Stage III/IV |
82 [82.0] |
18 [18.0] |
0.044 |
|
|
Follow up
BMI groups (Kg/m
2
) |
< 18.5 |
30 [83.3] |
6 [16.7] |
|
| ≥ 18.5 |
171 [88.1] |
23 [11.9] |
0.417 |
|
|
Follow up
CD4 groups (cells/uL) |
< 350 |
110 [84.6] |
20 [15.4] |
|
| ≥ 350 |
64 [91.4] |
6 [8.6] |
0.193 |
|
|
MPR adherence |
≥ 95% (Satisfactory) |
162 [90.5] |
17 [9.5] |
|
| < 95% (Unsatisfactory) |
31 [72.1] |
12 [27.9] |
0.004 |
|
|
Viral load (log 10, copies/ml) |
0.00 – 4.00 |
189 [95.5] |
9 [4.6] |
|
| > 4.00 | 12 [37.5] | 20 [62.5] | <0.001 | |
Baseline refers to indicators at ART initiation; Follow up refers to indicators at the time of sampling; *Fisher’s exact p-value; BMI (Body Mass Index); WHO (World Health Organization) MPR (Medicine Possession Ratio). Missing data; Baseline WHO staging (n = 1 [0.4%]), Baseline BMI (n = 1 [0.4%]), Baseline CD4 count (n = 2 [0.9%]), CD4 count (n = 31 [13.4%]) and MPR adherence (n = 8 [3.5%]).
Age was further stratified to 10-year age bands and its association with VF and ADR explored. The overall prevalence of VF and ADR was highest in participants aged 15–24 years (53.3% and 40.0% respectively) (Figure 1). Strong evidence of a decreasing trend in prevalence of VF and ADR with increasing age groups (non-parametric test for trend, p = 0.004 and p < 0.001 respectively) was also observed.
Figure 1.
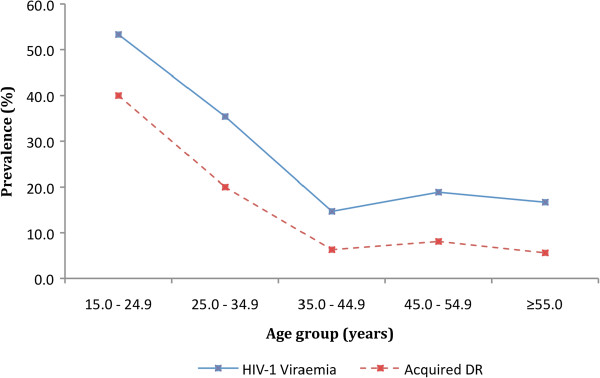
Overall prevalence and distribution of HIV-1 Viraemia (viral load ≥400 copies/ml) and acquired drug resistance by age group, among first-line antiretroviral experienced adults at a rural HIV clinic in coastal Kenya (N=232).
For comparison purposes, the above analyses were repeated using viral load threshold of ≥1000 copies/ml to define VF. Of the 232 participants, 48 (20.7% [95% CI: 15.7 – 26.5]) met this criterion of HIV-1 VF. Of these, 28 (58.3% [95% CI: 43.2 – 72.4]) had at least one detectable HIV-1 resistance mutation. Correlates of VF (Additional file 1: Table S1) and ADR (Additional file 1: Table S2) remained the same as those observed when using this study’s outcome definition of ≥400 copies/ml for VF.
Discussion
Findings from a HIV clinic in a rural district hospital in coastal Kenya suggest that one in every four adults on first-line antiretroviral regimen for an average of 14 months had VF, with half of those with VF harboring at least one HIV resistance-associated mutation. The most prevalent mutations observed confer high-level resistance to NRTIs (specifically lamivudine, in the case of the M184V mutation) and NNRTIs (specifically nevirapine and efavirenz, in the case of the K103N/S mutation and the Y181C/Y/I/V mutation). These results are consistent with findings from systematic reviews of studies on virological efficacy and drug resistance from other resource limited settings [15,26]. The non-complex resistance patterns observed could possibly indicate an advantage of the current recommended first-line regimen in this setting.
The WHO recommends use of drug-refill data as an early warning indicator (EWI) of HIV treatment failure and drug resistance [27]. Recent EWI analyses on prospective HIVDR data from 6 African countries suggest an advantage of MPR over on-time drug pick-up in identifying participants at risk for developing HIV drug resistance [28]. For this reason, MPR was used and indeed identified as a practical alternative parameter for assessing adherence, with strong correlation with both VF and ADR in this setting. Similar findings have also been reported elsewhere [19,29-31].
The current study also indicated younger age as a strong risk factor for both HIV-1 VF and ADR. In fact, half of all participants aged 15–24 years had VF, while two in every five had acquired at least one drug resistant strain. Data from a developed setting suggests that the youth face a complex myriad of challenges including peer-related stigma, disclosure, adherence, sexual, reproductive and gender health concerns [32]. If applicable, then these challenges may indirectly contribute to the high burden of virological treatment failure and ADR in our setting.
Higher viral load was strongly associated with ADR, which is consistent with literature [33]. Of interest however, is the finding that only half of participants with VF had detectable ADR. Indeed, if the Kenyan national recommendation of ≥1000 copies/ml was used to suggest VF in this study [25], and assuming sustained viral replication, then a fifth of the participants would have VF. Of these, only 58% had detectable ADR mutations. These data may therefore suggest that up to 42% of participants would have potentially been switched to the more expensive 2nd line regimen prematurely or unnecessarily, thus exhausting and limiting treatment options. This is especially risky in this setting where the only currently recommended second line option is the bPIs, with costs prohibiting the range of other potential alternative regimens.
The findings of this study should be interpreted in light of several limitations. Firstly, the cross-sectional study design and the one-off sampling strategy warrant caution in the interpretation of our findings, as follow up samples were not available to confirm VF. Consequently, blips in viral load cannot be ruled out [34]. It is acknowledged that occasionally, viral blips can occur even during effective treatment [35,36]. This may have resulted to an overestimation of the true burden of VF in this population. In addition, focusing on participants with a median ART follow up duration of more than a year potentially excludes those who may have died or were lost to follow-up within a year of ART due to treatment failure. This may have resulted in an underestimation of the true burden of VF and ADR in this population.
Secondly, it may be argued that the participants may not have achieved virological suppression in the first place, even after being on ART for more than 6 months. This may possibly be attributed to the effect of persisting HIV-1 primary or transmitted resistance mutations, which have been reported to be on the increase in some parts of sSA [37,38]. Transmitted resistant strains have been shown to contribute to VF in clients on ART [39-41]. However, our concurrent data suggest low levels (<5%) of transmitted drug resistance in this rural coastal Kenyan population [42].
Lastly, stigma, disclosure, sexual orientation, reproductive health and gender issues are potential concerns that may contribute to the burden of VF and ADR, especially among the young adults in this setting. Data on these factors were not captured and hence not considered in the analyses.
Conclusions
In conclusion, levels of HIV-1 VF and ADR observed from this rural HIV clinic in coastal Kenya were comparable to those observed in other resource-limited settings. High levels of VF and ADR were observed among younger patients and those with unsatisfactory adherence. Implementation of youth-friendly ART initiatives (e.g. social networks, support clubs) are therefore warranted in this setting. Strengthened adherence support should also be prioritized, more so in cases of suspected virologic treatment failure and before treatment switches. However, if virologic failure is confirmed, targeted HIVDR testing should be considered to prevent unnecessary/premature switches.
Competing interests
The authors declare that they have no competing interest.
Authors’ contributions
JAB and PAC conceived the study. ASH coordinated the data/sample collection, analyzed the data and prepared the draft manuscript. SM, HN and CAO assisted with the coordination of the data and sample collection. JAB, PAC, ES and TFRW provided guidance and mentorship during the implementation of the study. All authors reviewed and approved the final manuscript.
Supplementary Material
Logistic regression analysis describing correlates of HIV-1 virologic failure (viral load ≥1000 copies/ml) among first line antiretroviral experienced adults at a rural HIV clinic in coastal Kenya (N=232). Table S2. Distribution and correlates of HIV-1 acquired drug resistance (if genotyping was only done for samples with viral load ≥1000 copies/ml) among first-line antiretroviral experienced adults at a rural HIV clinic in coastal Kenya (N=230).
Contributor Information
Amin S Hassan, Email: ahassan@kemri-wellcome.org.
Helen M Nabwera, Email: hnabwera@kemri-wellcome.org.
Shalton M Mwaringa, Email: smwaringa@kemri-wellcome.org.
Clare A Obonyo, Email: aceobonyo@yahoo.com.
Eduard J Sanders, Email: esanders@kemri-wellcome.org.
Tobias F Rinke de Wit, Email: t.rinkedewit@pharmaccess.org.
Patricia A Cane, Email: Pat.Cane@phe.gov.uk.
James A Berkley, Email: jberkley@kemri-wellcome.org.
Acknowledgments
The authors are grateful to the staff and clients at the Comprehensive Care and Research Clinic for participating in the study. We are also grateful to the members of the Antiviral Unit at Colindale, London for undertaking the HIV drug resistance testing work. We are especially grateful to Dr Simon Carne and his team at the Antiviral Unit at Colindale, London for the HIV-1 RNA viral load quantification. This manuscript was submitted for publication with the permission from the Director of KEMRI.
Sources of funding
This work was supported by the Wellcome Trust foundation (grant number WT089351MA). ASH and JAB were funded by Wellcome Trust fellowships (WT089351MA and WT083579MA respectively). SM and HN were employees of the KEMRI/Wellcome Trust research programme while CAO was an employee of the Kenyan Ministry of Health. EJS was funded by the International AIDS Vaccine Initiative while PAC was financially supported by the Health Protection Agency, UK. TFRW was a member of the PharmAccess African studies to Evaluate Resistance (PASER), which received financial support from the Ministry of Foreign Affairs of the Netherlands. The funding bodies played no part in the design, collection, management, analysis and interpretation of data and manuscript preparation.
Sequence data
GenBank accession numbers [GenBank: KC568476 – KC568530].
References
- UNAIDS. Core slides: Global summary of the AIDS epidemic. 2012. Available at: [ http://www.unaids.org/en/media/unaids/contentassets/documents/epidemiology/2012/201207_epi_core_en.pdf]. Accessed 20 Nov 2012.
- UNAIDS. Global AIDS epidemic facts and figures. 2012. Available at: [ http://www.unaids.org/en/media/unaids/contentassets/documents/epidemiology/2012/201207_FactSheet_Global_en.pdf]. Accessed 20 Nov 2012.
- NACC and NASCOP. Kenya AIDS Epidemic update. 2012. Available at: [ http://www.unaids.org/en/dataanalysis/knowyourresponse/countryprogressreports/2012countries/ce_KE_Narrative_Report.pdf]. Accessed 04 April 2013.
- Bendavid E, Bhattacharya J. The president’s emergency plan for AIDS relief in Africa: an evaluation of outcomes. Ann Intern Med. 2009;11(10):688–695. doi: 10.7326/0003-4819-150-10-200905190-00117. [DOI] [PMC free article] [PubMed] [Google Scholar]
- Jahn A, Floyd S, Crampin AC. et al. Population-level effect of HIV on adult mortality and early evidence of reversal after introduction of antiretroviral therapy in Malawi. Lancet. 2008;11(9624):1603–1611. doi: 10.1016/S0140-6736(08)60693-5. [DOI] [PMC free article] [PubMed] [Google Scholar]
- UNAIDS. World AIDS Day Report. 2011. Available at: [ http://www.unaids.org/en/media/unaids/contentassets/documents/unaidspublication/2011/jc2216_worldaidsday_report_2011_en.pdf]. Accessed 20 Nov 2012.
- Gupta RK, Hill A, Sawyer AW. et al. Virological monitoring and resistance to first-line highly active antiretroviral therapy in adults infected with HIV-1 treated under WHO guidelines: a systematic review and meta-analysis. Lancet Infect Dis. 2009;11(7):409–417. doi: 10.1016/S1473-3099(09)70136-7. [DOI] [PubMed] [Google Scholar]
- Keiser O, Tweya H, Boulle A. et al. Switching to second-line antiretroviral therapy in resource-limited settings: comparison of programmes with and without viral load monitoring. AIDS. 2009;11(14):1867–1874. doi: 10.1097/QAD.0b013e32832e05b2. [DOI] [PMC free article] [PubMed] [Google Scholar]
- World Health Organization. Antiretroviral therapy for HIV infection in adults and adolescents: recommendations for a public health approach - 2010 rev. Available at: [ http://whqlibdoc.who.int/publications/2010/9789241599764_eng.pdf]. Accessed 20 Nov 2012. [PubMed]
- Badri M, Lawn SD, Wood R. Utility of CD4 cell counts for early prediction of virological failure during antiretroviral therapy in a resource-limited setting. BMC Infect Dis. 2008;11:89. doi: 10.1186/1471-2334-8-89. [DOI] [PMC free article] [PubMed] [Google Scholar]
- Mee P, Fielding KL, Charalambous S, Churchyard GJ, Grant AD. Evaluation of the WHO criteria for antiretroviral treatment failure among adults in South Africa. AIDS. 2008;11(15):1971–1977. doi: 10.1097/QAD.0b013e32830e4cd8. [DOI] [PubMed] [Google Scholar]
- van Oosterhout JJ, Brown L, Weigel R. et al. Diagnosis of antiretroviral therapy failure in Malawi: poor performance of clinical and immunological WHO criteria. Trop Med Int Health. 2009;11(8):856–861. doi: 10.1111/j.1365-3156.2009.02309.x. [DOI] [PubMed] [Google Scholar]
- Barth RE, Tempelman HA, Moraba R, Hoepelman AI. Long-term outcome of an HIV-treatment programme in Rural Africa: viral suppression despite early mortality. AIDS Res Treat. 2011;11:434375. doi: 10.1155/2011/434375. [DOI] [PMC free article] [PubMed] [Google Scholar]
- Kantor R, Diero L, Delong A. et al. Misclassification of first-line antiretroviral treatment failure based on immunological monitoring of HIV infection in resource-limited settings. Clin Infect Dis. 2009;11(3):454–462. doi: 10.1086/600396. [DOI] [PMC free article] [PubMed] [Google Scholar]
- Barth RE, van der Loeff MF, Schuurman R, Hoepelman AI, Wensing AM. Virological follow-up of adult patients in antiretroviral treatment programmes in sub-Saharan Africa: a systematic review. Lancet Infect Dis. 2010;11(3):155–166. doi: 10.1016/S1473-3099(09)70328-7. [DOI] [PubMed] [Google Scholar]
- Stadeli KM, Richman DD. Rates of emergence of HIV drug resistance in resource-limited settings: a systematic review. Antivir Ther. 2013;11(1):115–123. doi: 10.3851/IMP2437. [DOI] [PMC free article] [PubMed] [Google Scholar]
- National AIDS & STI Control Programme. Kenya National Clinical Manual For ART Providers. Available at: [ http://nascop.or.ke/library/ART%20guidelines/Kenya%20clinical%20National%20Manual%20for%20ART%20providers.pdf]. Accessed 20 Nov 2012.
- Hassan AS, Fielding KL, Thuo NM. et al. Early loss to follow-up of recently diagnosed HIV-infected adults from routine pre-ART care in a rural district hospital in Kenya: a cohort study. Trop Med Int Health. 2012;11(1):82–93. doi: 10.1111/j.1365-3156.2011.02889.x. [DOI] [PMC free article] [PubMed] [Google Scholar]
- Goldman JD, Cantrell RA, Mulenga LB. et al. Simple adherence assessments to predict virologic failure among HIV-infected adults with discordant immunologic and clinical responses to antiretroviral therapy. AIDS Res Hum Retroviruses. 2008;11(8):1031–1035. doi: 10.1089/aid.2008.0035. [DOI] [PMC free article] [PubMed] [Google Scholar]
- Weidle PJ, Wamai N, Solberg P. et al. Adherence to antiretroviral therapy in a home-based AIDS care programme in rural Uganda. Lancet. 2006;11(9547):1587–1594. doi: 10.1016/S0140-6736(06)69118-6. [DOI] [PubMed] [Google Scholar]
- Cane P. HIV drug resistance testing. Methods Mol Biol. 2011;11:123–132. doi: 10.1007/978-1-60761-817-1_8. [DOI] [PubMed] [Google Scholar]
- Liu TF, Shafer RW. Web resources for HIV type 1 genotypic-resistance test interpretation. Clin Infect Dis. 2006;11(11):1608–1618. doi: 10.1086/503914. [DOI] [PMC free article] [PubMed] [Google Scholar]
- Rhee SY, Gonzales MJ, Kantor R. et al. Human immunodeficiency virus reverse transcriptase and protease sequence database. Nucleic Acids Res. 2003;11(1):298–303. doi: 10.1093/nar/gkg100. [DOI] [PMC free article] [PubMed] [Google Scholar]
- Kosakovsky Pond SL, Posada D, Stawiski E. et al. An evolutionary model-based algorithm for accurate phylogenetic breakpoint mapping and subtype prediction in HIV-1. PLoS Comput Biol. 2009;11(11):e1000581. doi: 10.1371/journal.pcbi.1000581. [DOI] [PMC free article] [PubMed] [Google Scholar]
- National aIDS & STI Control Program. Guidelines for antiretroviral therapy in Kenya. 4. 2011. [Available at: [ http://healthservices.uonbi.ac.ke/sites/default/files/centraladmin/healthservices/Kenya%20Treatment%20Guidelines%202011.pdf]. Accessed 04 May 2013. [Google Scholar]
- Stadeli KM, Richman DD. Rates of emergence of HIV drug resistance in resource-limited settings: a systematic review. Antivir Ther. 2013;11(1):115–123. doi: 10.3851/IMP2437. [DOI] [PMC free article] [PubMed] [Google Scholar]
- World Health Organization. HIV Drug Resistance Early Warning Indicators. World Health Organization indicators to monitor HIV drug resistance prevention at antiretroviral treatment sites June 2010 Update. Available at: [ http://www2.paho.org/hq/dmdocuments/2010/hivdr-early-warning-indicators—updated-april-2010.pdf]. Accessed 20 Nov 2012.
- Sigaloff KC, Hamers RL, Menke J. et al. Early warning indicators for population-based monitoring of HIV drug resistance in 6 African countries. Clin Infect Dis. 2012;11(Suppl 4):S294–S299. doi: 10.1093/cid/cir1015. [DOI] [PubMed] [Google Scholar]
- El-Khatib Z, Katzenstein D, Marrone G. et al. Adherence to drug-refill is a useful early warning indicator of virologic and immunologic failure among HIV patients on first-line ART in South Africa. PLoS One. 2011;11(3):e17518. doi: 10.1371/journal.pone.0017518. [DOI] [PMC free article] [PubMed] [Google Scholar]
- Nachega JB, Hislop M, Dowdy DW. et al. Adherence to highly active antiretroviral therapy assessed by pharmacy claims predicts survival in HIV-infected South African adults. J Acquir Immune Defic Syndr. 2006;11(1):78–84. doi: 10.1097/01.qai.0000225015.43266.46. [DOI] [PubMed] [Google Scholar]
- Messou E, Chaix ML, Gabillard D. et al. Association between medication possession ratio, virologic failure and drug resistance in HIV-1-infected adults on antiretroviral therapy in Cote d’Ivoire. J Acquir Immune Defic Syndr. 2011;11(4):356–364. doi: 10.1097/QAI.0b013e3182084b5a. [DOI] [PMC free article] [PubMed] [Google Scholar]
- Dowshen N, D’Angelo L. Health care transition for youth living with HIV/AIDS. Pediatrics. 2011;11(4):762–771. doi: 10.1542/peds.2011-0068. [DOI] [PubMed] [Google Scholar]
- Assoumou L, Descamps D, Yerly S. et al. Prevalence of HIV-1 drug resistance in treated patients with viral load >50 copies/mL in 2009: a French nationwide study. J Antimicrob Chemother. 2013;11(6):1400–1405. doi: 10.1093/jac/dkt033. [DOI] [PubMed] [Google Scholar]
- Nettles RE, Kieffer TL, Kwon P. et al. Intermittent HIV-1 viremia (Blips) and drug resistance in patients receiving HAART. JAMA. 2005;11(7):817–829. doi: 10.1001/jama.293.7.817. [DOI] [PubMed] [Google Scholar]
- Lee PK, Kieffer TL, Siliciano RF, Nettles RE. HIV-1 viral load blips are of limited clinical significance. J Antimicrob Chemother. 2006;11(5):803–805. doi: 10.1093/jac/dkl092. [DOI] [PubMed] [Google Scholar]
- van Sighem A, Zhang S, Reiss P. et al. Immunologic, virologic, and clinical consequences of episodes of transient viremia during suppressive combination antiretroviral therapy. J Acquir Immune Defic Syndr. 2008;11(1):104–108. doi: 10.1097/QAI.0b013e31816a1d4f. [DOI] [PubMed] [Google Scholar]
- Hamers RL, Wallis CL, Kityo C. et al. HIV-1 drug resistance in antiretroviral-naive individuals in sub-Saharan Africa after rollout of antiretroviral therapy: a multicentre observational study. Lancet Infect Dis. 2011;11(10):750–759. doi: 10.1016/S1473-3099(11)70149-9. [DOI] [PubMed] [Google Scholar]
- Gupta RK, Jordan MR, Sultan BJ. et al. Global trends in antiretroviral resistance in treatment-naive individuals with HIV after rollout of antiretroviral treatment in resource-limited settings: a global collaborative study and meta-regression analysis. Lancet. 2012;11(9849):1250–1258. doi: 10.1016/S0140-6736(12)61038-1. [DOI] [PMC free article] [PubMed] [Google Scholar]
- Hamers RL, Schuurman R, Sigaloff KC. et al. Effect of pretreatment HIV-1 drug resistance on immunological, virological, and drug-resistance outcomes of first-line antiretroviral treatment in sub-Saharan Africa: a multicentre cohort study. Lancet Infect Dis. 2012;11(4):307–317. doi: 10.1016/S1473-3099(11)70255-9. [DOI] [PubMed] [Google Scholar]
- Kuritzkes DR, Lalama CM, Ribaudo HJ. et al. Preexisting resistance to nonnucleoside reverse-transcriptase inhibitors predicts virologic failure of an efavirenz-based regimen in treatment-naive HIV-1-infected subjects. J Infect Dis. 2008;11(6):867–870. doi: 10.1086/528802. [DOI] [PubMed] [Google Scholar]
- Wittkop L, Gunthard HF, de Wolf F. et al. Effect of transmitted drug resistance on virological and immunological response to initial combination antiretroviral therapy for HIV (EuroCoord-CHAIN joint project): a European multicohort study. Lancet Infect Dis. 2011;11(5):363–371. doi: 10.1016/S1473-3099(11)70032-9. [DOI] [PubMed] [Google Scholar]
- Hassan AS, Mwaringa SM, Obonyo CA. et al. Low prevalence of transmitted HIV type 1 drug resistance among antiretroviral-naive adults in a Rural HIV clinic in Kenya. AIDS Res Hum Retroviruses. 2013;11(1):129–135. doi: 10.1089/aid.2012.0167. [DOI] [PMC free article] [PubMed] [Google Scholar]
Associated Data
This section collects any data citations, data availability statements, or supplementary materials included in this article.
Supplementary Materials
Logistic regression analysis describing correlates of HIV-1 virologic failure (viral load ≥1000 copies/ml) among first line antiretroviral experienced adults at a rural HIV clinic in coastal Kenya (N=232). Table S2. Distribution and correlates of HIV-1 acquired drug resistance (if genotyping was only done for samples with viral load ≥1000 copies/ml) among first-line antiretroviral experienced adults at a rural HIV clinic in coastal Kenya (N=230).