

Abstract
Although humans clearly expend more energy to walk with an extra load, it is unclear what biomechanical mechanisms contribute to that increase. One possible contribution is the mechanical work performed on the body center of mass (COM), which simple models predict should increase linearly with added mass. The work should be performed primarily by the lower extremity joints, although in unknown distribution, and cost a proportionate amount of metabolic energy. We therefore tested normal adults (N=8) walking at constant speed (1.25 m s−1) with varying backpack loads up to 40% of body weight. We measured mechanical work (both performed on the COM and joint work from inverse dynamics), as well as metabolic energy expenditure through respirometry. Both measures of work were found to increase approximately linearly with carried load, with COM work rate increasing by approximately 1.40 W for each 1 kg of additional load. The joints all contributed work, but the greatest increase in positive work was attributable to the ankle during push-off (45–60% of stride time) and the knee in the rebound after collision (12–30% stride). The hip performed increasing amounts of negative work, near the end of stance. Rate of metabolic energy expenditure also increased approximately linearly with load, by approximately 7.6 W for each 1 kg of additional load. The ratio of the increases in work and metabolic cost yielded a relatively constant efficiency of approximately 16%. The metabolic cost not explained by work appeared to be relatively constant with load and did not exhibit a particular trend. Most of the increasing cost for carrying a load appears to be explained by positive mechanical work, especially about the ankle and knee, with both work and metabolic cost increasing nearly linearly with added mass.
KEY WORDS: Biomechanics, Energetic costs, Load carriage walking
INTRODUCTION
Humans expend considerably more effort to walk when carrying a backpack load. Metabolic energy expenditure increases sharply with the load carried, and can easily double for a moderate load (Goldman and Iampietro, 1962; Soule et al., 1978). Gait kinematics do not change nearly as much (Ghori and Luckwill, 1985; Tilbury-Davis and Hooper, 1999), suggesting that the energetic cost appears less due to an altered gait pattern than to the effort of transporting the load itself. Indeed, the forces and joint moments of walking do increase markedly with load, as does the electromyographic activity of muscles in the lower limbs and trunk (Ghori and Luckwill, 1985; Knapik et al., 1996). However, it remains difficult to predict how biomechanical variables should increase with load, and how they might mechanistically contribute to greater metabolic energy expenditure. This underscores the need for a mechanistic explanation for the metabolic cost of walking as a function of load.
A major contributor to metabolic cost is the active mechanical work performed by muscles. Physical principles dictate that active work must cost energy; muscles perform work with an empirically observed efficiency (defined as work divided by energetic cost) of 25% or less, as observed in a variety of human experiments and isolated muscle preparations (Margaria, 1976). Negative work also costs positive energy, although at lower cost, with an efficiency of approximately −120%. During walking, work is performed on the body center of mass (COM) and to move body segments relative to the COM (Cavagna and Kaneko, 1977). The former appears dominated by work needed to redirect the COM between successive stance phases (Donelan et al., 2002a; Donelan et al., 2002b). This is because the COM moves atop a stance leg that behaves approximately like a pendulum (Fig. 1), and hence its velocity must be redirected from one pendulum-like arc to the next. A backpack load would be expected to add proportionately to the work needed to redirect the COM, and to add little to work performed for motions relative to the COM. Indeed, measurements of work performed on the COM do appear to increase with load (Grenier et al., 2012; Griffin et al., 2003). Much of that work is performed simultaneously as positive work by the trailing leg and negative work by the leading leg, and could account for much of the metabolic cost of walking (Donelan et al., 2002b).
Fig. 1.

Mechanical work to redirect the center of mass during walking. The body center of mass (COM) moves atop pendulum-like legs, so that motion during single support requires relatively little work. The COM moves in an arc, and its velocity ( ) must be redirected from a downward-and-forward direction to an upward-and-forward direction when transitioning from one stance leg to the next. Each leg produces a ground reaction force (largely directed along the leg) to effect this transition, and consequently performs work on the COM. The addition of an extra load (Mload) increases the total mass (Mtotal) that must be redirected, with a proportional increase in work. That work is hypothesized to require additional metabolic energy expenditure. M, body mass.
There are also metabolic costs other than for moving the COM. One example is a cost for moving the legs back and forth relative to the body. That cost may be associated more with activating muscle than with performing work (Doke and Kuo, 2007; Doke et al., 2005). It would be expected to contribute to walking energetics, but not to increase with a backpack load. Energy also appears to be expended to make small adjustments in foot placement from step to step, for balance control (O'Connor et al., 2012). Another possible cost is for supporting body weight, originally proposed by Taylor et al. (Taylor et al., 1980) for running gaits, but also applied to walking by Griffin et al. (Griffin et al., 2003). Such a cost should increase with carried load, presumably in an amount separable from work. These and other energetic contributions are, unfortunately, far less straightforward to identify empirically. Perhaps an indication of their magnitude can be formed indirectly, from the metabolic cost changes that occur independently of work on the COM.
These metabolic energetic cost contributions may be estimated in comparison with mechanical work, which must therefore be quantified for walking. One empirical measure is the work performed on the COM by each limb (termed ‘COM work’ here), defined as the integral of the vector dot product of the limb's ground reaction force against the COM velocity. Although it is a relatively simple measure, it can quantify the substantial work performed by the limbs against each other during double support (Donelan et al., 2002a), and as a function of load carriage (Grenier et al., 2012; Griffin et al., 2003). It does not, however, reveal which joints perform that work. That information is better revealed through the
List of symbols and abbreviations
- c, c′
empirical coefficient of proportionality for work and metabolic rate
- COM
center of mass
- d, d′
constant representing work or metabolic rate independent of load

net metabolic rate

constant representing metabolic energy expenditure rate independent of work

ground reaction force
- g
gravitational acceleration
- L
leg length
- M
body mass
- Mload
added mass (load + backpack)
- PCOM
instantaneous center of mass work rate
center of mass velocity
-
 ,
, 
center of mass work per stride, positive and negative
-
 ,
, 
average center of mass work rate, positive and negative
-
 ,
, 
sum of joint work per stride
-
 ,
, 
ankle joint work per stride
-
 ,
, 
hip joint work per stride
-
 ,
, 
knee joint work per stride
- η
empirical delta efficiency
inverse dynamics technique, which estimates the resultant mechanical power from each joint (‘joint work’). But neither inverse dynamics nor COM work can determine the actual work by muscles, nor can they isolate work performed by tendons (Alexander, 1991) and other soft tissues (Zelik and Kuo, 2010), which can contribute passively with little direct metabolic energy cost. Some such contributions can be quantified through imaging techniques such as ultrasound, particularly for the ankle (Fukunaga et al., 2001), but not as readily for the other joints. We consider COM work and joint work to be practically useful, if imperfect, measures of the work of walking. However, they have not previously been quantified together to help explain the metabolic cost of load carriage.
The complementary features of different work measures might reveal insight regarding load carriage during walking. An advantage of COM work is that it bears a straightforward link to a simple hypothesis, that COM work should increase linearly with carried load. Joint work can then indicate where in the leg the work is performed, and its difference with COM work can indicate work for movements relative to the COM. If a carried load mainly affects COM work, then metabolic cost would be expected to increase proportionately, with an additional offset term that is constant relative to load. That offset term may indicate the metabolic cost for the work performed relative to the COM, as well as other metabolic costs not related to work. We therefore hypothesize that there would be a linear increase in COM work and metabolic cost as a function of carried load. Furthermore, those increases imply a linear dependence between work and metabolic energy expenditure. The present study is intended to test for such relationships between the mechanics and energetics of walking with a backpack load.
RESULTS
Walking with a backpack load caused a number of energetic and biomechanical effects. As expected, subjects expended more metabolic energy when carrying heavier loads, with an approximately linear increase in net metabolic rate with load. Biomechanical effects most notably included increased mechanical work, in terms of both COM work and joint work. Work rate increased approximately linearly with load, similar to net metabolic rate. As a result, net metabolic rate and work rate also increased in approximately linear proportion to each other. The specifics of these results, as well as other associated findings, are presented below and are also quantified in Table 1.
Table 1.
Quantitative results for walking with a backpack load
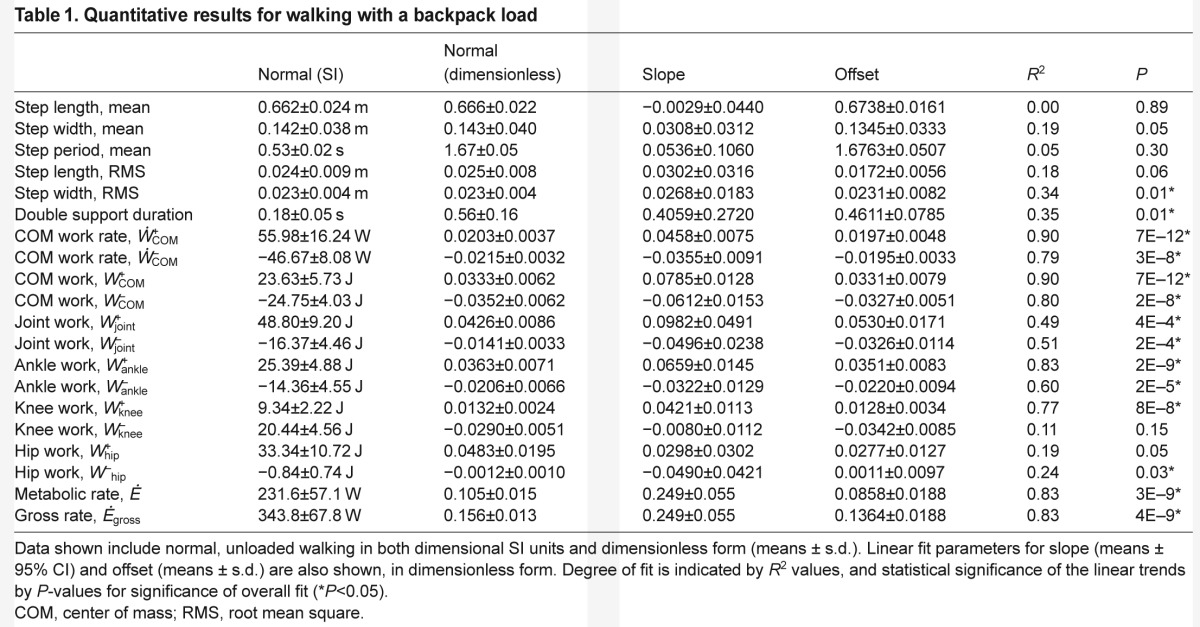
To serve as a baseline for comparisons, normal walking condition values were as follows. At the fixed walking speed of 1.25 m s−1, subjects walked with average step length of 0.662 m, step width of 0.142 m, step time of 0.532 s and double support time of 0.179 s. Average positive COM work per stride was 23.6 J, and positive summed joint work per stride was 48.8 J. Gross metabolic rate was approximately 344 W, and net metabolic rate was 232 W. The net metabolic cost of transport, defined as metabolic rate divided by walking speed (all in dimensionless units), was 2.57.
Load had little effect on most step parameters (Fig. 2). There were no significant changes in step length, width (Fig. 2A) or duration (Fig. 2B) with carried load. However, step width variability did increase significantly (P=0.01; Fig. 2D) and approximately linearly with total mass, by approximately 50% over the range of loads studied. Step length variability did not change significantly (P=0.06; Fig. 2C). Although there was no significant change in step duration, the duration of double support did increase slightly, by approximately 30%. As a fraction of step period, double support times increased from approximately 29% to 38%.
Fig. 2.
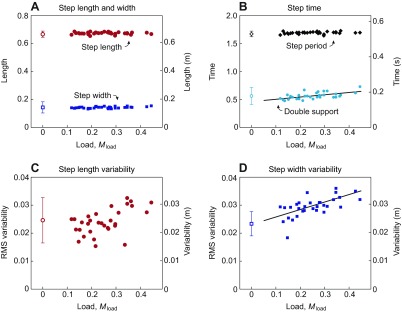
Step parameters for walking with a backpack load. (A) Average step length and width as a function of load, as a fraction of unloaded body weight (N=8). (B) Average step period and double support duration as a function of load. (C) Step length and (D) step width variability as a function of load, where variability is defined as root-mean-square (RMS) deviations from average steps. Solid lines represent significant linear trends with added mass (P<0.05). Of the step parameters shown, only double support and step width variability exhibited significant trends, both increasing with load. Open symbols represent normal unloaded walking (with error bars for s.d.). Left-hand vertical axes show dimensionless quantities, using body mass (M), leg length (L) and gravitational acceleration (g) as base units. Right-hand vertical axes show dimensional SI units.
In terms of mechanics, there are several qualitative observations to be made regarding the force and power trajectories (Fig. 3). The amplitudes of vertical and horizontal ground reaction forces increased with load (Fig. 3A,B), most notably in the two peaks of the vertical force. A similar trend may be observed from the COM work rate trajectories (Fig. 3C). Amplitudes appeared to increase with load for each of the four phases of positive or negative COM work: collision, rebound, preload and push-off. That effect is mirrored by the summed joint power trajectories (Fig. 3D), which behaved roughly similarly with increasing load. Examining the joints individually (Fig. 4), there appeared to be little change in joint angle trajectories with load. The amplitudes of joint moments and powers did increase with load.
Fig. 3.
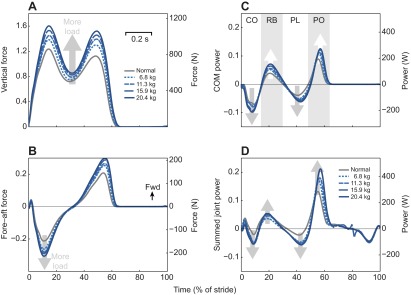
Force and power measures as a function of stride time, for different loads. (A) Vertical ground reaction force and (B) horizontal (fore–aft) ground reaction force versus percent stride time. Fwd, forward. (C) Instantaneous COM power, PCOM, versus time, defined as dot product of COM velocity with ground reaction force from one leg. CO, collision; RB, rebound; PL, preload; PO, push-off. (D) Summed joint power versus time, defined as sum of powers from ankle, knee and hip from one leg. Left-hand vertical axes show dimensionless quantities, right-hand vertical axes show dimensional SI units. Data shown are trajectories averaged across subjects (N=8).
Fig. 4.
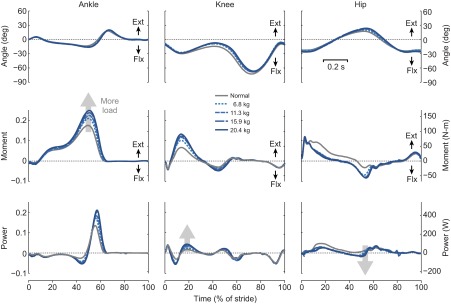
Joint kinematics and kinetics versus stride time for walking with different loads. Angle, moment and power trajectories are shown for ankle, knee and hip joints. Left-hand vertical axes show dimensionless quantities; right-hand vertical axes show dimensional SI units. Data shown are trajectories averaged across subjects (N=8). Positive angles and moments are defined in extension (Ext) as opposed to flexion (Flx).
We next examine how work and metabolic energy expenditure rates increase with load (Fig. 5). The rate of positive work performed on the COM () increased approximately linearly with total mass, and nearly doubled across the range of loads studied. Subjects performed approximately 1.40 W of additional positive mechanical work rate for each additional 1 kg carried by backpack (Fig. 5A). They also expended approximately 7.62 W of additional metabolic power for each additional 1 kg carried by backpack, at the designated speed of 1.25 m s−1 (Fig. 5B). Net metabolic power nearly doubled across the loads tested. To illustrate the effect of the normalization procedure, which was intended to
reduce scatter caused by differences in subject body mass and leg length, results are presented in terms of absolute physical units of power (W) versus mass (kg), as well as using dimensionless variables (Fig. 5C and 5D, respectively). The linear fits for both work and metabolic cost also yield residuals (Fig. 5C,D), which did not obviously reveal any additional trends.
Fig. 5.

Mechanical work and metabolic energy cost as a function of load, with and without normalization. (A) Rate of positive work, , performed on the COM and (B) net metabolic rate, , versus added load, both in un-normalized form. Each subject's data are denoted by a separate color; open symbols denote normal, unloaded walking. (C) Normalized mechanical work rate and (D) net metabolic rate versus load, along with residuals after subtracting the linear trend from data. Statistically significant linear trends were observed for both work and metabolic data (P=7E–12 and 3E–9, respectively). Normalization procedure includes non-dimensionalization, using body mass (M), leg length (L) and gravitational acceleration (g) as base units. In addition, a separate y-intercept was determined for each subject's linear trend, reducing variability due to differing constant offsets. Net metabolic rate is defined as gross rate minus the rate for quiet standing.
The work trends may be examined more closely on a per-stride basis. The work performed on the COM, and from the summed joints, both increased approximately linearly with load (Fig. 6A). The slopes of these increases were not significantly different (COM work per stride increased 0.76±0.12 J per 1 kg of load, and joint work by 0.96±0.48 J; P=0.77, ANCOVA). The amount of positive COM work was close to the negative COM work, indicating zero net mechanical work for steady-state walking, but the sum of negative joint work was much less than the sum of positive work, implying that the soft tissue work also increased with load (Zelik and Kuo, 2012). Examining the individual joints (Fig. 6B), they generally performed positive work increasing approximately linearly with load. Work is normally performed by the ankle, hip and knee, in decreasing order of contributions. With carried loads, however, the greatest increases were at the ankle, knee and (with marginal significance) hip, in decreasing order. The joints also normally perform negative work at the knee, ankle and hip (in decreasing order of magnitudes). With load, these magnitudes increased at the hip and ankle, with no significant effect at the knee.
Fig. 6.

Mechanical work as a function of load mass. (A) Average positive COM work, , and summed joint work per stride, (labeled C+ and J+, respectively), along with negative work (C− and J−). (B) Positive work by ankle, knee and hip joints (A+, K+ and H+, respectively; negative work also shown), compared with summed joint work per stride (J+). Linear trends (denoted by lines, N=8) were fit to each measure, and were statistically significant (P<0.05) in all cases except for negative knee work and positive hip work. Open symbols represent normal unloaded walking (with error bars for s.d.). Left-hand vertical axes show dimensionless quantities; right-hand vertical axes show dimensional SI units.
Work and metabolic energy expenditure may also be compared against each other (Fig. 7). A total least-squares fit between COM work rate and metabolic rate yields a slope of 6.394±0.246 (±95% CI) and an offset of −0.051±0.008 (see Eqn 4). The inverse of the slope yields an efficiency, η, of 0.156±0.006 for COM work. A similar calculation with summed joint power yields an efficiency of 0.163±0.059 for summed joint work.
Fig. 7.

Net metabolic rate versus positive COM work rate for walking with varying amounts of backpack load. Also shown are residuals after subtracting a linear trend fit (solid line; total least-squares fit applied to load data only). A significant trend was found with slope 6.394±0.246 (±95% CI) and offset −0.051±0.008 (±s.d.). Reciprocal of slope yields η=0.156±0.006, meaning a delta efficiency of positive work of approximately 16%. No obvious trend was observed in the residuals. Left-hand vertical axes show dimensionless quantities, right-hand vertical axes show dimensional SI units, and similarly for bottom and top axes. Data points for individual subjects are distinguished by color.
DISCUSSION
This experiment was intended to test whether a carried load proportionally increases the work performed on the COM, and whether that work leads to a proportional increase in metabolic energy expenditure. We had hypothesized that a backpack load mainly affects the inertia of the COM, which must be redirected in the transition between pendulum-like steps. The load should also have little effect on the work performed for motions relative to the COM, and on other metabolic energetic costs not related to work. Our results yielded three main linear proportionalities between load, mechanical work and metabolic energy expenditure. We next consider how well the results agreed with these expectations, and examine the complementary measures of joint work, which may indicate how the body performs the greater workload.
Backpack loading resulted in approximately proportionate increases in mechanical work (Fig. 6). A linear fit suggests that the increased COM work is largely explained by the added mass. This is because redirection of the COM is determined mainly by mass, walking speed and step length (Adamczyk and Kuo, 2009). Here, only mass was varied (as the independently controlled variable) and speed was kept fixed. Subjects tended to maintain nearly the same step parameters (Fig. 2) and joint kinematics (Fig. 4), leaving little opportunity to change how the COM was redirected. This means that COM work is mainly determined by how much mass is redirected, as predicted by Eqn 2 (see Materials and methods). An
approximately linear increase was also observed in the positive summed joint work (). This is largely as expected, because COM work must largely result from actions at the joints. In addition, the joints also perform work to move the limbs relative to the COM, as indicated by the difference between summed joint work and COM work (Fig. 6; approximately 38% of summed joint work). While most of the joint work may be attributable to moving the COM, a smaller amount of work is also performed to move body segments relative to the COM.
The individual joint powers reveal more detail about the distribution of work (Fig. 4). We had no prediction for the apportionment between joints, but much of the increase with load appeared to occur at the ankle during push-off, which produces the largest proportion of the positive work in both unloaded and loaded walking. The knee also performed increasing positive work, mostly during rebound (Fig. 4, knee power). In contrast, the hip only performed marginally more work with mass. As for negative work, its magnitude also increased, primarily at the hip, and mostly near the end of swing phase. This might aid the faster swing that occurred with increasing double support time and relatively constant stride time (Birrell and Haslam, 2009; Martin and Nelson, 1986). These various changes in joint work accounted for the largely parallel changes in summed joint work and COM work with load.
Closer examination of joint work also reveals possible roles of tendons and other soft tissues. Tendons are highly elastic, as exhibited by considerable passive energy return at the ankle during walking (Fukunaga et al., 2001). Here, increasing mass led to greater amplitude in the sequence of ankle pre-load and push-off, where negative and then positive work is performed. Similarly, the amplitude of negative collision work of the knee was apparently accompanied by greater positive rebound work (Fig. 4, knee power). Both sequences may benefit from elastic energy return, as is implied by our terminology (Donelan et al., 2002b; Kuo et al., 2005). Indeed, the increase in double support duration (Fig. 2D) is consistent with a spring–mass system, whose natural frequency decreases with greater mass. The amplitude of both COM and joint powers also increase with mass (Fig. 3B,D), also consistent with a driven mass–spring oscillation, as previously proposed by Holt et al. (Holt et al., 2003). Aside from tendon elasticity, other soft tissues such as the viscera and heel pad can act as passive, damped elastic elements. They can thus perform work not captured by inverse dynamics (Zelik and Kuo, 2010; Zelik and Kuo, 2012). Here, the negative summed joint work was considerably lesser in magnitude than the corresponding positive work, ranging from approximately 57 to 61% of positive work for the loads examined. This suggests that some negative work was performed by soft tissue deformation (DeVita et al., 2007; Zelik and Kuo, 2010) and was not captured by joint work, because the body must perform equal amounts of positive and negative work to walk at steady speed. These results suggest the possibility of elastic and damped elastic energy return during walking with load carriage.
We also observed an approximately linear increase in net metabolic rate with load (Fig. 5D), expected from Eqn 3 (see Materials and methods). The cost may be described by the increase in net metabolic rate per extra load as a fraction of body weight (c′ in Eqn 3), with a value of approximately 0.25, which exceeds the corresponding value of 0.11 for net metabolic rate of normal unloaded walking (or 0.16 for gross rate; Table 1). These measures suggest that humans expend relatively more energy to carry a backpack load than to carry an equivalent amount of their own body mass. The metabolic cost is also consistent with the approximately linear increase observed for mechanical work (Fig. 5B), assuming a constant efficiency. The observed delta efficiency (η; Eqn 4) was approximately 15.6% for positive COM work, and approximately 16.3% for positive summed joint work. These are somewhat lower than the typical 25% efficiency for positive work by muscle [or 21% if the cost of negative work is also included (Donelan et al., 2002b)]. Both work measures may tend to underestimate actual muscle work, because of positive work at one muscle that inadvertently cancels negative work by another, even though both may exact a metabolic cost. This may occur in the form of co-contraction about a single joint, or as cancellation across multiple joints. Motion-capture-based measures of mechanical work cannot generally resolve such effects, nor can they easily quantify passive work by elastic tendons. We nevertheless prefer simple measures such as COM work, because its trends can be predicted from simple models, whereas those for the individual joint powers are far more challenging to predict from first principles. As a complementary measure, summed joint power is also relatively simple and helps to indicate work performed for body motions relative to the COM (Zelik and Kuo, 2010).
A number of factors aside from work are expected to contribute to metabolic energy expenditure. Walking also requires maintenance of balance and motion of the arms and legs relative to the body, among other features. It is possible that load carriage places increasing demands on balance, as perhaps indicated by increasing step width variability (Fig. 3). Such variability is thought to contribute to energy expenditure (O'Connor et al., 2012), but in quite a small amount relative to the large increases observed here. These and other costs appear to contribute quite substantially to the overall cost of walking, but relatively little to the change in energy expended with increasing backpack load.
Our results may be compared with those of other published studies. Others have reported relatively subtle changes in step parameters and kinematics with moderate loads (Harman et al., 2000; Martin and Nelson, 1986), which appeared to occur here as well. There are few other studies quantifying joint work as a
function of load [e.g. peak power quantified by Chow et al. (Chow et al., 2005)], but the results for unloaded walking appear consistent with the literature (Winter, 2005; Zelik and Kuo, 2010). As for COM work, our measure () is equivalent to the ‘individual limb external work’ of Griffin et al. (Griffin et al., 2003) and to the ‘total work’ of Grenier et al. (Grenier et al., 2012), which sums the ‘external work’ for combined limbs with the ‘internal work during double contact’. (There are inconsistent definitions implied for ‘external’ and ‘internal’ within the literature, and so we prefer the term ‘COM work’.) Accounting for the different applied walking speeds, our work results are largely consistent with those studies.
Our metabolic energy results are also comparable to the literature. A number of previous studies have reported approximately linear increases with mass (Griffin et al., 2003; Pierrynowsi et al., 1981; Soule et al., 1978). For an extra load of 30% of body mass, we observed the equivalent of approximately 40% increased gross metabolic cost, similar to previous reports (Pierrynowsi et al., 1981; Quesada et al., 2000). It must be noted that some studies have reported somewhat lower metabolic costs, for example 20–35% by Griffin et al. (Griffin et al., 2003) depending on speed, and approximately 25% by Grenier et al. (Grenier et al., 2012). Studies often differ in the means of load attachment, which included a waist belt (Griffin et al., 2003) and military load attachment (Grenier et al., 2012), which could affect metabolic costs. Our subjects were also relatively unpracticed with the backpack, whereas others (e.g. Grenier et al., 2012; Polcyn et al., 2002) have examined practiced infantrymen, who may be better adapted to carrying a backpack. Despite these and other differences, most studies appear to agree on an approximately proportionate metabolic cost increase with added mass, if not the actual value of that proportionality.
Our results also led to slightly different conclusions from some other studies. Griffin et al. (Griffin et al., 2003) found that locomotor efficiency, defined as COM work rate divided by net metabolic rate, varied with load and speed between approximately 16 and 28%. That non-constancy led them to conclude that work cannot explain the metabolic cost of load carriage, in favor of a metabolic cost of generating force to support body weight. We suspect that the variation in efficiency results from non-zero offsets present in work and energy data. Non-zero offsets arise for a variety of reasons, including the somewhat arbitrary designation of quiet standing as the baseline for net metabolic rate. Our preference is to ignore the offsets and concentrate on the changes in energy and work (Fig. 7) using delta efficiency, which do appear to be quite consistent, and can explain metabolic energy expenditure in terms of work. Although we cannot eliminate other costs for load carriage, they must be independent of load, contribute to the constant offset or the (rather small) residual (Fig. 7), or be correlates of work that are therefore difficult to separate from work. Regarding the residual, we have observed substantial residuals for other tasks such as bouncing about the ankles that we believe to be costly and unrelated to work (Dean and Kuo, 2011). Yet there was no obvious trend in the residuals found here. Furthermore, re-examination of data from Griffin et al. (Griffin et al., 2003) yields a fairly constant delta efficiency (of approximately 27%, with R2=0.96 for a fit through means across subjects for 16 combinations of speed and load), and a similar offset to what we observed ( of 0.010 versus 0.008). For our data, we can also form a conservative estimate of the minimum cost of work, by assuming that the positive work measured here was not an underestimate, and that negative work has no energetic cost. Applying an efficiency of 25%, positive mechanical work alone would still account for a minimum of approximately two-thirds of the metabolic cost we observed. This leads us to favor mechanical work as the primary cause of increased metabolic cost for load carriage, similar to the conclusions of Grenier et al. (Grenier et al., 2012).
Our experiment entailed a number of simplifications. Subjects walked on a smooth treadmill surface at fixed speed, whereas typical load carriage is often performed at self-selected, non-constant speed and on uneven ground, where there may be additional metabolic costs and challenges to balance. We also examined only moderate loads, whereas heavier loads may entail a more nonlinear and greater relative metabolic cost (Soule et al., 1978) and different kinematics (Attwells et al., 2006; Birrell and Haslam, 2009). We also did not study the effect of the load's position on the back, which can potentially affect the COM location and energy expenditure (Stuempfle et al., 2004). We instead placed the loads at one consistent location on the back, as might be typical of many applications. As discussed above, the measures of COM work and joint work are both imperfect indicators of actual muscle work. Muscle work, even if the accurately measured, also does not necessarily indicate actual metabolic cost, as when activation and deactivation costs are high (Dean and Kuo, 2011). These limitations may cause differences between the results reported here and actual walking with load carriage.
There are nevertheless some findings that may apply to load carriage in general. A backpack load increases the mass that must be redirected through COM work, and appears to have relatively little effect on gait kinematics and the amount of redirection. The result is a proportionate increase in COM work, accomplished mostly by the ankle and knee for positive work, and the hip for negative work. The increases in COM work (and summed joint work) appear to translate into a proportional increase in metabolic energy expenditure. While other metabolic costs might also contribute to walking, their contributions appeared to be either relatively fixed despite added mass, or correlated with (and therefore not separable from) the work we observed. The largest effect of a carried backpack load appears to be a proportional increase in mechanical work, with a proportional increase in metabolic cost.
MATERIALS AND METHODS
We performed an experiment to measure healthy adults walking with a backpack load. We measured metabolic energy expenditure and gait kinematics and kinetics during treadmill walking. Kinetic measures consisted of COM work performed by the individual limbs as well as joint work for the ankle, knee and hip. We tested for linear relationships between carried load and mechanical work, between load and metabolic energy expenditure, and between work and metabolic energy expenditure. The details of the experiment are presented below, followed by a brief explanation of the mechanism by which carried load should translate into work.
Experiment
Eight subjects (N=8, 6 male and 2 female) were tested while walking with a backpack load at a constant speed of 1.25 ms−1. Four loads ranging from 6.8 to 20.4 kg (steel weights of 15, 25, 35 and 45 lbs) were tested, carried by an external-frame backpack (3.8 kg) with standard shoulder straps and hip belt. The loads were placed behind the back, approximately 0.23 m higher than the sacrum. Normal walking without a backpack was also tested for reference. Subjects ranged from 19 to 26 years of age and had a mean body mass, M, of 71.1±12.0 kg (±s.d.) and leg length, L, of 0.99±0.03 m. All subjects provided written informed consent prior to the study, according to Institutional Review Board procedures.
We measured the rate of oxygen consumption and carbon dioxide production (in ml min−1) to estimate the metabolic energy expenditure rate, expressed in units of power (W) using standard conversion factors (Brockway, 1987). Each walking trial lasted at least 8 min, with the first 3 min discarded to ensure steady state, and average power computed from the remaining duration. Net metabolic rate, , was calculated by subtracting metabolic power for quiet standing (109.54±20.32 W, 0.0507±0.0065 dimensionless) from the gross metabolic power.
We calculated instantaneous COM work rate, PCOM, as the inner product of ground reaction force, , of each leg and COM velocity, (Donelan et al., 2002a):
| (1) |
The ground reaction force under each leg was measured with a custom-instrumented, split-belt treadmill (Collins et al., 2009). The COM velocity was computed from the integration of total ground reaction force, subject to constraints on periodicity. The positive work per stride, , was calculated from the integration of positive intervals of PCOM over each stride, and the average rate of positive COM work, , was defined as the positive COM work per stride divided by stride time and multiplied by 2 for two legs (and similarly for negative work, ). Thus, while work per stride is a single-leg quantity, mechanical work rate is for both legs, to facilitate comparison with net metabolic rate to yield apparent efficiency. We also qualitatively examined four phases of COM work rate defined from positive and negative intervals: collision, rebound, preload and push-off (Donelan et al., 2002b). We also measured other gait parameters such as step length, step time and double support time.
Joint work was computed from joint powers using inverse dynamics methods. An optical motion-capture system (VICON, Los Angeles, CA, USA) was used to capture lower extremity kinematics, and inverse dynamics analysis was performed using standard software (Visual3D, C-Motion, Germantown, MD, USA) for calculating joint angles, moments and powers for the ankle, knee and hip, in three dimensions. A six degree-of-freedom model was used for each segment (Hanavan, 1964), although only sagittal plane angles and moments are plotted for simplicity. Positive joint work per stride was calculated from the integration of positive intervals of joint power over each step. As a simple summary for an entire leg, we defined summed joint power as net power from the ankle, knee and hip of one leg. Positive summed joint work per stride, , was defined as the integration of positive intervals of summed joint power. Similar integrations were performed for negative work quantities (e.g. ). Average work rates were defined as work per stride multiplied by 2 and divided by stride time.
To serve as the primary independent variable in the study, we defined total mass, Mtotal, as the combined mass of the body (M) plus the added mass of the load (Mload; including backpack and load). Measurements were reported in dimensionless form, using base units of body mass, M, standing leg length, L (ground to greater trochanter), and gravitational acceleration, g. For example, masses were normalized by M (average 71.1 kg), moment and work by MgL (average 692.66 N-m), power by Mg1.5L0.5 (average 2176.12 W) and step length by L (0.99 m).
Model and data analysis
We analyzed the data with respect to three relationships between carried mass, mechanical work and metabolic energy expenditure. The first such relationship was for the dependency between rate of mechanical work performed on the COM and added mass. Simple models of dynamic walking (Fig. 1) predict that work must be performed to redirect the COM velocity between pendulum-like steps (Kuo, 2002). Push-off from the trailing leg performs positive work at the end of one stance phase. This is followed by a collision of the leading leg, which performs negative work at the beginning of the next stance phase. Experiments show that COM redirection also occurs during stance, in a burst of positive work termed rebound, followed by negative work termed pre-load (Donelan et al., 2002b), which both appear to interact with collision and push-off. Just as kinetic energy is proportional to mass, so is the work performed on the COM proportional to Mtotalv2s2, where v is walking speed and s is step length (Adamczyk and Kuo, 2009; Donelan et al., 2002b). Previous studies have shown carried mass to have little effect on step length at a fixed speed. We therefore expect that for a fixed speed, the positive COM work per step will increase in proportion to added mass (load + backpack mass):
| (2) |
where c is an empirical coefficient of proportionality and d is a constant representing work independent of load.
The second relationship tested was between rate of metabolic energy expenditure and added mass. We expect that COM work should account for a substantial fraction of metabolic cost, and therefore the metabolic rate should also increase according to:
| (3) |
where c′ is an empirical coefficient and d′ is a constant representing energy cost independent of load (the prime symbol refers to metabolic energy as opposed to work). An example of the latter is basal metabolism, which proceeds regardless of task. The combination of work and energy expenditure is also made more explicit by the third relationship:
 |
(4) |
where the empirical efficiency, η, is expected not to exceed 25% (Margaria, 1976), and the constant represents metabolic energy cost independent of work. The η defined here represents the change in metabolic cost per change in work, sometimes termed a delta efficiency (Gaesser and Brooks, 1975). It is also possible that there are other contributions to energy expenditure that also change with total mass, but are unrelated to COM work, which would be expected to appear as a residual error in Eqn 4.
We used linear regression to test these hypothesized relationships. We performed standard least-squares regression, with Mload as the independent variable, for Eqns 2 and 3. We used total least squares to test for Eqn 4, treating both and as subject to measurement error. To focus on linear trends that apply across different individuals, each regression was performed with a single slope across all subjects [reported with a corresponding 95% confidence interval (CI)] and a separate offset for each individual. The offsets account for the fact that individuals can differ in many respects not related to the independent variable, such as body mass distribution, muscle fiber composition and basal metabolic rate. These can result in different amounts of work and energy expenditure for normal walking, and therefore considerable variation in the offsets. To summarize these effects, graphical results are presented with the mean offset across individuals, and tabular results include the standard deviation of offsets across individuals. We also examined residual errors in the linear fits to test for metabolic costs not hypothesized here, such as energy expended with increasing mass but not explained by work.
We also tested for other trends that were less hypothesis-based. We tested how the positive joint work per stride (, and for ankle, knee and hip, respectively) changed as a function of total mass, and similarly for negative work per stride (, and ). There is no fundamental principle governing how work should be apportioned between the joints, and so we applied linear regression to determine and quantify the dependence, rather than to test a specific hypothesis. We did, however, expect the positive summed joint work per stride, , to increase linearly with mass, because the joints are ultimately responsible for the positive work performed on the COM (Eqn 2). Similarly, we expected negative summed joint work per stride, , to increase in magnitude with mass. Its magnitude should also be less than the positive summed joint work, because some negative work is performed passively through deformation of soft tissues (Zelik and Kuo, 2010).
FOOTNOTES
Competing interests
The authors declare no competing financial interests.
Funding
This work was supported in part by the Office of Naval Research (ETOWL program), the Department of Defense (W81XWH-09-2-0142), the National Institutes of Health (AG0308) and the Defense Advanced Research Projects Agency (Atlas Program). Deposited in PMC for release after 12 months.
References
- Adamczyk P. G., Kuo A. D. (2009). Redirection of center-of-mass velocity during the step-to-step transition of human walking. J. Exp. Biol. 212, 2668-2678 [DOI] [PMC free article] [PubMed] [Google Scholar]
- Alexander R. M. (1991). Energy-saving mechanisms in walking and running. J. Exp. Biol. 160, 55-69 [DOI] [PubMed] [Google Scholar]
- Attwells R. L., Birrell S. A., Hooper R. H., Mansfield N. J. (2006). Influence of carrying heavy loads on soldiers' posture, movements and gait. Ergonomics 49, 1527-1537 [DOI] [PubMed] [Google Scholar]
- Birrell S. A., Haslam R. A. (2009). The effect of military load carriage on 3-D lower limb kinematics and spatiotemporal parameters. Ergonomics 52, 1298-1304 [DOI] [PubMed] [Google Scholar]
- Brockway J. M. (1987). Derivation of formulae used to calculate energy expenditure in man. Hum. Nutr. Clin. Nutr. 41, 463-471 [PubMed] [Google Scholar]
- Cavagna G. A., Kaneko M. (1977). Mechanical work and efficiency in level walking and running. J. Physiol. 268, 467-481 [DOI] [PMC free article] [PubMed] [Google Scholar]
- Chow D. H. K., Kwok M. L. Y., Au-Yang A. C. K., Holmes A. D., Cheng J. C. Y., Yao F. Y. D., Wong M. S. (2005). The effect of backpack load on the gait of normal adolescent girls. Ergonomics 48, 642-656 [DOI] [PubMed] [Google Scholar]
- Collins S. H., Adamczyk P. G., Ferris D. P., Kuo A. D. (2009). A simple method for calibrating force plates and force treadmills using an instrumented pole. Gait Posture 29, 59-64 [DOI] [PMC free article] [PubMed] [Google Scholar]
- Dean J. C., Kuo A. D. (2011). Energetic costs of producing muscle work and force in a cyclical human bouncing task. J. Appl. Physiol. 110, 873-880 [DOI] [PMC free article] [PubMed] [Google Scholar]
- DeVita P., Helseth J., Hortobagyi T. (2007). Muscles do more positive than negative work in human locomotion. J. Exp. Biol. 210, 3361-3373 [DOI] [PMC free article] [PubMed] [Google Scholar]
- Doke J., Kuo A. D. (2007). Energetic cost of producing cyclic muscle force, rather than work, to swing the human leg. J. Exp. Biol. 210, 2390-2398 [DOI] [PubMed] [Google Scholar]
- Doke J., Donelan J. M., Kuo A. D. (2005). Mechanics and energetics of swinging the human leg. J. Exp. Biol. 208, 439-445 [DOI] [PubMed] [Google Scholar]
- Donelan J. M., Kram R., Kuo A. D. (2002a). Simultaneous positive and negative external mechanical work in human walking. J. Biomech. 35, 117-124 [DOI] [PubMed] [Google Scholar]
- Donelan J. M., Kram R., Kuo A. D. (2002b). Mechanical work for step-to-step transitions is a major determinant of the metabolic cost of human walking. J. Exp. Biol. 205, 3717-3727 [DOI] [PubMed] [Google Scholar]
- Fukunaga T., Kubo K., Kawakami Y., Fukashiro S., Kanehisa H., Maganaris C. N. (2001). In vivo behaviour of human muscle tendon during walking. Proc. Biol. Sci. 268, 229-233 [DOI] [PMC free article] [PubMed] [Google Scholar]
- Gaesser G. A., Brooks G. A. (1975). Muscular efficiency during steady-rate exercise: effects of speed and work rate. J. Appl. Physiol. 38, 1132-1139 [DOI] [PubMed] [Google Scholar]
- Ghori G. M. U., Luckwill R. G. (1985). Responses of the lower limb to load carrying in walking man. Eur. J. Appl. Physiol. Occup. Physiol. 54, 145-150 [DOI] [PubMed] [Google Scholar]
- Goldman R. F., Iampietro P. F. (1962). Energy cost of load carriage. J. Appl. Physiol. 17, 675-676 [DOI] [PubMed] [Google Scholar]
- Grenier J. G., Peyrot N., Castells J., Oullion R., Messonnier L., Morin J.-B. (2012). Energy cost and mechanical work of walking during load carriage in soldiers. Med. Sci. Sports Exerc. 44, 1131-1140 [DOI] [PubMed] [Google Scholar]
- Griffin T. M., Roberts T. J., Kram R. (2003). Metabolic cost of generating muscular force in human walking: insights from load-carrying and speed experiments. J. Appl. Physiol. 95, 172-183 [DOI] [PubMed] [Google Scholar]
- Hanavan E. P., Jr (1964). A Mathematical Model of the Human Body. Wright-Patterson AFB, OH: Air Force Aerospace Medical Research Lab; [PubMed] [Google Scholar]
- Harman E., Hoon K., Frykman P., Pandorf C. (2000). The Effects of Backpack Weight on The Biomechanics of Load Carriage. Natick, MA: Army Research Institute of Environmental Medicine; [Google Scholar]
- Holt K. G., Wagenaar R. C., LaFiandra M. E., Kubo M., Obusek J. P. (2003). Increased musculoskeletal stiffness during load carriage at increasing walking speeds maintains constant vertical excursion of the body center of mass. J. Biomech. 36, 465-471 [DOI] [PubMed] [Google Scholar]
- Knapik J., Harman E., Reynolds K. (1996). Load carriage using packs: a review of physiological, biomechanical and medical aspects. Appl. Ergon. 27, 207-216 [DOI] [PubMed] [Google Scholar]
- Kuo A. D. (2002). Energetics of actively powered locomotion using the simplest walking model. J. Biomech. Eng. 124, 113-120 [DOI] [PubMed] [Google Scholar]
- Kuo A. D., Donelan J. M., Ruina A. (2005). Energetic consequences of walking like an inverted pendulum: step-to-step transitions. Exerc. Sport Sci. Rev. 33, 88-97 [DOI] [PubMed] [Google Scholar]
- Margaria R. (1976). Biomechanics and Energetics of Muscular Exercise. Oxford: Clarendon Press; [Google Scholar]
- Martin P. E., Nelson R. C. (1986). The effect of carried loads on the walking patterns of men and women. Ergonomics 29, 1191-1202 [DOI] [PubMed] [Google Scholar]
- O'Connor S. M., Xu H. Z., Kuo A. D. (2012). Energetic cost of walking with increased step variability. Gait Posture 36, 102-107 [DOI] [PMC free article] [PubMed] [Google Scholar]
- Pierrynowsi M. R., Norman R. W., Winter D. A. (1981). Mechanical energy analyses of the human during local carriage on a treadmill. Ergonomics 24, 1-14 [DOI] [PubMed] [Google Scholar]
- Quesada P. M., Mengelkoch L. J., Hale R. C., Simon S. R. (2000). Biomechanical and metabolic effects of varying backpack loading on simulated marching. Ergonomics 43, 293-309 [DOI] [PubMed] [Google Scholar]
- Soule R. G., Pandolf K. B., Goldman R. F. (1978). Energy expenditure of heavy load carriage. Ergonomics 21, 373-381 [DOI] [PubMed] [Google Scholar]
- Stuempfle K. J., Drury D. G., Wilson A. L. (2004). Effect of load position on physiological and perceptual responses during load carriage with an internal frame backpack. Ergonomics 47, 784-789 [DOI] [PubMed] [Google Scholar]
- Taylor C. R., Heglund N. C., McMahon T. A., Looney T. R. (1980). Energetic cost of generating muscular force during running: a comparison of large and small animals. J. Exp. Biol. 86, 9-18 [Google Scholar]
- Tilbury-Davis D. C., Hooper R. H. (1999). The kinetic and kinematic effects of increasing load carriage upon the lower limb. Hum. Mov. Sci. 18, 693-700 [Google Scholar]
- Winter D. A. (2005). Biomechanics and Motor Control of Human Movement. Hoboken, NJ: John Wiley and Sons, Inc. [Google Scholar]
- Zelik K. E., Kuo A. D. (2010). Human walking isn't all hard work: evidence of soft tissue contributions to energy dissipation and return. J. Exp. Biol. 213, 4257-4264 [DOI] [PMC free article] [PubMed] [Google Scholar]
- Zelik K. E., Kuo A. D. (2012). Mechanical work as an indirect measure of subjective costs influencing human movement. PLoS ONE 7, e31143 [DOI] [PMC free article] [PubMed] [Google Scholar]