

Summary
In addition to their promise in regenerative medicine, pluripotent stem cells have proved to be faithful models of many human diseases. In particular, patient-specific stem cell-derived cardiomyocytes recapitulate key features of several life-threatening cardiac arrhythmia syndromes. For both modeling and regenerative approaches, phenotyping of stem cell-derived tissues is critical. Cellular phenotyping has largely relied upon expression of lineage markers rather than physiologic attributes. This is especially true for cardiomyocytes, in part because electrophysiological recordings are labor intensive. Likewise, most optical voltage indicators suffer from phototoxicity, which damages cells and degrades signal quality. Here we present the use of a genetically encoded fluorescent voltage indicator, ArcLight, which we demonstrate can faithfully report transmembrane potentials in human stem cell-derived cardiomyocytes. We demonstrate the application of this fluorescent sensor in high-throughput, serial phenotyping of differentiating cardiomyocyte populations and in screening for drug-induced cardiotoxicity.
Graphical Abstract

Highlights
-
•
Genetic introduction of a fluorescent voltage sensor into hESC-derived cardiomyocytes
-
•
High-throughput electrophysiological analysis of hESC-derived cardiomyocytes
-
•
Demonstration of potential of a fluorescent voltage reporter in drug screening assays
A challenge in realizing the potential of stem cell-derived cardiomyocytes as arrhythmia disease models is the labor-intensive nature of electrophysiological recording. This work by Milan and colleagues explores the utility of a genetically encoded fluorescent voltage sensor, which reliably reports transmembrane potential changes in pluripotent stem cell-derived cardiomyocytes. Optical recordings provide a nondestructive approach to physiologic, high-throughput cellular phenotyping.
Introduction
A major advance in disease modeling has been the demonstration that human induced pluripotent stem cell technology can faithfully recapitulate many human diseases, including cardiac arrhythmia syndromes (Kim et al., 2013; Matsa et al., 2011; Roden and Hong, 2013). For cardiac diseases, there is interest in applying these models to large-scale screens for novel therapeutics or drug toxicities; however, efforts have been frustrated by the labor-intensive nature of conventional electrophysiological recordings (Mercola et al., 2013). Optical mapping with voltage indicators is an alternative, yet voltage-sensitive dyes, such as ANEPPS dyes, have inherent phototoxicity that limits the recording time and can degrade signal quality (Herron et al., 2012).
The field of genetically encoded voltage probes is rapidly evolving. Arch(D95N) (Kralj et al., 2012) is photostable and highly voltage sensitive, but in absolute terms is 100–1,000 times dimmer than GFP, necessitating the use of advanced imaging techniques. More recently, a novel voltage indicator, ArcLight, was developed by fusing the voltage-sensing domain of the Ciona intestinalis voltage-sensitive phosphatase to a super ecliptic pHluorin carrying the point mutation A227D (Cao et al., 2013; Jin et al., 2012).
Although ArcLight probes have limited frequency responses, they still may be suitable for monitoring cardiac action potentials (APs). Here, we demonstrate the use of A242-ArcLight (ArcLight) to noninvasively report APs from human embryonic stem cell-derived cardiomyocytes (hESC-CMs). We demonstrate the utility of ArcLight for characterizing hESC-CMs by reporting AP durations (APDs) over a broad range. In addition, ArcLight allows accurate recognition of early afterdepolarizations (EADs), as well as CM subtypes. Comparison with simultaneous patch-clamp recordings reveals consistent but relatively small errors due to the temporal response of this protein voltage reporter.
Results
Fluorescence Measurement of APs in hESC-CMs
ArcLight expression in H7 hESC-CMs resulted in robust optical signals (Figure 1A) that were visible to the naked eye even in single isolated cells (Movie S1 available online). AP morphology, a functional marker of CM subtype, was readily recognized, permitting identification of atrial, nodal, and ventricular AP morphologies (Figure 1B). Fluorescent signals were remarkably photostable, permitting prolonged recording over minutes of continuous illumination (Figures S1A and S1B). In contrast, recordings from di-8-ANEPPS-loaded hESC-CMs displayed phototoxicity after several gated 6 s recordings (Figure S1C). Compared with patch-clamp electrophysiology, fluorescence data were rapidly acquired and APs from multiple cells in a single field could be simultaneously recorded (Figure 1C), permitting recordings from over 440 single hESC-CMs and small groups (<5 cells) in 1 day. This throughput allowed characterization of large cell populations by APD and morphology (Figures S1D–S1F).
Figure 1.
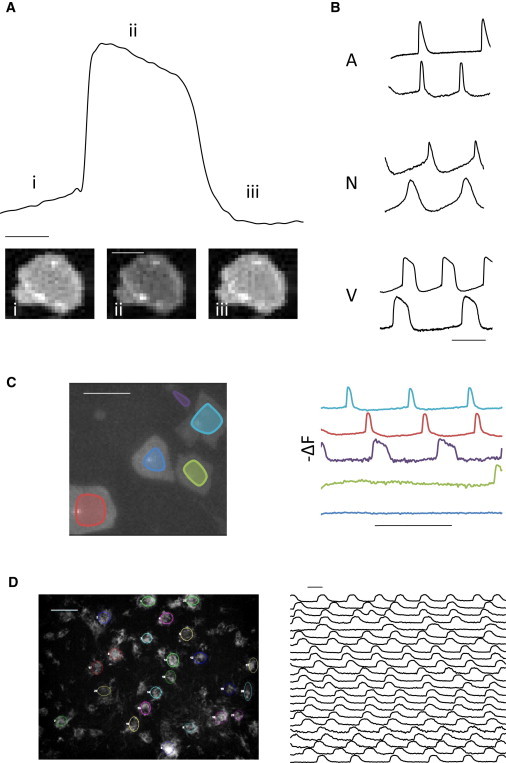
Rapid and Simultaneous Recording of APs in hESC-CMs
(A) Representative ArcLight fluorescence tracing from a single isolated hESC-CM with three images corresponding to (i) phase 4, (ii) plateau phase 2, and (iii) phase 4. Trace bar equals 200 ms. Scale bar, 50 μm (image).
(B) Representative fluorescence traces depicting typical atrial, nodal, and ventricular AP morphologies. Scale bar, 1 s.
(C) Still-frame image of several single ArcLight expressing hESC-CMs and corresponding simultaneous fluorescence traces. Scale bars, 100 μm (image) and 2 s (trace).
(D) Differentiating clusters of ArcLight-expressing hESC-CMs on day 19 with selected fluorescence recordings. Scale bars, 400 μm (image) and 500 ms (trace).
See also Figure S1.
In addition to direct lentiviral transduction of differentiated CMs, we also introduced the ArcLight construct at the ESC stage, with a mean proviral integration of ∼7.5 copies/cell. Under a CAG promoter, ArcLight expression rose upon cardiac differentiation within the transduced population as well as in subsequently derived clonal lines, and persisted through months of culture (Orbán et al., 2009). This enabled serial monitoring of composite APs during CM differentiation while preserving the integrity and sterility of the cell culture (Figure 1D; Movie S2).
Accuracy in Reporting Transmembrane Potentials
We compared ArcLight fluorescence with simultaneous patch-clamp recordings in hESC-CMs (Figure 2A). The morphological characteristics of cardiac APs were well resolved, albeit with some loss of high-frequency components. Fluorescent measurements of APD90 showed a linear correlation with simultaneous current-clamp values with a consistent overestimation of ∼62 ms over a broad range of APDs (R2 = 0.86; Figure 2B). Likewise, optical measurements of APD90 also correlated closely to AP voltage-clamp commands corresponding to human ventricular APDs cycling at frequencies from 1 to 6 Hz (R2 = 0.99; Figure S2A; Lou et al., 2012). Voltage-clamp step commands were used to record fluorescence response over a range of voltages (Figure 2C). While the fluorescence voltage relationship was sigmoidal (R2 = 0.994; Figures S2B and S2C), a linear approximation was operative from –60 mV to 20 mV, with an 18.52% change per 100 mV (R2 = 0.991, reference −90 mV; Figure 2D). Spanning this range of potentials, the fluorescent signal/noise ratio was 22.35 ± 2.74 dB. Consistent with prior reports (Jin et al., 2012), the temporal response was biexponential (Figure 2E), with τdepol,1 = 15.64 ± 1.33 ms and τdepol,2 = 86.15 ± 12.32 ms, and relative amplitudes Adepol,1:Adepol,2 = 1.06 ± 0.17. The repolarization constants were τrepol,1 = 15.78 ± 1.82 ms and τrepol,2 = 112.71 ± 18.59 ms, with relative amplitudes Arepol,1:Arepol,2 = 4.93 ± 0.77. To assess whether ArcLight expression affects the electrophysiological properties of the cells, we compared APDs measured using current-clamp recordings from wild-type cells with fluorescent recordings from ArcLight-transduced cells. No significant differences were observed, although this experiment was limited by the inherent cellular heterogeneity of hESC-CMs (Figure S2C; p = 0.9).
Figure 2.
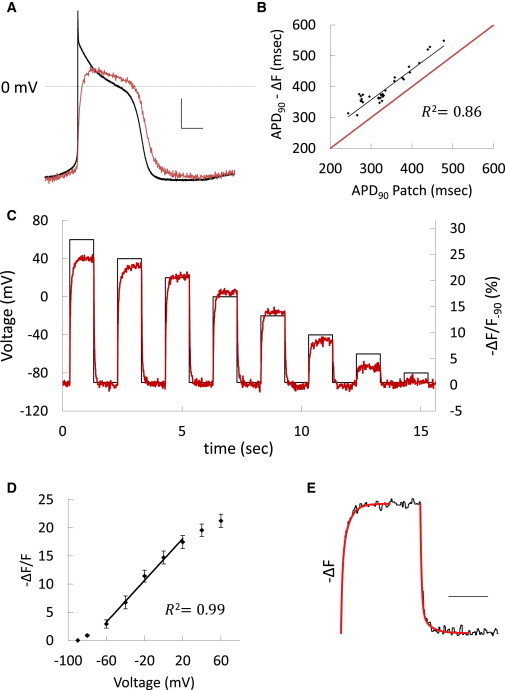
Accuracy of ArcLight Reporting of Transmembrane Potential Changes
(A) Unfiltered fluorescence recording (red) overlaid on a simultaneous current-clamp recording (black) during a spontaneous AP in an hESC-CM. Scale bars, 20 mV and 100 ms.
(B) Fluorescence measurement of APD90 plotted against APD90 measured by simultaneous current-clamp recordings with the best-fit line shown in black. The red line represents unity.
(C) Fluorescence (red) from an ArcLight-expressing hESC-CM and concurrent voltage-clamp protocol (black).
(D) Fluorescence-voltage relationship derived from five cells using the clamp protocol in (C). Data are mean ± SEM. Linear regression is shown for potentials from 60 mV to 20 mV.
(E) Fitted biexponential time constants (red) overlaid on a representative fluorescence response to a voltage step of −90 mV to 60 mV in an ArcLight-expressing hESC-CM. Scale bar, 500 ms.
See also Figure S2.
Serial Imaging of Differentiating CMs
A major obstacle to stem cell disease modeling and regenerative applications is the difficulty of obtaining mature and phenotypically homogeneous cell populations. Serial phenotyping during ongoing cellular differentiation might provide valuable information for overcoming this barrier. During cardiac differentiation, some ArcLight-transduced hESCs were treated with all-trans retinoic acid (ATRA) on days 5–8 of differentiation, which has been reported to promote an atrial phenotype (Zhang et al., 2011). On day 25 and again on day 40, >100 CM clusters were imaged. On day 25, ATRA-treated CMs displayed shorter APD90 compared with untreated cells (416 ± 147 ms versus 509 ± 120 ms, p < 0.001; Figure S3A). AP plateaus, measured as APD20/APD90, were also decreased in ATRA-treated hESC-CMs relative to untreated cells (0.41 ± 0.09 versus 0.54 ± 0.10, 24% reduction, p < 0.001; Figure S3B). At day 40, these differences were more pronounced (Figures 3B and 3C), with shorter mean APD90 in ATRA-treated cells versus controls (152 ± 59 ms versus 268 ± 70 ms, p < 0.001) and a smaller mean APD20/APD90 ratio (0.44 ± 0.08 versus 0.66 ± 0.08, p < 0.001). In order to assess the susceptibility of these recordings to motion artifact, we used cell clusters, which are more prone to motion artifacts than individual cells. A comparison of recordings before and after treatment with 20 μM blebbistatin revealed no statistically significant change in APD90 measurements, suggesting that the effects of motion artifact are limited in this setting (p = 0.918; Figure S3C).
Figure 3.

Serial Phenotyping of Differentiating CM Populations
(A) Fluorescence traces from differentiating hESC-CM clusters on days 25 and 40, treated and untreated with 1 μmol/L ATRA during days 5–8 (untreated: day 25, n = 106, day 40, n = 86; retinoic acid: day 25, n = 26, day 40, n = 30).
(B and C) APD90 (B) and APD20/APD90 (C) measurements from fluorescence waveforms in untreated and ATRA-treated hESC-CM clusters on day 40.
See also Figure S3.
Rapid Evaluation of Drug-Induced Repolarization Toxicity
We then tested the ability of the ArcLight fluorescent transmembrane voltage reporter to resolve electrophysiological changes after application of dofetilide, a blocker of the rapid component of the delayed rectifier current (IKr). Dofetilide prolongs the cardiac AP and can be proarrhythmic at high doses (Roden, 2004). Compared with simultaneous current-clamp recordings, fluorescence recordings from ArcLight-transduced cells faithfully reported AP prolongation and EADs (Figure 4A). Dofetilide treatment of hESC-CM clusters increased the mean APD90 (449 ± 170 ms versus 268 ± 70 ms, p < 0.001, n = 85; Figure 4B). Paired recordings showed that dofetilide mediated increases in APD90 (Figure 4C). Dofetilide effects were greatest at cycle lengths greater than 700 ms (Figure 4D), consistent with the recognized reverse use dependence of IKr blockers (Roden, 2004). In addition to APD prolongation, optical recordings reported APD shortening in hESC-CMs field paced at 1.5 Hz following application of pinacidil (Figure S4A), an opener of the ATP-sensitive K+ current (IK,ATP), which was previously reported to shorten APD in human induced pluripotent stem cell-derived CMs (Itzhaki et al., 2011). Consistent with prior work (Tang et al., 2012), pinacidil-mediated shortening was more pronounced during early repolarization, with APD20, APD50, APD80, and APD90 decreasing by 25.2% ± 16.8%, 23.3% ± 14.3%, 15.4% ± 12.2%, and 9.6% ± 10.1%, respectively (p ≤ 0.001 for all, n = 18; Figure S4B). We also investigated the capacity of ArcLight fluorescence to resolve changes in upstroke velocity by applying 3 μmol/L tetrodotoxin (TTX), a dose that was previously demonstrated to prolong the diastolic interval and decrease dV/dtmax by ∼50% in hESC-CMs (Satin et al., 2004). Predictably, based on the temporal response of the reporter (Figure 2E), d(−F)/dtmax was unaltered after TTX treatment, although we did observe prolongation of the diastolic interval (Figures S4C–S4E; p = 0.83).
Figure 4.
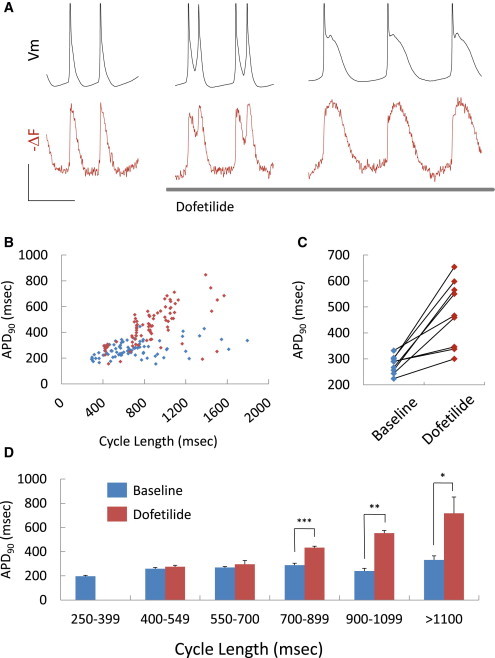
Rapid Evaluation of Drug-Induced Repolarization Toxicity
(A) Current-clamp (black) and simultaneous fluorescence tracing (red) from an ArcLight-expressing hESC-CM before and after exposure to 20 nmol/L dofetilide. EADs and APD prolongation are seen in both recordings. Scale bars, 20 mV and 1 s.
(B) APD90 and cycle length measurements from fluorescent tracings of hESC-CM clusters before and after 20 nmol/L dofetilide (n = 86 before and after).
(C) Paired APD90 measurement from nine hESC-CM clusters before and after 20 nmol/L dofetilide.
(D) Analysis by cycle length of APD90 estimates in (B). Error bars represent SEM. ∗p = 0.03, ∗∗p = 0.002, ∗∗∗p < 0.001.
See also Figure S4.
Discussion
We have demonstrated a method to obtain fluorescent recordings of transmembrane potential changes in hESC-CMs with an approximately linear relationship over a broad range of potentials. Recent years have seen dramatic improvements in stem cell culture methods (Chen et al., 2011; Schinzel et al., 2011); however, similar improvements in phenotyping have not always followed. The optical measurements described here provide much higher throughput than traditional techniques and should streamline cellular phenotyping.
There is ongoing interest in identifying methods to encourage CM maturation (Kim et al., 2013; Lieu et al., 2013). The ArcLight fluorescent reporter allows noninvasive and nondestructive phenotyping of an entire hESC-CM population over multiple time points. In our example, treatment with ATRA during days 5–8 resulted in relatively minor differences at day 25, but by day 40 the differences were much more robust, emphasizing the value of serial recordings.
One of the most common causes of postmarket drug withdrawal has been drug-induced QT prolongation and torsade de pointes, which remains difficult to predict in the preclinical setting (Roden, 2004). Although there is enthusiasm for hESC-CM models of cardiotoxicity (Roden and Hong, 2013), cellular heterogeneity and the challenges of high-throughput cellular electrophysiology have limited their widespread application. The fluorescent method described here is amenable to high-throughput screening, and the ability to perform serial measurements could permit each cell to serve as its own control.
There are several limitations to this technology. Fluorescence signals report relative, not absolute, membrane potentials. The temporal response results in loss of high-frequency elements and leads to a small but systematic overestimation of APD. A comparison of ArcLight and the ANEPPS dyes (Herron et al., 2012) reveals certain trade-offs. Although genetic manipulation may not always be practical, once it is genetically introduced, ArcLight requires no further cellular manipulation, which may provide advantages for delicate cellular preparations. Another difference is the lower phototoxicity of ArcLight compared with di-4-ANEPPS and di-8-ANEPPS, which enables longer-duration and serial recordings. The signal/noise ratios measured in this work are comparable to those measured with the newer voltage-sensitive dye di-4-ANBDQBS in ventricular myocytes, using a similar method of calculation (Warren et al., 2010). A final difference is the frequency response of these two probes: the ANEPPS dyes have a clear advantage for applications that require a fast temporal response. It should be noted that in this study, we could not rule out the possibility that ArcLight expression had small effects on the electrophysiology of the cells.
In conclusion, phenotyping of hESC-CMs with ArcLight provides a robust means to noninvasively characterize and quantify changes in cellular electrophysiology. This facile tool will find use in studies that require rapid characterization of cell populations, such as efforts to understand the cues for CM differentiation, as well as in screening for cardiotoxicity and novel therapeutics.
Experimental Procedures
Molecular Biology
A242-ArcLight cDNA (Addgene plasmid 36857) was used for transient transfection (Jin et al., 2012). cDNA was PCR amplified with the following primers:
Forward: 5′-GGGGACAAGTTTGTACAAAAAAGCAGGCTACCATGGAGGGATTCGACGGTTCAG-3′
Reverse: 5′-GGGGACCACTTTGTACAAGAAAGCTGGGTTCATTTGTATAGTTCATCCATGCCATG-3′
The resulting product was recombined into pDONR221 with BP Clonase (Invitrogen) and sequence verified. A cassette flanked by attR sites and encoding the ccdB and chloramphenicol resistance genes (Invitrogen) was cloned into the SmaI site of the lentiviral expression vector pLV-EF1a-MCS-IRES-mCherry-Neo (Biosettia). The EF1α promoter was then excised with BspDI and XbaI digestion, and replaced by the CAG promoter from psPAX2 (Addgene plasmid 12260) (Zufferey et al., 1997) following digestion with SalI and EcoRI, and ligation of the following adapters:
5′ adaptor: 5′- CGATCCCGGGCTCGAGG-3′ annealed to 5′-Pi-TCGACCTCGAGCCCGGGAT-3′
3′ adaptor: 5′-Pi-AATTCTTCGAAGCGATCGCG-3′ annealed to 5′-CTAGCGCGATCGCTTCGAAG-3′
A242-ArcLight within pDONR221 was recombined with LR Clonase (Invitrogen) into the resulting destination vector to create pLV-CAG-ArcLight. A CMV-driven lentiviral construct was created by recombining A242-ArcLight into pLenti-CMV-Puro-DEST to create pLenti-CMV-ArcLight (Addgene plasmid 17452) (Campeau et al., 2009).
hESC Culture and CM Differentiation
The H7 hESC line (WA07; WiCell) was maintained in feeder-free culture in Essential 8 medium (Chen et al., 2011) on Geltrex extracellular matrix (Invitrogen). Differentiation to the CM lineage was performed by combining an extracellular matrix sandwich using an overlay of a 1:100 dilution of Geltrex at the onset of differentiation (day 0), analogous to techniques previously reported (Zhang et al., 2012), along with temporal modulation of canonical Wnt signaling as previously described (Lian et al., 2012). When indicated, 1 μmol/L ATRA (Sigma) was supplemented between days 5 and 8. CMs between days 30 and 90 were dissociated by mechanically isolating contracting cell clusters and exposing them to three to six successive 5–7 min treatments with 0.25% Trypsin-EDTA (GIBCO). Dissociated cells were collected between treatments, centrifuged, resuspended in Dulbecco’s modified Eagle’s medium with 20% fetal bovine serum (GIBCO), and plated onto Geltrex-coated glass coverslips. RPMI 1640 medium with B27 supplement (Invitrogen) was overlaid 24 hr later and replaced approximately every 3 days. Cells were permitted to recover for 48 hr prior to further manipulation.
Transient Transfection of hESC-CMs
Lipofectamine LTX (Invitrogen) was used for transient transfection of dissociated hESC-CMs. Cells were imaged 24–48 hr posttransfection. The data represented in Figure 4A were acquired in pilot experiments by transient transfection. Because it provided decreased toxicity, better efficiency of gene transfer, and stable expression levels, lentiviral transduction was favored for all subsequent experiments and is represented in all other data shown.
Lentiviral Production and Transduction
Lentiviral vectors were packaged in human embryonic kidney 293 (HEK293) cells by cotransfection using Lipofectamine LTX with psPAX2 (Addgene plasmid 12260) (Zufferey et al., 1997) and pCMV-VSV-G (Addgene plasmid 8454) (Stewart et al., 2003). Lentivirus-containing supernatants were harvested at 48 and 72 hr posttransfection, passaged through 0.45 μm filters (Nalgene), and concentrated using PEG-it (System Biosciences). Dissociated H7 hESC-CMs were transduced with pLenti-CMV-ArcLight lentivirus for 48–72 hr and imaged 3–5 days after the onset of transduction (data in Figures 1A–1C and all of Figures 2, S1, S2, and S4). H7 hESCs were transduced with pLV-CAG-ArcLight lentivirus for 16 hr in the presence of 6 μg/ml polybrene (Sigma). After 72 hr, the medium was supplemented with 300 μg/ml G418 (GIBCO) to select an expressing population (data from subsequently derived hESC-CM clusters are represented in Figures 1D and 4B–4D, and all of Figures 3 and S3). Clonal lines were derived by further enriching for ArcLight-expressing cells by fluorescence-activated cell sorting with a fluorescein isothiocyanate (FITC) filter. Cells were plated at low density (∼200 cells/cm2) and cultured in the presence of 10 μmol/L Y-27632 (Santa Cruz) to obtain isolated colonies. Those exhibiting homogeneous FITC fluorescence were expanded further. Proviral integration copy number was measured by quantitative PCR with the Lenti-X Provirus Quantitation kit (Clontech).
Fluorescence Microscopy
Cells were imaged in a bath chamber or culture dish at 37°C in a bath solution identical to that used for electrophysiology recordings, with a Nikon Eclipse Ti-U inverted microscope, a Nikon CFI S Fluor 10× objective (NA 0.5, WD 1.2 mm), and a NeuroCCDSM camera (RedShirtImaging). An FITC filter set (excitation: HQ480, mirror: Q505LP, emission: HQ535/50 m; Chroma) was used for ArcLight fluorescence measurements, and a customized set (excitation: Omega Optical 525QM45, mirror: Chroma 565 dcxr, emission: Chroma HQ635LP) was used for di-8-ANEPPS. An X-Cite exacte mercury arc lamp (Lumen Dynamics) was used for illumination and typically set at 70%–100% output. Images were recorded at 500 or 1,000 frames per second. Movie S2 was recorded with an ORCA-Flash2.8 camera (Hamamatsu). Where indicated, 20 μmol/L blebbistatin was applied to hESC-CM clusters for 30 min. Di-8-ANEPPS was loaded at 5 μmol/l for 20 min at 37°C and washed with bath solution prior to immediate imaging (Hardy et al., 2006). For drug experiments with dissociated hESC-CMs, bath solutions containing TTX, dofetilide, or pinacidil (all Sigma) were perfused into the bath chamber prior to imaging and electrophysiological recordings. For the cell-cluster experiments depicted in Figures 4B–4D, dofetilide was added to the culture medium for 30 min and exchanged for bath solution containing dofetilide just prior to imaging. Where stated, AP firing frequency was controlled by field pacing using an RC-49MFSH perfusion chamber (Warner Instruments) and S48 Stimulator (Grass Products).
Electrophysiology
Electrophysiological recordings were performed with a ruptured patch whole-cell configuration at 37°C (TC-344B heater controller; Warner Instruments). The bath solution contained (mmol/L) 140 NaCl, 5.4 KCl, 1.8 CaCl2, 1 MgCl2, 10 HEPES, 10 glucose, pH 7.4 with NaOH, and the pipette solution contained 120 K-aspartate, 20 KCl, 1.8 CaCl2, 5 Mg-ATP, 5 NaCl, 10 HEPES, 5 EGTA, pH 7.3 with KOH (all Sigma). Fire-polished patch electrodes had 2–5 MΩ resistance. Recordings were low-pass filtered at 5 kHz with an Axopatch 200B amplifier and digitized at 10 kHz with a Digidata 1440A A/D converter, both controlled with Clampex software (Axon Instruments). Voltage-clamp step recordings were performed with a clamp at −90 mV followed by 1 s depolarizing steps to 60, 40, 20, 0, −20, −40, −60, and −80 mV, with 1 s recoveries at −90 mV between steps. AP voltage-clamp commands were designed based on previously measured human ventricular APDs at various cycle lengths (Lou et al., 2012).
Data Processing
NeuroPlex software (RedShirtImaging) was used to view image sequences and output darkfield-corrected mean fluorescence from regions of interest. Optical recordings were inverted and low-pass filtered at 100 Hz or, where stated, reported as unfiltered traces. Fluorophore photobleaching was subtracted using a custom program. −ΔF/F90 from voltage step commands was calculated by dividing the mean steady-state fluorescence responses by the mean fluorescence at −90 mV. Double exponentials of probe dynamics were fit using Clampfit software (Axon Instruments). The signal/noise ratio was calculated by dividing the difference in mean steady-state fluorescence values recorded at −60 mV and 20 mV by the root-mean-square of the mean-subtracted steady-state fluorescence signal. APDX was calculated to be the time interval between when signals reached 50% of the difference in fluorescence between the initiation and maximal height of an upstroke, and x% of the return to diastolic baseline. d(−F)/dtmax was computed as the maximal instantaneous change in fluorescence normalized to the difference in fluorescence between the initiation and maximal height of the upstroke. Statistical comparisons of d(−F)/dtmax and APD90 patch versus APD90 optical were made by using Student’s two-tailed t test. Those of APDX before and after pinacidil were made using a paired two-tailed t test. All other statistical comparisons of APD90 and APD20/APD90 were made using the Mann-Whitney rank sum test.
Acknowledgments
This work was supported by the Corrigan Minehan Foundation (D.J.M.), the Harvard Stem Cell Institute (D.J.M.), the NIH (grants R01HL109004 to D.J.M.; R01HL092577, R01HL104156, and 1K24HL105780 to P.T.E.; and T32HL007208 to J.L.M. and R.W.M.), the American Heart Association (grant 13EIA14220013 to P.T.E.), and the Heart Rhythm Society (V.S.M.).
Footnotes
This is an open-access article distributed under the terms of the Creative Commons Attribution-NonCommercial-No Derivative Works License, which permits non-commercial use, distribution, and reproduction in any medium, provided the original author and source are credited.
Supplemental Information
References
- Campeau E., Ruhl V.E., Rodier F., Smith C.L., Rahmberg B.L., Fuss J.O., Campisi J., Yaswen P., Cooper P.K., Kaufman P.D. A versatile viral system for expression and depletion of proteins in mammalian cells. PLoS ONE. 2009;4:e6529. doi: 10.1371/journal.pone.0006529. [DOI] [PMC free article] [PubMed] [Google Scholar]
- Cao G., Platisa J., Pieribone V.A., Raccuglia D., Kunst M., Nitabach M.N. Genetically targeted optical electrophysiology in intact neural circuits. Cell. 2013;154:904–913. doi: 10.1016/j.cell.2013.07.027. [DOI] [PMC free article] [PubMed] [Google Scholar]
- Chen G., Gulbranson D.R., Hou Z., Bolin J.M., Ruotti V., Probasco M.D., Smuga-Otto K., Howden S.E., Diol N.R., Propson N.E. Chemically defined conditions for human iPSC derivation and culture. Nat. Methods. 2011;8:424–429. doi: 10.1038/nmeth.1593. [DOI] [PMC free article] [PubMed] [Google Scholar]
- Hardy M.E., Lawrence C.L., Standen N.B., Rodrigo G.C. Can optical recordings of membrane potential be used to screen for drug-induced action potential prolongation in single cardiac myocytes? J. Pharmacol. Toxicol. Methods. 2006;54:173–182. doi: 10.1016/j.vascn.2006.02.013. [DOI] [PubMed] [Google Scholar]
- Herron T.J., Lee P., Jalife J. Optical imaging of voltage and calcium in cardiac cells & tissues. Circ. Res. 2012;110:609–623. doi: 10.1161/CIRCRESAHA.111.247494. [DOI] [PMC free article] [PubMed] [Google Scholar]
- Itzhaki I., Maizels L., Huber I., Zwi-Dantsis L., Caspi O., Winterstern A., Feldman O., Gepstein A., Arbel G., Hammerman H. Modelling the long QT syndrome with induced pluripotent stem cells. Nature. 2011;471:225–229. doi: 10.1038/nature09747. [DOI] [PubMed] [Google Scholar]
- Jin L., Han Z., Platisa J., Wooltorton J.R., Cohen L.B., Pieribone V.A. Single action potentials and subthreshold electrical events imaged in neurons with a fluorescent protein voltage probe. Neuron. 2012;75:779–785. doi: 10.1016/j.neuron.2012.06.040. [DOI] [PMC free article] [PubMed] [Google Scholar]
- Kim C., Wong J., Wen J., Wang S., Wang C., Spiering S., Kan N.G., Forcales S., Puri P.L., Leone T.C. Studying arrhythmogenic right ventricular dysplasia with patient-specific iPSCs. Nature. 2013;494:105–110. doi: 10.1038/nature11799. [DOI] [PMC free article] [PubMed] [Google Scholar]
- Kralj J.M., Douglass A.D., Hochbaum D.R., Maclaurin D., Cohen A.E. Optical recording of action potentials in mammalian neurons using a microbial rhodopsin. Nat. Methods. 2012;9:90–95. doi: 10.1038/nmeth.1782. [DOI] [PMC free article] [PubMed] [Google Scholar]
- Lian X., Hsiao C., Wilson G., Zhu K., Hazeltine L.B., Azarin S.M., Raval K.K., Zhang J., Kamp T.J., Palecek S.P. Robust cardiomyocyte differentiation from human pluripotent stem cells via temporal modulation of canonical Wnt signaling. Proc. Natl. Acad. Sci. USA. 2012;109:E1848–E1857. doi: 10.1073/pnas.1200250109. [DOI] [PMC free article] [PubMed] [Google Scholar]
- Lieu D.K., Fu J.D., Chiamvimonvat N., Tung K.C., McNerney G.P., Huser T., Keller G., Kong C.W., Li R.A. Mechanism-based facilitated maturation of human pluripotent stem cell-derived cardiomyocytes. Circ. Arrhythm. Electrophysiol. 2013;6:191–201. doi: 10.1161/CIRCEP.111.973420. [DOI] [PMC free article] [PubMed] [Google Scholar]
- Lou Q., Janks D.L., Holzem K.M., Lang D., Onal B., Ambrosi C.M., Fedorov V.V., Wang I.W., Efimov I.R. Right ventricular arrhythmogenesis in failing human heart: the role of conduction and repolarization remodeling. Am. J. Physiol. Heart Circ. Physiol. 2012;303:H1426–H1434. doi: 10.1152/ajpheart.00457.2012. [DOI] [PMC free article] [PubMed] [Google Scholar]
- Matsa E., Rajamohan D., Dick E., Young L., Mellor I., Staniforth A., Denning C. Drug evaluation in cardiomyocytes derived from human induced pluripotent stem cells carrying a long QT syndrome type 2 mutation. Eur. Heart J. 2011;32:952–962. doi: 10.1093/eurheartj/ehr073. [DOI] [PMC free article] [PubMed] [Google Scholar]
- Mercola M., Colas A., Willems E. Induced pluripotent stem cells in cardiovascular drug discovery. Circ. Res. 2013;112:534–548. doi: 10.1161/CIRCRESAHA.111.250266. [DOI] [PMC free article] [PubMed] [Google Scholar]
- Orbán T.I., Apáti A., Németh A., Varga N., Krizsik V., Schamberger A., Szebényi K., Erdei Z., Várady G., Karászi E. Applying a “double-feature” promoter to identify cardiomyocytes differentiated from human embryonic stem cells following transposon-based gene delivery. Stem Cells. 2009;27:1077–1087. doi: 10.1002/stem.45. [DOI] [PubMed] [Google Scholar]
- Roden D.M. Drug-induced prolongation of the QT interval. N. Engl. J. Med. 2004;350:1013–1022. doi: 10.1056/NEJMra032426. [DOI] [PubMed] [Google Scholar]
- Roden D.M., Hong C.C. Stem cell-derived cardiomyocytes as a tool for studying proarrhythmia: a better canary in the coal mine? Circulation. 2013;127:1641–1643. doi: 10.1161/CIRCULATIONAHA.113.002127. [DOI] [PMC free article] [PubMed] [Google Scholar]
- Satin J., Kehat I., Caspi O., Huber I., Arbel G., Itzhaki I., Magyar J., Schroder E.A., Perlman I., Gepstein L. Mechanism of spontaneous excitability in human embryonic stem cell derived cardiomyocytes. J. Physiol. 2004;559:479–496. doi: 10.1113/jphysiol.2004.068213. [DOI] [PMC free article] [PubMed] [Google Scholar]
- Schinzel R.T., Ahfeldt T., Lau F.H., Lee Y.K., Cowley A., Shen T., Peters D., Lum D.H., Cowan C.A. Efficient culturing and genetic manipulation of human pluripotent stem cells. PLoS ONE. 2011;6:e27495. doi: 10.1371/journal.pone.0027495. [DOI] [PMC free article] [PubMed] [Google Scholar]
- Stewart S.A., Dykxhoorn D.M., Palliser D., Mizuno H., Yu E.Y., An D.S., Sabatini D.M., Chen I.S., Hahn W.C., Sharp P.A. Lentivirus-delivered stable gene silencing by RNAi in primary cells. RNA. 2003;9:493–501. doi: 10.1261/rna.2192803. [DOI] [PMC free article] [PubMed] [Google Scholar]
- Tang L., Joung B., Ogawa M., Chen P.S., Lin S.F. Intracellular calcium dynamics, shortened action potential duration, and late-phase 3 early afterdepolarization in Langendorff-perfused rabbit ventricles. J. Cardiovasc. Electrophysiol. 2012;23:1364–1371. doi: 10.1111/j.1540-8167.2012.02400.x. [DOI] [PMC free article] [PubMed] [Google Scholar]
- Warren M., Spitzer K.W., Steadman B.W., Rees T.D., Venable P., Taylor T., Shibayama J., Yan P., Wuskell J.P., Loew L.M., Zaitsev A.V. High-precision recording of the action potential in isolated cardiomyocytes using the near-infrared fluorescent dye di-4-ANBDQBS. Am. J. Physiol. Heart Circ. Physiol. 2010;299:H1271–H1281. doi: 10.1152/ajpheart.00248.2010. [DOI] [PMC free article] [PubMed] [Google Scholar]
- Zhang Q., Jiang J., Han P., Yuan Q., Zhang J., Zhang X., Xu Y., Cao H., Meng Q., Chen L. Direct differentiation of atrial and ventricular myocytes from human embryonic stem cells by alternating retinoid signals. Cell Res. 2011;21:579–587. doi: 10.1038/cr.2010.163. [DOI] [PMC free article] [PubMed] [Google Scholar]
- Zhang J., Klos M., Wilson G.F., Herman A.M., Lian X., Raval K.K., Barron M.R., Hou L., Soerens A.G., Yu J. Extracellular matrix promotes highly efficient cardiac differentiation of human pluripotent stem cells: the matrix sandwich method. Circ. Res. 2012;111:1125–1136. doi: 10.1161/CIRCRESAHA.112.273144. [DOI] [PMC free article] [PubMed] [Google Scholar]
- Zufferey R., Nagy D., Mandel R.J., Naldini L., Trono D. Multiply attenuated lentiviral vector achieves efficient gene delivery in vivo. Nat. Biotechnol. 1997;15:871–875. doi: 10.1038/nbt0997-871. [DOI] [PubMed] [Google Scholar]
Associated Data
This section collects any data citations, data availability statements, or supplementary materials included in this article.