

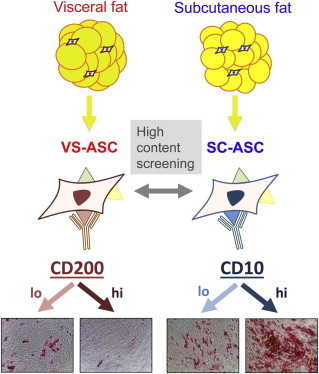
Summary
Adipose-derived stem/stromal cells (ASCs) from the anatomically distinct subcutaneous and visceral depots of white adipose tissue (WAT) differ in their inherent properties. However, little is known about the molecular identity and definitive markers of ASCs from these depots. In this study, ASCs from subcutaneous fat (SC-ASCs) and visceral fat (VS-ASCs) of omental region were isolated and studied. High-content image screening of over 240 cell-surface markers identified several potential depot-specific markers of ASCs. Subsequent studies revealed consistent predominant expression of CD10 in SC-ASCs and CD200 in VS-ASCs across 12 human subjects and in mice. CD10-high-expressing cells sorted from SC-ASCs differentiated better than their CD10-low-expressing counterparts, whereas CD200-low VS-ASCs differentiated better than CD200-high VS-ASCs. The expression of CD10 and CD200 is thus depot-dependent and associates with adipogenic capacities. These markers will offer a valuable tool for tracking and screening of depot-specific stem cell populations.
Graphical Abstract
Highlights
-
•
Cell-surface markers were comprehensively screened for subcutaneous and visceral ASCs
-
•
CD10 is specifically expressed in subcutaneous fat-depot-derived ASCs
-
•
CD200 is predominantly expressed in visceral fat-depot-derived ASCs
-
•
CD10 shows positive whereas CD200 negative correlation with adipogenic capacity
Little is known about the molecular identity and definitive markers of adipose-derived stem cells (ASCs) from pathophysiologically distinct subcutaneous and visceral fat depots. Through high-content image screening, Sugii and colleagues identified CD10 as subcutaneous-specific and CD200 as visceral-selective ASC markers. Their expression levels are correlated with ASC’s adipogenic capacities, implicating their potential use for tracking and screening of depot-specific cells.
Introduction
White adipose tissue (WAT) has been increasingly appreciated as an alternative source of mesenchymal stem cells (MSCs) traditionally isolated from the bone marrow. Subcutaneous WAT can be isolated by minimally invasive liposuction procedure. Additionally, adipose-derived stem/stromal cells (ASCs) are relatively abundant in the WAT where as much as 1% of human adipose cells are ASCs as compared to only 0.001%–0.002% MSCs in the bone marrow (Fraser et al., 2006). The differentiation capacity, immunobiological properties, and secretome of ASCs offer tremendous therapeutic potential in regenerative medicine (Ong and Sugii, 2013).
By the convention of the International Society for Cellular Therapy (ISCT), MSCs from various sources, including ASC, are defined as being (1) plastic-adherent in the standard cell-culture condition; (2) multipotent, i.e., able to differentiate into osteoblasts, adipocytes, and chondrocytes in vitro; and (3) positive for CD73, CD90, and CD105 and negative for CD11b or CD14, CD19 or CD79α, CD34, CD45, and HLA-DR in their cell-surface immunophenotype (Dominici et al., 2006). In addition, the recent revised statement of ISCT and International Federation for Adipose Therapeutics and Science (IFATS) suggests additional markers for ASCs, which are positive for CD36 and negative for CD106, compared to bone-marrow MSCs (Bourin et al., 2013). Thus, it is beginning to be recognized that MSCs from different origins may have different cell-surface marker expression, but few studies have analyzed their expression differences in a comprehensive manner.
Increasing evidence suggests that ASCs derived from WAT of different depot origins are distinct populations of cells that differ in their inherent properties (Macotela et al., 2012; Tchkonia et al., 2005, 2006). A notable functional difference is that subcutaneous fat ASCs (SC-ASCs) proliferate at a higher rate and differentiate better than visceral fat ASCs (VS-ASCs) in response to in vitro adipogenic stimuli (Macotela et al., 2012; Tchkonia et al., 2005). The functional difference of SC- and VS-ASCs together with regional variation in cellular interaction, circulation, innervations, and anatomic constraints in the SC and VS depots of WAT are thought to be the underlying factors contributing to pathophysiological variation of these two WAT depots in relation to metabolic homeostasis (Tchkonia et al., 2007, 2013). The SC depot physiologically stores excess lipids thus preventing their deposition into other organs. Accumulation of fat in the VS depot, on the other hand, leads to pathological metabolic profile because of dysfunction in lipid storage (Després and Lemieux, 2006). Differences in these properties are at least partly cell autonomous and recapitulated in vitro in ASCs isolated from these depots (Tchkonia et al., 2013).
Further characterization of SC-ASCs and VS-ASCs is necessary to understand their pathophysiological roles in metabolism and therapeutic relevance in regenerative medicine. However, the definitive markers and molecular identity of ASCs from the two fat depots remain obscure to date. This limitation would hamper our future efforts from tracking and screening for distinct populations of stem cells that are destined to become different fat depots. This study aims to address this fundamental question about ASCs from SC and VS depots of WAT by identifying depot-specific ASC cell-surface markers.
Results
High-Content Screening of Cell-Surface Markers Identifies Potential Subcutaneous-Specific CD10 and Visceral-Specific CD200 ASC Markers
In order to study molecular-marker differences of stem cell populations of different depots, stromal vascular fractions (SVF) of SC and VS fat depots were isolated and ASCs were enriched by serial passage culture of SVF. These ASCs were confirmed for their multipotency by osteogenesis and chondrogenesis assays (Figure S1A available online). SC-ASCs and VS-ASCs were subjected to in vitro standard adipogenic differentiation cocktail (insulin, dexamethasone, and isobutylmethylxanthine [IBMX]). As previously reported (Macotela et al., 2012; Tchkonia et al., 2005), SC-ASCs underwent robust adipogenesis whereas VS-ASCs were relatively resistant to the adipogenic stimuli as revealed by Oil Red O staining (Figure S1B). This trend of adipogenic-sensitive SC-ASCs and adipogenic-resistant VS-ASCs persisted at all the time points even when the standard adipogenesis cocktail was augmented with indomethacin, a strong inducer of adipogenesis by potently activating PPARγ, a master regulator of adipogenesis. We hypothesized that intrinsic differences in their molecular properties leading to the phenotypic variation of SC-ASCs and VS-ASCs should be reflected by differences in the expression of their cell-surface markers.
We took an approach consisting of three stages to identify depot-specific ASC markers (Figure 1A). First, a high-content screening assay of 242 human cell-surface markers was performed on five cell lines: cultured SC-ASC from subject 1 (S1), VS-ASCs from S1 and commercially obtained SC-ASC, together with bone marrow (BM)-derived MSC and human foreskin fibroblast (HFF-1) as controls. This was followed by the second stage where additional experiments including immunostaining assays were performed for further verification of selected candidate markers in the cell lines used in the first stage plus additional ones derived from two other subjects. At the final stage, a total of 12 human subjects, along with normal lean and obese mice, were investigated for determination of specific markers by experimental analyses such as flow cytometry and quantitative polymerase chain reaction (qPCR). Details of selection criteria and markers selected as well as statistical consideration are summarized in Supplemental Information and Tables S3 and S4.
Figure 1.
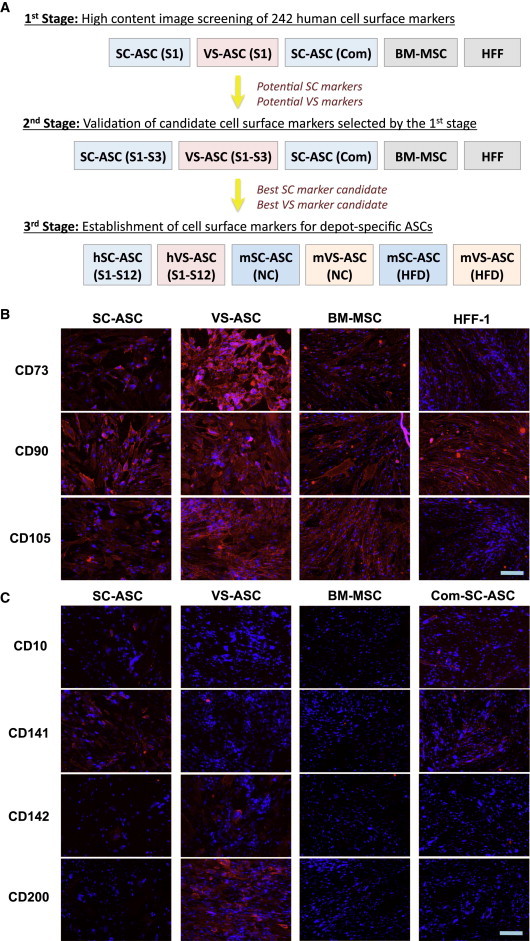
High-Content Screening of ASCs for Potential Depot-Specific Cell-Surface Markers
(A) Strategy for screening and identification of cell-surface markers.
(B) Representative fluorescence images of S1-derived SC-ASC and VS-ASC immunostained with conventional MSC markers (CD73, CD90, and CD105). BM-MSC and HFF-1 were intended as controls.
(C) Representative fluorescence images that suggested depot-specific expression of CD10 and CD141 in SC-ASCs (S1 and commercial source) and that of CD142 and CD200 in VS-ASCs (S1). The cells were first stained with primary antibodies from the BD Lyoplate Human Cell Surface Marker Screening Panel and then with Alexa-Fluor-647-conjugated secondary antibody (red). The nuclei of all viable cells were counterstained with Hoechst 33342 (blue). The scale bar represents 200 μm. The fluorescence raw images for all other markers with at least one positive signal from the Lyoplate screening can be obtained upon request.
See also Figure S1.
As expected, both SC- and VS-ASCs of S1 as well as BM-MSC were positively immunostained with the conventional MSC markers, CD73, CD90, and CD105, in the high-content image screening (Figure 1B). However, the negative control HFF-1 was also stained positively to some extent, especially for CD90, illustrating some limitations of existing markers. Based on the fluorescence intensity analyzed using image analysis software and visual confirmation, cell-surface-marker candidates that showed differential immunofluorescence signals between SC- and VS-ASCs in the high-content screening were selected for further studies. Fluorescence analyses of all the markers with at least one positive signal are described in Tables S3 and S4. Examples of these included CD10 and CD141 as potential SC-ASC markers, whereas CD142 and CD200 were selected as potential VS-ASC markers (Figure 1C).
Follow-up immunofluorescence studies were performed independently to study the expression of selected cell-surface-marker candidates across S1–S3 as well as commercial SC-ASC, BM-MSC, and HFF-1. Predominant expression of CD10 in SC-ASCs and CD200 in VS-ASCs were consistent across S1–S3 (Figure S2). On the other hand, CD141, for example, was found to be predominantly expressed in SC-ASCs in S1, but not in S2 or S3. Similarly, CD142 was predominantly expressed in VS-ASCs in S1 and S2, but not in S3 (Figure S2). Variations were also found in other cell-surface markers, consistent with the recent report of heterogeneities in surface-marker expression among individual SC-ASCs (Baer et al., 2013). Therefore, we excluded heterogeneous markers such as CD141 and CD142 and selected CD10 and CD200 for further studies.
mRNA and Protein Expression of CD10 and CD200
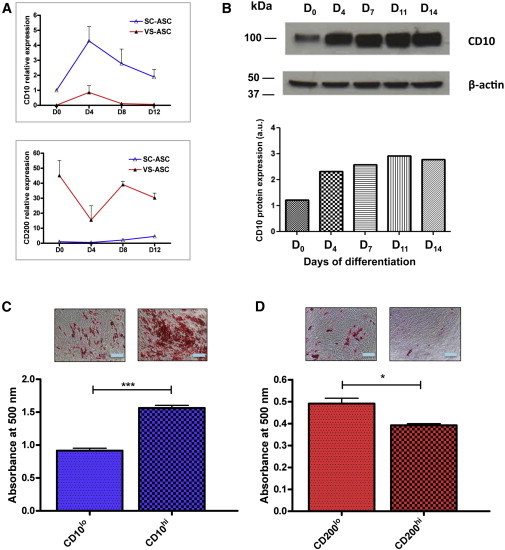
Real-time qPCR showed that the mRNA expression of CD10 was consistently higher in the SC-ASCs relative to VS-ASCs, whereas CD200 was consistently lower in the SC-ASCs relative to VS-ASCs across S1–S6 (Figure 2A). This was complemented by protein expression analysis using western blotting of CD10 (Figure 2B).
Figure 2.
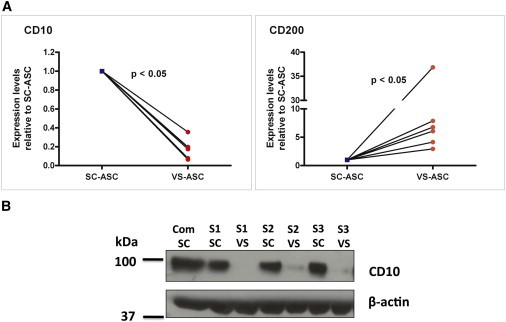
mRNA and Protein Expression Profiles of CD10 and CD200 in SC- and VS-ASCs across Subjects
(A) qPCR data that show the relative expression level of CD10 and CD200 between SC-ASCs (expression level normalized as 1) and VS-ASCs across S1–S6. The value of each subject is the mean from three technical replicates from a qPCR reaction. Statistical significance was assessed across the six independent subjects by using Wilcoxon signed-rank test.
(B) Western blot analysis that shows the protein expression of CD10 between SC-ASCs and VS-ASCs across S1–S3 and in commercial SC-ASCs. The protein expression of CD200 was not shown due to unavailability of antibody with satisfactory quality for western blotting.
See also Figure S2.
In order to examine whether these potential depot-specific markers were valid in another species, we investigated expression of Cd10 and Cd200 in mouse. C57BL6/J mice were either fed normal chow (NC) or high fat diet (HFD) to induce obesity. The body weight was 39.9 ± 0.83 g for NC and 60.0 ± 0.95 g for HFD mice (n = 5). As epididymal and mesenteric fat depots, instead of omental fat, are major visceral fat found in mice, we isolated visceral ASCs from epididymal and mesenteric fat depots and subcutaneous ASCs from inguinal fat depot in these animals. The qPCR analysis indicated that Cd10 was predominantly expressed in ASCs from subcutaneous fat, whereas Cd200 was highly expressed in ASCs from visceral (epididymal and mesenteric) fat in both NC- and HFD-fed mice (Figure S3A). This result suggests that the depot-dependant expression pattern of CD10 and CD200 holds true in mouse species and that the diet intervention does not affect this differential expression pattern between depots.
Flow cytometry analysis was performed to study the subpopulation composition of the cultured ASCs. As control, both the SC- and VS-ASCs of all subjects expressed the conventional MSC markers by this analysis (Figure 3A). Flow cytometry showed significantly predominant expression of CD10 by SC-ASCs (CD10+ SC-ASCs: mean 50.6% [range of 17.9%–83.5% across S1 to S12] versus CD10+ VS-ASCs: mean 1.0% [0.1%–5.4%]; Figures 3B and 3D). Similarly, significantly higher expression of CD200 by VS-ASCs (CD200+ SC-ASCs: mean 24.0% [0.9%–56.3%] versus CD200+ VS-ASCs: mean 80.0% [43.3%–98.5%]) was observed (Figures 3C and 3E). These results further established CD10 as a SC-ASC-specific marker and CD200 as a VS-ASC-enriched marker. Similar differential expression patterns were also observed for SVF (passage 0), which is less processed and composed of heterogeneous cell populations (Figure S3B). It was previously reported that properties of MSCs can be affected by differences in culture condition such as serum and glucose concentrations (Sotiropoulou et al., 2006). We addressed whether different fetal bovine serum (FBS) and glucose concentrations have any effects on expression of CD10 and CD200. As is shown in Figure S3C, glucose concentration did not affect CD10 and CD200 expression of SC-ASCs and VS-ASCs, though only CD10+ SC-ASCs seemed to moderately increase in medium with 10% FBS compared to 15% FBS. In any case, depot specificity was preserved regardless of FBS or glucose.
Figure 3.
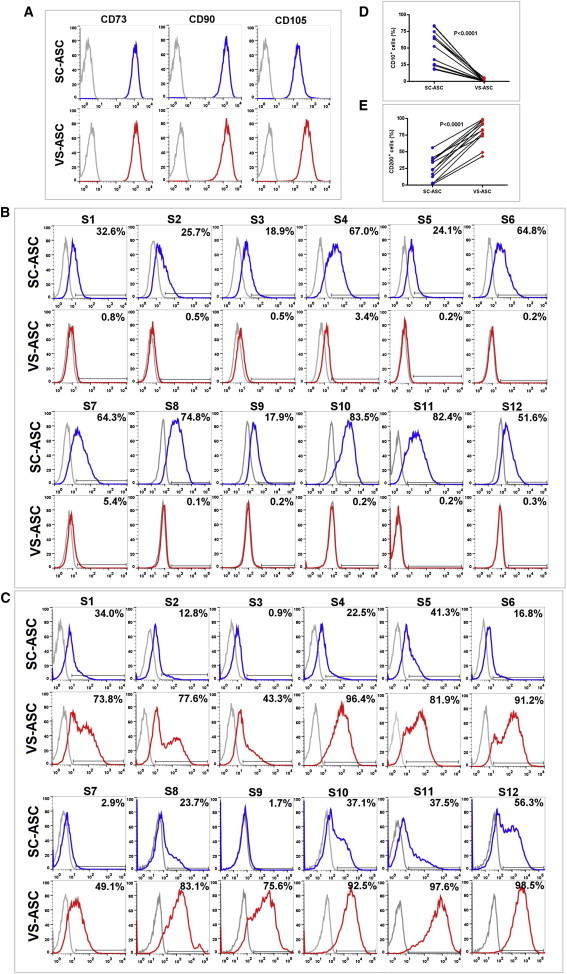
Flow Cytometry Analysis of SC- and VS-ASC Populations
(A) Both the SC- and VS-ASCs of all subjects expressed the conventional MSC markers (represented by S1).
(B) Histograms showing CD10-expressing cell populations were almost exclusively found in the SC-ASCs across S1–S12.
(C) Histograms showing CD200-expressing cell populations were predominantly found in the VS-ASCs across S1–S12.
(D) Line graph showing CD10-expressing cell populations were almost exclusively found in the SC-ASCs across S1–S12.
(E) Line graph showing CD200-expressing cell populations were predominantly found in the VS-ASCs across S1–S12.
Histograms: Relative cell count is indicated in y axis, and fluorescence intensity, FITC (B), or Alexa Fluor 647 (A and C) is indicated in x axis. Grey line represents “unstained control,” and the percentage of positively stained cells is as indicated. For (D) and (E), statistical significance was assessed across the 12 independent subjects by using paired Student’s t test. See also Figure S3.
Expression Levels of CD10 and CD200 during Adipogenesis
As described above, SC-ASCs differentiate better into mature adipocytes than VS-ASCs by the standard in vitro adipogenesis protocol. In order to investigate the expression changes of CD10 and CD200 during adipogenesis, qPCR was performed in differentiating SC-ASCs and VS-ASCs. The mRNA expression level of CD10 increased after adipogenic stimuli, and this increase positively correlated with those of adipogenic markers, PPARG and aP2 (Figures 4A and S4A). In contrast, the CD200 level decreased after adipogenesis was initiated and exhibited a negative correlation with adipogenic markers (Figure 4A and S4A). Increase of CD10 during adipogenesis of SC-ASCs was also confirmed at the protein level by western blot (Figure 4B).
Figure 4.
Correlation of CD10- and CD200-Expression Levels and Adipogenesis
(A) SC-ASCs differentiated better than their VS-ASC counterparts into adipocytes in response to standard adipogenic stimulation. Adipogenesis of ASCs were induced with the standard adipogenic cocktail plus indomethacin for D0–D4, followed by maintenance medium with insulin alone (D4–D12). The mRNA expression level of CD10 positively correlated with induction of adipogenesis as determined by qPCR. On the other hand, a negative correlation was observed for CD200 (data represented by S6). Each value is the mean ± SEM from two independent experiments. See also Figure S4A.
(B) Western blot showed increased CD10 protein expression in response to adipogenic stimulation. The densitometry of CD10, measured by ImageJ software, was normalized against β-actin as a loading control (represented by commercial SC-ASCs). a.u., arbitrary units.
(C) CD10hi cells sorted from SC-ASCs differentiated better than their CD10lo counterparts. Data are represented by S4, with similar results obtained in other subjects.
(D) CD200lo cells sorted from VS-ASCs differentiated better than the CD200hi counterparts. Data are represented by S2, with similar results by other cells.
The scale bars represent 200 μm (C and D). Each value is the mean ± SEM from three independent wells from one cell preparation. Statistical significance was assessed by using Student’s t test: ∗∗∗p < 0.001, ∗∗p < 0.01, ∗p < 0.05. See also Figures S4B–S4E.
Adipogenic Potential of ASC Subpopulations Expressing High or Low Level of CD10 or CD200
The results above led us to postulate that SC-ASC-specific CD10 may mark cell populations with higher adipogenic capacities, whereas VS-ASC-selective CD200 may mark those with less adipogenic capacities, which are consistent with intrinsic properties of respective ASCs. In order to test our hypothesis, we sorted SC-ASCs into two populations: CD10-high-expressing (CD10hi) and CD10-low-expressing (CD10lo) cells (Figure S4B). Similarly, VS-ASCs were sorted into CD200-high-expressing (CD200hi) and CD200-low-expressing (CD200lo) cells (Figure S4C). These populations were subjected to the standard in vitro adipogenic induction. The result indicated that CD10hi cells sorted from SC-ASCs differentiate significantly better than their CD10lo counterparts as revealed by Oil Red O staining and absorbance reading of its extracted solvents (Figure 4C). Conversely, CD200lo cells sorted from VS-ASCs were found to differentiate significantly better than the CD200hi counterparts (Figure 4D). These data suggest that CD10 is a prospective marker for high adipogenic potential, whereas CD200 is a predictive marker for low adipogenic capacity.
Discussion
We have demonstrated herein that CD10 and CD200 show consistent differential expression profiles between SC- and VS-ASCs. The expression levels of these markers correlate with adipogenic capacities, i.e., positive correlation of CD10 and negative correlation of CD200 with adipogenic potential. Thus, CD10 and CD200 may be used as prospective markers. Despite importance of cell-surface markers to identify and track stem cells including MSCs and ASCs and known pathophysiological differences between subcutaneous and visceral fat depots, few previous studies have comprehensively examined differences of surface-marker expression in the depot-specific manner. Identification of these depot-specific markers will allow us to differentially isolate, visualize, and characterize ASCs in the depot-specific manner.
Previous cell-surface-marker analyses were performed on SC-ASCs, which are easily and routinely obtained by liposuction procedure. In those studies, flow cytometry analyses of preselected cell-surface proteins indicate that SC-ASCs share many cell-surface-marker expressions with BM-MSCs (Gronthos et al., 2001; Katz et al., 2005). A recent study using high-throughput screening of cell-surface markers in SC-ASCs reported significant heterogeneity in their expression of many markers among five subjects (Baer et al., 2013). Lack of control samples, however, made it difficult to assess the degree of variation compared to other cell types among individuals. Whereas we have also noted significant heterogeneities in expression of many cell-surface markers, we found that expression of CD10 and CD200 in ASCs are clearly distinguished from that of BM-MSCs, which express these at much lower levels, and that their depot-specific differences are consistent across human subjects and mice.
CD10 (also known as neprilysin, neutral endopeptidase, enkephalinase, and common acute lymphoblastic leukemia antigen) is a cell-surface metallopeptidase that inactivates a number of signaling substrates (Maguer-Satta et al., 2011). It was previously reported that CD10 is a cell-surface marker of mammary stem cells and that sorting by CD10 enriches sphere-forming stem/progenitor populations (Bachelard-Cascales et al., 2010). In fact, a recent statement defining ASC markers by IFATS and ISCT listed CD10 as a possible ASC-specific marker relative to BM-MSC (Bourin et al., 2013). However, these ASCs were presumably derived from subcutaneous fat depots. Our study indicates that ASCs from visceral depots would not express CD10 in contrast to commonly studied ASCs from subcutaneous depots. CD200, also called OX2, is a member of the immunoglobulin superfamily of proteins, whose biological function is unclear but implicated in multiple immunoregulatory activities of myeloid and other immune cell types (Gorczynski et al., 2004). One study noted high CD200 expression in MSCs isolated from Wharton’s jelly compared to BM-MSCs and (presumably subcutaneous) ASCs (Najar et al., 2012). These authors hypothesized that the inflammatory environment of Wharton’s jelly contributed to higher MSC expression of CD200. Visceral fat depot is thought to have similar inflammatory conditions (Mathis, 2013) and may result in abundant expression of CD200. Interestingly, CD200 was identified as a marker to enrich endocrine cell populations derived from human embryonic stem cells in order to isolate pancreatic progenitor lineages (Kelly et al., 2011). This may indicate an endocrine origin of visceral fat-derived cells. Future studies may be directed at determining the functional relevance of these molecules in regulating adipogenesis.
Experimental Procedures
Further details of each procedure are found in Supplemental Information.
Isolation and Culture of ASCs
WAT was isolated from the subcutaneous (abdominal region) and visceral (omental region) depots from 12 human obese volunteers (S1–S12) undergoing bariatric surgery (Table S1), with approval by the Domain Specific Review Board at National Healthcare Group, Singapore. ASCs were then isolated and cultured, as described previously (Sugii et al., 2011).
Adipogenesis and Oil Red O Staining
Two days after reaching confluency, cells were induced with adipogenic cocktail containing 1 μM dexamethasone, 0.5 mM IBMX, and 167 nM insulin plus 100 μM indomethacin. On D4, cells were switched to medium with 167 nM insulin and maintained until at least D12. The cells were then fixed and stained with Oil Red O solution. Stained lipids were extracted by isopropanol and absorbance of extracted solution measured at 500 nm.
High-Content Screening
High-content screening assay of 242 human cell-surface markers was performed using BD Lyoplate Human Cell Surface Marker Screening Panel (BD Biosciences) and ImageXpress Micro (Molecular Devices). Fluorescence intensity was analyzed by MetaXpress cellular image analysis software and visual confirmation.
Mouse Studies
Thirty-nine-week-old male C57BL6/J mice were fed either with normal chow or high fat diet for 27 weeks (five mice each). Inguinal (subcutaneous), epididymal, and mesenteric fat depots were harvested and ASCs isolated. This animal work was approved by the Institutional Animal Care and Use Committee of Biological Resource Centre, Singapore.
Real-Time qPCR
Total RNA was extracted using Trizol reagent (Invitrogen) and treated with DNase I. cDNA conversion was made by the RevertAid H minus first strand cDNA synthesis kit (Fermentas). qPCR was performed using the SYBR Green PCR Master Mix on a StepOnePlus Real-Time PCR System (Applied Biosystems) using the primer pairs shown in Table S2. Relative mRNA levels were calculated and normalized to that of GAPDH/Gapdh.
Immunoblot Analysis
Cell lysates (20 μg) were loaded into 10% SDS-PAGE gels and blotted by the iBlot Dry Blotting System (Invitrogen). Membranes were blocked and probed with primary antibodies overnight at 4°C, followed by horseradish peroxidase-conjugated secondary antibodies for 1 hr at room temperature.
Flow Cytometry and Cell Sorting
ASCs (passage number > 2) were tripsinized and suspended in staining buffer (Dulbecco’s modified Eagle’s medium without phenol red with 2% FBS) for immunostaining. The cells were incubated for 30 min on ice, either directly with a fluorochrome-conjugated antibody or with an unconjugated primary antibody followed by an appropriate secondary antibody conjugated with fluorochrome. The stained cells were washed and suspended in sorting buffer (PBS with 0.5% BSA and 2 mM EDTA) before analysis by flow cytometry (LSRII; BD Biosciences). Cells were processed in a similar manner for sorting by Moflo XDP Cell Sorter (Beckman Coulter).
Statistical Analysis
Results are presented as means ± SEM. The Student’s t test or Wilcoxon signed-rank test was used where appropriate to determine differences in the mean or median between two groups. Statistical consideration for the three-stage approach is described in Supplemental Information.
Acknowledgments
We thank members of Laboratory of Metabolic Medicine, Laboratory of Bioimaging Probe Development, Singapore Bioimaging Consortium-Nikon Imaging Centre, Biopolis Shared Facility Flow Cytometry Unit, and Toh’s lab at National University of Singapore for helping our research activities. S.S. is a cofounder of LipoStation Pte., Ltd., which has had no financial or scientific influence on this study. This work is supported by an intramural funding from Biomedical Research Council of Agency for Science, Technology and Research (A∗STAR) to W.H. and S.S. and funding from the Singapore National Medical Research Council to S.-A.T.
Footnotes
This is an open-access article distributed under the terms of the Creative Commons Attribution-NonCommercial-No Derivative Works License, which permits non-commercial use, distribution, and reproduction in any medium, provided the original author and source are credited.
Supplemental Information
References
- Bachelard-Cascales E., Chapellier M., Delay E., Pochon G., Voeltzel T., Puisieux A., Caron de Fromentel C., Maguer-Satta V. The CD10 enzyme is a key player to identify and regulate human mammary stem cells. Stem Cells. 2010;28:1081–1088. doi: 10.1002/stem.435. [DOI] [PubMed] [Google Scholar]
- Baer P.C., Kuçi S., Krause M., Kuçi Z., Zielen S., Geiger H., Bader P., Schubert R. Comprehensive phenotypic characterization of human adipose-derived stromal/stem cells and their subsets by a high throughput technology. Stem Cells Dev. 2013;22:330–339. doi: 10.1089/scd.2012.0346. [DOI] [PubMed] [Google Scholar]
- Bourin P., Bunnell B.A., Casteilla L., Dominici M., Katz A.J., March K.L., Redl H., Rubin J.P., Yoshimura K., Gimble J.M. Stromal cells from the adipose tissue-derived stromal vascular fraction and culture expanded adipose tissue-derived stromal/stem cells: a joint statement of the International Federation for Adipose Therapeutics and Science (IFATS) and the International Society for Cellular Therapy (ISCT) Cytotherapy. 2013;15:641–648. doi: 10.1016/j.jcyt.2013.02.006. [DOI] [PMC free article] [PubMed] [Google Scholar]
- Després J.P., Lemieux I. Abdominal obesity and metabolic syndrome. Nature. 2006;444:881–887. doi: 10.1038/nature05488. [DOI] [PubMed] [Google Scholar]
- Dominici M., Le Blanc K., Mueller I., Slaper-Cortenbach I., Marini F., Krause D., Deans R., Keating A., Prockop Dj., Horwitz E. Minimal criteria for defining multipotent mesenchymal stromal cells. The International Society for Cellular Therapy position statement. Cytotherapy. 2006;8:315–317. doi: 10.1080/14653240600855905. [DOI] [PubMed] [Google Scholar]
- Fraser J.K., Wulur I., Alfonso Z., Hedrick M.H. Fat tissue: an underappreciated source of stem cells for biotechnology. Trends Biotechnol. 2006;24:150–154. doi: 10.1016/j.tibtech.2006.01.010. [DOI] [PubMed] [Google Scholar]
- Gorczynski R., Chen Z., Kai Y., Lee L., Wong S., Marsden P.A. CD200 is a ligand for all members of the CD200R family of immunoregulatory molecules. J. Immunol. 2004;172:7744–7749. doi: 10.4049/jimmunol.172.12.7744. [DOI] [PubMed] [Google Scholar]
- Gronthos S., Franklin D.M., Leddy H.A., Robey P.G., Storms R.W., Gimble J.M. Surface protein characterization of human adipose tissue-derived stromal cells. J. Cell. Physiol. 2001;189:54–63. doi: 10.1002/jcp.1138. [DOI] [PubMed] [Google Scholar]
- Katz A.J., Tholpady A., Tholpady S.S., Shang H., Ogle R.C. Cell surface and transcriptional characterization of human adipose-derived adherent stromal (hADAS) cells. Stem Cells. 2005;23:412–423. doi: 10.1634/stemcells.2004-0021. [DOI] [PubMed] [Google Scholar]
- Kelly O.G., Chan M.Y., Martinson L.A., Kadoya K., Ostertag T.M., Ross K.G., Richardson M., Carpenter M.K., D’Amour K.A., Kroon E. Cell-surface markers for the isolation of pancreatic cell types derived from human embryonic stem cells. Nat. Biotechnol. 2011;29:750–756. doi: 10.1038/nbt.1931. [DOI] [PubMed] [Google Scholar]
- Macotela Y., Emanuelli B., Mori M.A., Gesta S., Schulz T.J., Tseng Y.H., Kahn C.R. Intrinsic differences in adipocyte precursor cells from different white fat depots. Diabetes. 2012;61:1691–1699. doi: 10.2337/db11-1753. [DOI] [PMC free article] [PubMed] [Google Scholar]
- Maguer-Satta V., Besançon R., Bachelard-Cascales E. Concise review: neutral endopeptidase (CD10): a multifaceted environment actor in stem cells, physiological mechanisms, and cancer. Stem Cells. 2011;29:389–396. doi: 10.1002/stem.592. [DOI] [PubMed] [Google Scholar]
- Mathis D. Immunological goings-on in visceral adipose tissue. Cell Metab. 2013;17:851–859. doi: 10.1016/j.cmet.2013.05.008. [DOI] [PMC free article] [PubMed] [Google Scholar]
- Najar M., Raicevic G., Jebbawi F., De Bruyn C., Meuleman N., Bron D., Toungouz M., Lagneaux L. Characterization and functionality of the CD200-CD200R system during mesenchymal stromal cell interactions with T-lymphocytes. Immunol. Lett. 2012;146:50–56. doi: 10.1016/j.imlet.2012.04.017. [DOI] [PubMed] [Google Scholar]
- Ong W.K., Sugii S. Adipose-derived stem cells: fatty potentials for therapy. Int. J. Biochem. Cell Biol. 2013;45:1083–1086. doi: 10.1016/j.biocel.2013.02.013. [DOI] [PubMed] [Google Scholar]
- Sotiropoulou P.A., Perez S.A., Salagianni M., Baxevanis C.N., Papamichail M. Characterization of the optimal culture conditions for clinical scale production of human mesenchymal stem cells. Stem Cells. 2006;24:462–471. doi: 10.1634/stemcells.2004-0331. [DOI] [PubMed] [Google Scholar]
- Sugii S., Kida Y., Berggren W.T., Evans R.M. Feeder-dependent and feeder-independent iPS cell derivation from human and mouse adipose stem cells. Nat. Protoc. 2011;6:346–358. doi: 10.1038/nprot.2010.199. [DOI] [PMC free article] [PubMed] [Google Scholar]
- Tchkonia T., Tchoukalova Y.D., Giorgadze N., Pirtskhalava T., Karagiannides I., Forse R.A., Koo A., Stevenson M., Chinnappan D., Cartwright A. Abundance of two human preadipocyte subtypes with distinct capacities for replication, adipogenesis, and apoptosis varies among fat depots. Am. J. Physiol. Endocrinol. Metab. 2005;288:E267–E277. doi: 10.1152/ajpendo.00265.2004. [DOI] [PubMed] [Google Scholar]
- Tchkonia T., Giorgadze N., Pirtskhalava T., Thomou T., DePonte M., Koo A., Forse R.A., Chinnappan D., Martin-Ruiz C., von Zglinicki T., Kirkland J.L. Fat depot-specific characteristics are retained in strains derived from single human preadipocytes. Diabetes. 2006;55:2571–2578. doi: 10.2337/db06-0540. [DOI] [PubMed] [Google Scholar]
- Tchkonia T., Lenburg M., Thomou T., Giorgadze N., Frampton G., Pirtskhalava T., Cartwright A., Cartwright M., Flanagan J., Karagiannides I. Identification of depot-specific human fat cell progenitors through distinct expression profiles and developmental gene patterns. Am. J. Physiol. Endocrinol. Metab. 2007;292:E298–E307. doi: 10.1152/ajpendo.00202.2006. [DOI] [PubMed] [Google Scholar]
- Tchkonia T., Thomou T., Zhu Y., Karagiannides I., Pothoulakis C., Jensen M.D., Kirkland J.L. Mechanisms and metabolic implications of regional differences among fat depots. Cell Metab. 2013;17:644–656. doi: 10.1016/j.cmet.2013.03.008. [DOI] [PMC free article] [PubMed] [Google Scholar]
Associated Data
This section collects any data citations, data availability statements, or supplementary materials included in this article.