

Abstract
Purpose
Small-cell prostate carcinoma (SCPC) morphology predicts for a distinct clinical behavior, resistance to androgen ablation, and frequent but short responses to chemotherapy. We sought to develop model systems that reflect human SCPC and can improve our understanding of its biology.
Experimental Design
We developed a set of CRPC xenografts and examined their fidelity to their human tumors of origin. We compared the expression and genomic profiles of SCPC and large cell neuroendocrine carcinoma (LCNEC) xenografts to those of typical prostate adenocarcinoma xenografts. Results were validated immunohistochemically in a panel of 60 human tumors.
Results
The reported SCPC and LCNEC xenografts retain high fidelity to their human tumors of origin and are characterized by a marked upregulation of UBE2C and other mitotic genes in the absence of AR, retinoblastoma (RB1) and cyclin D1 (CCND1) expression. We confirmed these findings in a panel of CRPC patients' samples. In addition, array comparative genomic hybridization of the xenografts showed that the SCPC/LCNEC tumors display more copy number variations than the adenocarcinoma counterparts. Amplification of the UBE2C locus and microdeletions of RB1 were present in a subset, but none displayed AR nor CCND1 deletions. The AR, RB1, and CCND1 promoters showed no CpG methylation in the SCPC xenografts.
Conclusion
Modeling human prostate carcinoma with xenografts allows in-depth and detailed studies of its underlying biology. The detailed clinical annotation of the donor tumors enables associations of anticipated relevance to be made. Futures studies in the xenografts will address the functional significance of the findings.
Keywords: castration resistance prostate cancer, small cell neuroendocrine carcinoma, retinoblastoma, UBE2C, cyclin D1
Introduction
Small cell carcinoma morphology is often found on repeat biopsies during castrate-resistant prostate carcinoma (CRPC) progression(1-3). Its presence predicts for a course characterized by frequent visceral metastases, predominantly lytic bone lesions, and large prostatic or nodal masses, which is distinct from that of the typical bone-homing, hormone-responsive prostate carcinoma (PCa). Small-cell prostate carcinomas (SCPCs) do not express androgen receptor (AR) and thus do not respond to androgen ablation. They frequently respond to chemotherapy but responses are short and median survival stands at approximately 1 year(1-3). An understanding of the biology underlying this lethal subset of PCa is urgently needed, to identify an objective molecular signature and specific treatments that improve the outcome of afflicted men.
We previously characterized 8 SCPC and large-cell neuroendocrine (NE) carcinoma (LCNEC) xenograft tumor lines derived from a single patient's tumor(4). LCNEC is a rare morphologic variant belonging to the spectrum of poorly differentiated NEPCa(5-7). Expression analysis of various molecular markers revealed gradual changes in the donor tumor's different morphologic components, suggesting that SCPC and LCNEC are part of a biologic continuum. Although limited, because they were derived from a single patient's tissue, those initial findings provided a foundation to study the biology of poorly differentiated NEPCa(4). To obtain further insight into this biology we developed and characterized additional high-fidelity human CRPC tumors with and without SCPC/LCNEC morphology.
Loss of retinoblastoma (RB) function and upregulation of mitotic genes, including the UBE2C-anaphase promoting complex (APC) pathway, have recently been implicated in the progression to castration-resistance in PCa mediated by AR activity(8, 9). In the study reported here, we show that mitotic genes (including UBE2C) are markedly upregulated in SCPC and LCNEC xenografts, in the absence of AR, RB and cyclin D1 expression. Moreover, we demonstrate that these findings are mirrored in human CRPC tumors and thus show that these novel xenograft models share the biologic properties of the human disease and are suitable for the identification of candidate pathways that may drive SCPC/LCNEC biology. The parallel understanding of the functional relevance in murine systems and clinical cohorts should accelerate the development of candidate therapies for this lethal PCa variant.
Materials and Methods
Primary Donor Tumors and Xenografts
The xenograft models MDA PCa 79, 117, 130, 170, 180, 144, 146, and 155 were derived from the primary CRPCs (donor tumors) acquired during palliative surgical resections at The University of Texas MD Anderson Cancer Center from 8 patients who provided written informed consent (IC) on an IRB-approved protocol. Donor patients of xenografts 144 and 155 were enrolled in a clinical trial designed to test the chemotherapy sensitivity of CRPC with SCPC or with clinical features associated with SCPC, a clinical syndrome termed “anaplastic” PCa.(10)
Xenograft development is described in Supplementary Data. All animal experiments were approved by our Institutional Animal Care and Use Committee and conducted following accepted standards of care. In the case of MDA PCa 117, 170, 180, 144, 146, and 155, different tissue fragments were implanted in several different mice, resulting in the development of multiple sublines. Tumor samples from locations immediately adjacent to the samples used for implantation were processed for histopathologic and immunohistochemical (IHC) analyses.
Tissue sections from paraffin blocks of all xenograft lines and sublines were reviewed and representative blocks selected to construct a tissue microarray (TMA) containing 0.6-mm–diameter cores. Thirty-eight blocks (median, 2; range, 1–3 blocks/xenograft) were sampled, and 117 cores (median, 6; range, 3–9 cores/xenograft) were included in the “Xenograft TMA.”
Gene-expression Array
Gene expression was profiled as previously described (4). Briefly, total RNA was extracted using an RNeasy mini kit (Qiagen, Inc. Valencia, CA) from multiple tissue fragments of MDA PCa 79 (n = 3), 117-9 (n = 3), 130 (n = 2), 144-4 (n = 5), 144-13 (n = 5), 146-10 (n = 3), 155-2 (n = 1), and 155-12 (n = 1) tumors and submitted to the MD Anderson Genomics Core Facility for conversion to cDNA, labeling and hybridization to a U133A 2.0 Plus array (Affymetrix, Inc. Santa Clara, CA). The methods of data analysis and quantitative reverse-transcription PCR validation with SYBR Green are provided in Supplementary Data and Supplementary Table 1.
Human CRPC Sample Selection
We searched the tissue bank files of the MD Anderson Department of Pathology to identify surgically excised locally advanced CRPC samples from patients providing written IC allowing use of their tissue for research (n=46). We also included biopsy specimens of SCPCs with sufficient tissue for IHC analysis (n=14). In total, we studied 68 “clinical CRPC samples” obtained from 60 patients: 24 SCPCs/LCNECs and 44 prostatic adenocarcinomas (including the SCPC/LCNEC and adenocarcinoma components of 8 mixed cases) (Supplementary Data). Their clinicopathological history was extracted retrospectively from their medical records under an IRB-approved protocol.
IHC analyses
Tissue sections (4 μm) from the xenograft's donor tumors, TMAs, and biopsy specimens were subjected to IHC analyses, using an Autostainer Plus (Dako North America, Inc. Carpinteria, CA). Details of IHC procedures are presented in Supplementary Data and Supplementary Table 2. Chromogranin A and synaptophysin stains were considered positive if >5% of cells stained positively. For all other markers, the percentage of positive cells was calculated as the number of positively stained epithelial cells divided by the total number of epithelial cells, at X200 magnification. Owing to the limited tissue, biopsy specimens were only stained with anti-UBE2C, -cyclin D1, and -RB (Calbiochem) antibodies.
Array comparative genomic hybridization (aCGH) analysis
Genomic DNA was extracted from fresh-frozen xenograft specimens (1 each from MDA PCa 144-13, 144-4, 146-10, 155-2, 170-4, and 180-30) and from peripheral blood mononuclear cells (PBMC) from healthy male volunteers providing written IC by using standard proteinase K and phenol–chloroform methods. After quantification by A260 on a NanoDrop 1000 spectrophotometer (Thermo Fisher Scientific NanoDrop Products), 5 μg of genomic DNA per sample were submitted to our Genomics Core Facility, where tumor DNA was labeled with Cy3 and PBMC DNA with Cy5 dye, and cohybridized on a Human Genome CGH Microarray 244A (Agilent Technologies, Inc. Santa Clara CA). Quality control included correlation between reference channels, data distribution plots, and principal component analysis.
Quantitative Reverse-Transcription PCR, Flow Cytometry, Western Blot, Cell Line Culture and Pyrosequencing are described in Supplementary Data
Statistical analyses
Continuous data were summarized with descriptive statistics (i.e., mean with SD), and categorical data, with the use of contingency tables. Two-sample t-testing assessed for mean between-group differences in continuous variables, and chi-square testing, for differences in categorical-variable distributions. Pearson's rank correlation coefficient testing was used to assess correlation in expression between biomarkers. Cohen's kappa coefficient test was used to assess agreement amongst the RB antibodies. All P-value determinations were 2 sided at a 0.05 significance level. SPSS for Windows release 16.0 software was used for the analyses.
Gene-expression array analysis was previously described(4). Briefly, robust multichip analysis was used for data normalization and quantification. One-way ANOVA was applied to identify differently expressed genes. The beta uniform mixture model (11), false discovery rate (FDR), and Tukey's honestly significant difference were combined to adjust for multiple testing.
Analysis of aCGH was done using genomic segmentation, as implemented in the Partek Genomics Suite Version 6.5 (Partek Inc., St Luis, MO), and performed using the following parameters: 20 minimum genomic markers, 2-sided t test P value threshold 0.0001, and signal-to-noise ratio >0.4. To study the linear relationship between copy-number variations (CNVs) and gene expression data, we first categorized CNVs in several levels. Then corresponding genes were extracted for each CNV, their average expression values were calculated, and linear regression was used to assess the relationship between CNV levels and gene-expression data.
Results
CRPC xenografts retain fidelity to the human tissues of origin
The clinicopathological features of the 8 xenograft donor patients are summarized in Table 1. The MDA PCa 144 xenografts have been described in detail (4), but the rest are described here for the first time. MDA PCa 170, 180, 146, and 155 tumors produced several xenograft sublines.
Table 1.
The clinicopathologic features of the 8 xenograft donor patients.
| MDA PCa Cell Line Designationa | ||||||||
|---|---|---|---|---|---|---|---|---|
|
|
||||||||
| Feature | 79 | 117 | 130 | 144 | 146 | 155 | 170 | 180 |
| At presentation | ||||||||
|
| ||||||||
| Age (years) | 61 | 60 | 65 | 68 | 74 | 72 | 63 | 72 |
| PSA (ng/ml) | 65 | 99 | 24 | 4.6 | 10.7 | 1.7 | 19.8 | 53 |
| NBx morphology | AdCa | AdCa | AdCa | AdCa | AdCa | SCC | AdCa | AdCa |
| Gleason Score | 4+4 | 5+5 | 4+4 | 4+3 | 3+4 | - | 9 | 9 |
|
| ||||||||
| Prior treatment | ||||||||
|
| ||||||||
| Androgen ablation | Yes | Yes | Yes | Yes | Yes | Yes | Yes | Yes |
| Radiation | Yes | No | Yes | Yes | Yes | No | No | No |
| Chemotherapy | Yes | Yes | Yes | Yes | Yes | Yes | Yes | Yes |
|
| ||||||||
| At surgery | ||||||||
|
| ||||||||
| Age (years) | 67 | 64 | 76 | 72 | 78 | 72 | 64 | 74 |
| Procedure | PE | CPX | CPX | PE | CPX | PE | CXPX | CXPX |
| Tissue morphology | AdCa | AdCa with NE diff | AdCa | Mixed AdCa SCPC and LCNEC | Mixed AdCa and SCPC | SCPC | AdCa | AdCa |
| GleasonScore | 5+4 | 4+5 | 4+5 | 4+4 | 5+4 | - | 5+4 | 5+4 |
| Pathologicstage | T4Nx | T4N1 | T4N0 | T4N1 | T4N1 | T4N0 | T4N1 | T4N1 |
|
| ||||||||
| Overall survival (years) | 13.3 | 5.3 | 17.6 | 4.8 | 6.2 | 0.6 | 2.5 | 3.8 |
|
| ||||||||
| RE | −1b PR | PR | −4 PR | −10 BL | −2 BL | −1 PR | −11 BL | |
| −9 PR | −6 PR | −12b BL | −9 BL | −4 PR | −14 BL | |||
| −9 PR | −17 BL | −12 BL | - 18 BL | |||||
| Site of tissue collection | −11 BL | −20 BL | −16 PR | - 21 BL | ||||
| −13 BL | -30 SV | |||||||
| −17 BL | ||||||||
| −20 RE | ||||||||
| −23 RE | ||||||||
Numbers indicated by “−” are cell sublines.
These xenografts were unstable and were not developed any further.
Abbreviations: PSA, prostate-specific antigen; NBx, need lebiopsy; AdCa, adenocarcinoma; SCC, small-cellcarcinoma; PE, pelvic exenteration; CPX, cystoprostatectomy; CXPX, cystoprostatectomy; NE diff, neuroendocrine differentiation; SCPC, small-cell prostate carcinoma; LCNEC, large-cell NE carcinoma; RE, rectal wall; PR, prostate; BL, bladder wall; SV, seminal vesicles.
The SCPC/LCNEC xenografts (MDA PCa 144, 146, and 155) were AR− and PSA−, expressed ki67 highly, and stained positively for chromogranin and synaptophysin. Additionally, all SCPC/LCNEC xenografts displayed intense nuclear staining for p53, as did their respective donor tumors (data not shown). MDA PCa 79, 117, 130, 170, and 180 xenografts had the morphologic features of conventional adenocarcinoma and expressed high levels of AR but low levels of ki67. The MDA PCa 117 xenograft was chromogranin A+ and synaptophysin+, and the MDA PCa 180 was synaptophysin+, as were their respective donor tumors. Table 2 and Figure 1A show that the xenografts' (and their sublines') histopathologic and IHC features reflect those of their donor tumors. Supplementary Figure 1A shows the growth rate of 144-13, 146-10 155-2, 170-4 and 180-30 xenografts.
Table 2. Histopathologic and immunohistochemical features of the xenografts and their respective donor tumors.
| Xenograft no.-subline no. | Diagnosis | ARa | PSA | Chromogranin Ab | Synaptophysinb | UBE2Ca | Cyclin D1a | RBa | KI67a |
|---|---|---|---|---|---|---|---|---|---|
| 79 | |||||||||
|
| |||||||||
| Donor Tumor | AdCa | 95 | 90 | neg | neg | 1 | 10 | 50 | 10 |
| MDA PCa 79 | AdCa | 90 | 10c | neg | neg | 10 | <1 | 100 | 15 |
|
| |||||||||
| 117 | |||||||||
|
| |||||||||
| Donor Tumor | AdCa with NE diff | 70 | 80 | pos | pos | 15 | 30 | 90 | 10 |
| MDA PCa 117-9 | AdCa with NE diff | 95 | 10 | pos | pos | 20 | 50 | 100 | 10 |
|
| |||||||||
| 130 | |||||||||
|
| |||||||||
| Donor Tumor | AdCa | 95 | 80 | neg | neg | 20 | 70 | 100 | 10 |
| MDA PCa 130 | AdCa | 80 | 40 | neg | neg | 30 | 70 | 95 | 10 |
|
| |||||||||
| 144 | |||||||||
|
| |||||||||
| Donor Tumor | AdCa | 90 | 40 | neg | neg | 5 | 20 | 5 | 30 |
| SCPC | <1 | <1 | pos | pos | 60 | 0 | 0 | 95 | |
| LCNEC | <1 | 5 | pos | pos | 40 | 0 | N/A | 95 | |
| MDA PCa 144-13 | SCPC | 0 | 0 | pos | pos | 60 | 0 | 0 | 85 |
| MDA PCa 144-4 | LCNEC | 0 | 0 | pos | pos | 40 | 0 | 0 | 95 |
|
| |||||||||
| 146 | |||||||||
|
| |||||||||
| Donor Tumor | AdCa | 90 | 20 | neg | neg | 10 | 0 | 0 | 20 |
| SCPC | 0 | 0 | pos | pos | 40 | 0 | 0 | 95 | |
| MDA PCa 146-10 | SCPC | 0 | 0 | pos | pos | 50 | 0 | 0 | 60 |
| MDA PCa 146-17 | SCPC | 0 | 0 | pos | pos | 30 | 0 | 0 | 40 |
| MDA PCa 146-20 | SCPC | 0 | 0 | pos | pos | 40 | 0 | 0 | 60 |
|
| |||||||||
| 155 | |||||||||
|
| |||||||||
| Donor Tumor | SCPC | 0 | 0 | pos | pos | 50 | 5 | 2 | 50 |
| MDA PCa 155-2 | SCPC | 0 | 0 | pos | pos | 50 | 0 | 0 | 30 |
| MDA PCa 155-9 | SCPC | 0 | 0 | pos | pos | 60 | 0 | 0 | 40 |
| MDA PCa 155-12 | SCPC | 0 | 0 | pos | pos | 40 | 0 | 0 | 40 |
| MDA PCa 155-16 | SCPC | 0 | 0 | pos | pos | 70 | 0 | 0 | 50 |
|
| |||||||||
| 170 | |||||||||
|
| |||||||||
| Donor Tumor | AdCa | 95 | 20 | neg | neg | 10 | 70 | 100 | 25 |
| MDA PCa 170-1 | AdCa | 100 | 60 | neg | neg | 25 | 80 | 100 | 30 |
| MDA PCa 170-4 | AdCa | 95 | 15 | neg | neg | 15 | 75 | 100 | 55 |
|
| |||||||||
| 180 | |||||||||
|
| |||||||||
| Donor Tumor | AdCa with NE diff | 90 | 5 | neg | pos | 20 | 20 | 100 | 30 |
| MDA PCa 180-11 | AdCa with NE diff | 95 | 0 | neg | pos | 25 | 30 | 100 | 70 |
| MDA PCa 180-14 | AdCa with NE diff | 100 | 0 | neg | pos | 20 | 25 | 100 | 50 |
| MDA PCa 180-18 | AdCa with NE diff | 100 | 5 | neg | pos | 15 | 50 | 100 | 60 |
| MDA PCa 180-21 | AdCa with NE diff | 100 | 5 | neg | pos | 35 | 50 | 100 | 80 |
| MDA PCa 180-30 | AdCa with NE diff | 95 | 5 | neg | pos | 20 | 50 | 100 | 50 |
Percentage of positive cells.
neg:≤5% positive cells, pos:>5% positive cells
Note that some discrepancies between donor and xenograft immunohistochemical profiles exist, likely as a result of clonal selection in xenograft establishment. Nonetheless, all xenografts were shown to mirror the section of the donor tumor from which they were obtained.
Abbreviations: DT, donor tumor; AdCa, adenocarcinoma; NE, neuroendocrine; neg, negative; pos, positive; N/A, not available
Figure 1.
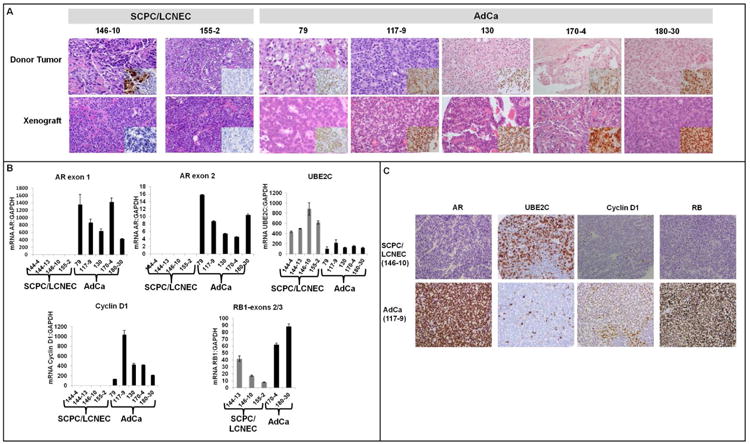
A, Representative images of the xenografts and their donor tumors, with hematoxylin and eosin staining; the insets show IHC staining for AR. Note that the MDA PCa 146-10 donor tumor was mixed, containing adenocarcinoma (AdCa) and SCPC components. The inset shows that the AdCa component was AR+, whereas the SCPC component was AR–. (Chr: chromogranin; Syn: synaptophysin. Original magnification of all images except 155-2, ×200, original magnification of 155-2 images, X100). B, mRNA levels of AR (exons 1 and 2), UBE2C, cyclin D1, and RB1 exons 2/3 in SCPC/LCNEC (gray bars, MDA PCa 144-4, 144-13, 146-10, and 155-2) and AdCa xenografts (black bars, MDA PCa 79, 117-9, 130, 170-4, and 180-30). C, Representative images of AR, UBE2C, cyclin D1, and RB immunostaining in SCPC/LCNEC and AdCa xenografts. Original magnification, ×200.
Gene-expression profiling of SCPC/LCNEC xenografts reveals upregulation of mitotic genes
Unsupervised hierarchal clustering of the raw expression profiles obtained from the MDA PCa 79, 117-9, 130, 144-13, 144-4, 146-10, 155-2, and 155-12 xenografts showed that replicates from the same xenograft clustered together, reflecting biologic identity, and that the xenografts were classified according to their morphology and AR expression (Supplementary Figure 1B).
SCPC/LCNEC xenografts were collectively compared against the adenocarcinoma xenografts. We identified 140 (0.3%) probes expressed differently (FDR, 0.05), corresponding to 104 unique RefSeq Transcript IDs (Supplementary Table 3). Gene Ontology analysis showed enrichment in mitosis-related biologic-process subtrees, including “cell-cycle phase” (adjP = 2.68e−8), “mitotic cell cycle” (adjP = 2.68e−8), and “cell division” (adjP = 2.68e−8), among the 104 genes expressed differently between the groups (Supplementary Figure 1C). Genes in these subtrees included CDC25C (cell division cycle 25C), ANLN (actin-binding protein anillin), AURKA (aurora kinase A), HELLS (helicase, lymphoid-specific), UBE2C (ubiquitin-conjugating enzyme E2C), PTTG1 (pituitary tumor-transforming gene 1), KPNA2 (importin subunit alpha-2), TACC3 (transforming acidic coiled-coil-containing protein 3), PDCD6IP (programmed cell death 6–interacting protein), HIST1H4C (histone H4), and PCNA (proliferating-cell nuclear antigen).
Wang et al. (9) recently reported that in a CRPC model, AR upregulated a set of M-phase genes, including UBE2C (an anaphase promoting complex [APC] specific ubiquitin-conjugating enzyme) to promote tumor growth. However, a thorough examination of AR expression in SCPC/LCNEC xenografts confirmed their lack of AR mRNA (including exon-2 splice variant) and protein (Figure 1B, C). We then confirmed the markedly increased expression of UBE2C in the AR-negative SCPC/LCNEC xenografts relative to that in the AR-positive adenocarcinoma xenografts by qRT-PCR (P = 0.003)(Figure 1B) and IHC (P = 0.002)(Table 2, Figure 1C) analyses. qRT-PCR also revealed higher expression of other APC members, such as Cdc20 ( = 0.04) and FZR1/CDH1 (P = 0.064) in the SCPC/LCNEC xenografts, further supporting the notion that APC activity is deregulated in this subset of PCa (Supplementary Figure 2).
SCPC/LCNEC xenografts lack cyclin D1 and RB expression
Visual analysis of H&E stains revealed higher number of mitotic figures and Ki67 expression in the SCPC/LCNEC xenografts relative to the adenocarcinoma (p<0.001) (Supplementary Figure 3A,B) which might suggest that the M-phase gene overexpression is a mere reflection of the increased proliferation of SCPC/LCNEC tumors. However, except for 144-13 (which contains large amounts of necrosis) the growth rate of the SCPC/LCNEC xenografts was not significantly different from that of the adenocarcinoma xenografts (Supplementary Figure 1A). It has been shown that not all cells containing the Ki-67 antigen are actively proliferating cells and that tumor cells can remain positive for Ki-67 even when arrested in G1/S or G2/M (12). Indeed, flow cytometry analysis showed that the SCPC 146-10 xenograft contained a higher proportion of cells in G2/M phase compared to the adenocarcinoma 180-30 xenograft, while the proportion of cells in S phase was similar in both (Supplementary Figure 3C) suggesting that the overexpression in UBE2C and other mitotic genes could reflect an accumulation of cells in mitosis rather than increased proliferation.
We searched for additional cell cycle–gene-expression abnormalities to support this concept. The absence of cyclin D1 mRNA in the SCPC/LCNEC xenografts was striking because cyclin D1 is frequently overexpressed in cancers(13) and its increased expression has been associated with a worse prognosis in PCa(14). Indeed, primers mapping to the 5´ end of cyclin D1 cDNA, encompassing both cyclin D1a and D1b transcripts(15), confirmed that cyclin D1 mRNA levels were markedly lower in the SCPC/LCNEC than in the adenocarcinoma xenografts (P = 0.053) and IHC showed this was also true for protein levels (P = 0.002)(Figure 1B-C, Table 2).
Since cyclin D1 loss might bypass the need for RB protein, and loss of RB function is virtually universal in small-cell lung carcinoma, a tumor with many clinical and pathologic similarities to SCPC(16, 17), we measured RB transcript levels encompassing exons 2/3 of the gene. We found lower (but present) levels of RB mRNA in the SCPC/LCNEC (mean, 23.6; SD, 21.3) than in the adenocarcinoma xenografts (mean, 45.1; SD, 3.6), but the difference was not statistically significant (P = 0.271) (Figure 1B). IHC analysis, however, showed complete absence of RB protein expression in the SCPC/LCNEC xenografts but abundantly positive staining in the adenocarcinoma xenografts (P = 0.003) (Figure 1C, Table 2). To strengthen these observations we used three different antibodies against RB (Supplementary Table 2) and obtained highly concordant results (data not shown) as determined by Pearson's correlation coefficient testing for continuous variables (r >0.89, P <0.001 for all correlations) and the kappa statistic for variables dichotomized by 10% (κ >0.86, P <0.001 for all correlations).
SCPC/LCNEC xenografts display Copy Number Variations (CNVs) and RB1 microdeletions but no AR or CCND1 deletions
Because both UBE2C overexpression and RB loss have been implicated in tumor chromosomal instability(18, 19), we performed aCGH analysis to compare CNVs between the SCPC/LCNEC and adenocarcinoma xenografts. Principal component analysis of the samples showed that MDA PCa 170-4 and 180-30 xenografts clustered separately from the rest, and within the SCPC/LCNEC group, the two MDA PCa 144 samples also clustered together (Figure 2A). A histogram of the copy number from all segments revealed separation of peaks at 1.6 and 2.4. Using those as cutoffs, we identified 446 amplifications, 431 deletions, and 435 unchanged segments. Indeed, the SCPC/LCNEC MDA PCa 144-4, 144-13, 146-10, and 155-2 xenografts displayed more amplifications (87 ± 41.5) and deletions (69.5 ± 18.2) than did the adenocarcinoma MDA PCa 170-4 and 180-30 xenografts (15 ± 11.3 and 28 ± 5.7, P= 0.03531 and 0.01524, respectively)(Figure 2B).
Figure 2.

Results of aCGH analyses. A, Principal component analysis (PCA). B, Copy number variations (CNVs) in SCPC/LCNEC (blue) and adenocarcinoma (red) xenografts. C, aCGH of the UBE2C, CCND1, AR, and RB1 genetic loci (SCPC/LCNEC xenografts are shown in blue and adenocarcinoma xenografts in red)
In SCPC/LCNEC xenografts, 8 regions were commonly amplified in chromosomes 1, 5, 8, and 21, and 16 regions were commonly deleted in chromosomes 10, 12, 13, 15, 17, and X (Supplementary Figure 4A). CNVs were categorized into levels according to copy number: −2 (mean, <1), −1 (mean, ≥1 <1.6), 0 (mean, ≥1.6 <2.4), 1 (mean, ≥2.4 <3), 2 (mean, ≥3 <4), and 3 (mean, ≥4). Linear regression analysis showed significant linear relationships between the categorized CNVs and gene-expression values for the MDA PCa 144-4, 144-13, 146-10, and 155-2 xenografts in the array (P <2.2e−16). Of note, given the small number of samples, we applied strict criteria to call a CNV, ensuring specificity. Thus, the number of CNVs in the adenocarcinoma samples is relatively small compared to previous aCGH reports in CRPC.(20)(21) Although looser criteria might increase the number of CNVs in each group, the conclusion that the number of CNVs in SCPC/LCNEC is greater than that in the adenocarcinomas would be unlikely to change.
We asked whether detected CNVs might explain the differences in gene expression between the SCPC/LCNEC and the adenocarcinoma xenografts. Overexpression of UBE2C has been attributed to amplification of the UBE2C locus at 20q13.1 in various tumors(22). Xenograft MDA PCa 155-2 displayed a log ratio of 0.63, corresponding to a copy number of 3.1 at the 20q13.12 segment containing the UBE2C gene. No other xenografts showed amplifications in this region (Figure 2C). Xenograft MDA PCa 146-10 displayed a log ratio of 0.64, corresponding to a copy number of 3.12 at the 11q13.2 segment containing the CCND1 gene despite the absence of cyclin D1 mRNA in this tumor. No other xenografts showed CNVs in this region (Figure 2C). Xenografts MDA PCa 155-2, 170-4 and 180-30 showed log ratios of 0.4, 5.2 and 0.5, corresponding to copy numbers of 2.64, 74.54 and 2.78, respectively, at the Xq12 segment containing the AR gene, although AR mRNA is absent in MDA PCa 155-2 (Figure 2C). Finally, diverse microdeletions were observed at the 13q14 segments containing RB1 in the SCPC/LCNEC but not the adenocarcinoma xenografts (Figure 2C). Additional studies, with greater numbers of samples, are required to confirm the presence or absence of CNVs affecting the UBE2C, CCND1, RB and AR genes in SCPC tumors.
SCPC/LCNEC xenografts do not express full-length RB1 protein
Given the aCGH results, we designed additional qRT-PCR primers to map the RB1 gene's exons 18/19, 21/22, and 26/27(Figure 3A). As shown in Figure 3B, MDA PCa 144-13, which displayed a 3´ microdeletion of the RB1 gene on aCGH, expressed mRNA encompassing exons 2/3 but none encompassing the distal exons. MDA PCa 155-2 expressed mRNA for all but the regions encompassing exons 18/19, whereas MDA PCa 146-10 expressed mRNA for all of the mapped exons. In contrast, the adenocarcinoma xenografts MDA PCa 170-4 and 180-30 expressed all of the mRNA regions tested. These observations were further supported by RT-PCR of exons 17–27 (Figure 3C). Western blot analysis confirmed that the AR− SCPC/LCNEC MDA PCa 144-13, 146-10 and 155-2 xenografts do not express full-length RB protein, whereas the AR+ CRPC xenografts with adenocarcinoma morphology (MDA PCa 170-4 and 180-3) do (Figure 3C).
Figure 3.
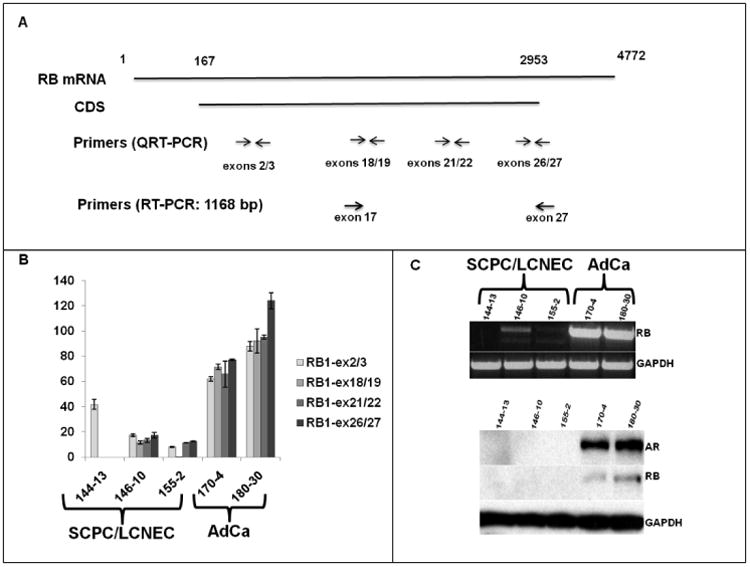
A, Schematic representation of the RB mRNA and the primers used for the qRT-PCR and RT-PCR experiments. B, qRT-PCR results for RB1 exons (ex) 2/3, 18/19, 21/22, and 26/27. C, Upper panel, RT-PCR results for exons 17 through 27; lower panel, Western blotting results for AR and RB expression, in which the bands correspond to the molecular weight of the full-length proteins (SCPC, small cell prostate carcinoma; LCNEC, large cell neuroendocrine carcinoma; AdCa, adenocarcinoma)
AR, cyclin D1, and RB promoter regions are not methylated in SCPC/LCNEC xenografts
Because AR promoter methylation has been described as a mechanism underlying AR loss in AR− cell lines(23) and both the RB1 and CCND1 promoters contain CpG islands(24,25), we asked whether promoter methylation could explain the AR, RB, and cyclin D1 silencing found in the SCPC/LCNEC xenografts.
Consistent with previous reports, the AR promoter region was aberrantly hypermethylated by pyrosequencing analysis in the AR− PCa cell lines PC-3 and DU145 but not in the SCPC/LCNEC xenografts and neither were the RB1 or CCND1 promoters (Supplementary Figure 4B).
IHC analysis confirmed the UBE2Chigh, AR−, cyclin D1−, RB− signature in human SCPC tissues
To validate our observations we conducted IHC analysis of a 68-sample panel of “Clinical CRPC Samples” described above. The clinicopathologic characteristics of the 60 patients from whom they were obtained are described in Supplementary Table 4. Among the anti-RB antibodies used, the Calbiochem antibody was further analyzed because of its more-intense nuclear staining and less-intense cytoplasmic background staining.
Indeed UBE2C expression was markedly increased while cyclin D1 and RB levels were markedly decreased in the clinical CRPC samples with SCPC/LCNEC morphology relative to those with adenocarcinoma morphology (P <0.001 for all comparisons). This was true in SCPC samples obtained from primary SCPC (n=3), SCPC samples obtained prior to starting androgen deprivation therapy (n=2) and SCPC samples obtained prior to start of chemotherapy (n=9), suggesting that these observations reflect the biology underlying SCPC and are not a consequence of prior treatment. Of note, the mixed adenocarcinomas had lower levels of cyclin D1 and RB than did the pure adenocarcinomas (P <0.001 for both comparisons)(Figure 4A).
Figure 4.

UBE2C, cyclin D1, RB, and AR protein expression in clinical CRPC tissues with SCPC/LCNEC prostate carcinoma or adenocarcinoma (AdCa) morphology. A, Scatter plots of UBE2C, cyclin D1, RB, and AR expression in the clinical CRPC samples. B, Representative images of hematoxylin and eosin (H&E)–stained and UBE2C-, cyclin D1-, Rb-, and AR–stained sections from a mixed SCPC–AdCa tumor and a pure AdCa tumor. (CRPC: castrate-resistant prostate carcinoma; SCPC, small cell prostate carcinoma; LCNEC, large cell neuroendocrine carcinoma; Original magnification, ×200).
Using 10% positive cells as a cut-off, 23/24 (96%) SCPC/LCNEC clinical CRPC samples had high UBE2C expression, whereas only 12/36 (33%) pure adenocarcinomas and 2/8 (25%) mixed adenocarcinomas showed high levels of UBE2C (Figure 4A). All but 1 (96%) of the SCPC/LCNEC clinical CRPC samples were RB−/cyclin D1− while 34/44 (77%) adenocarcinomas were RB+/cyclin D1+. Interestingly, three (7%) of the adenocarcinomas were RB+/cyclin D1–, but the intensity of RB expression in these cases was only 1+, whereas all RB+/cyclin D1+ cases stained intensely (2+ and 3+) for RB. Also, it is noteworthy that 5/7 (16%) of the RB−/cyclin D1− adenocarcinomas were mixed with SCPC or LCNEC (Figure 4B). PSA, ki67, chromogranin and synaptophysin staining results in the clinical CRPC samples are described in Supplementary Data.
Discussion
The models described here were derived from patients with a well defined clinical history of anaplastic PCa (10) selected in a non-random way and demonstrated high degree of fidelity to their donor tumor. The results of the molecular studies were robustly validated in a cohort of patients with CRPC that shared the phenotypic features of the xenografts and their donor tumors. These findings support the notion that these xenografts can be used to model SCPC in order to fill the knowledge gap in their biology, predict for its emergence in CRPC and develop specific therapies to improve the outcome of men afflicted with this lethal PCa variant. The cellular program that drives the growth of the AR− SCPC/LCNECs variants is a mechanism of escape from the AR-ablating treatments currently at the forefront of PCa therapy. Moreover, the pathways implicated in the pathogenesis of this subset may also contribute to castration resistance in PCa with non-variant morphology. Using xenograft models as discovery platforms, we found high expression of M-phase genes, including UBE2C, coupled with RB and cyclin D1 loss in SCPC/LCNEC, despite the absence of AR expression. The robust validation of these findings in patient CRPC samples show that xenograft models can contribute significantly to the understanding of human PCa biology and may serve as tools for the efficient prioritization of candidate therapies.
The origin of SCPC has long been debated(26-28). The frequent coexistence of SCPC and adenocarcinoma, the presence of transition areas between the 2 morphologic types in mixed tumors(3, 4), and the TMPRSS2:ERG fusions and TP53 mutations that are shared by the components of mixed tumors(29, 30) all support the concept of a common derivation, either through transdifferentiation of one cell type to the other or through a common stem-cell origin. All but one of the AR− SCPC/LCNEC tumors we tested were also RB− and cyclin D1−, whereas the “mixed adenocarcinomas” (the adenocarcinoma components of the mixed tumors), which were frequently RB− and cyclin D1−, remained AR+ and had lower levels of UBE2C expression. These observations suggest a sequence of events in which loss of RB and/or cyclin D1 precede AR-loss and further deregulation of the mitotic apparatus. Understanding the sequence of events that drives the emergence of the SCPC phenotype during CRPC progression may lead to identification of prognostic markers for the early recognition of patients destined to develop this lethal variant of PCa.
UBE2C collaborates with the multiprotein complex APC in the degradation of mitotic proteins which is essential for cells to exit mitosis and progress through the cell cycle. Overexpression of UBE2C leads to uncontrolled APC activity and precocious degradation of cyclinB1 that leads to aneuploidy(18). UBE2C is overexpressed in human carcinomas of diverse anatomic origin(22) and UBE2C transgenic mice are prone to develop a broad spectrum of tumors supporting an oncogenic role for this protein (18). The mechanisms of UBE2C overexpression in cancer cells that do not express AR are poorly understood and likely to be complex. One recent report implicated Cdc20 in the activation of the UBE2C promoter.(31) Another demonstrated that phosphorylated coactivator mediator-1 (MED1) and FoxA1 mediated long-range interactions between UBE2C enhancers and the UBE2C promoter, leading to UBE2C gene expression in PC-3 cells.(32) Our gene expression analysis showed increased Cdc20 (Supplementary Figure 2A) and FoxA1 (data not shown) expression in SCPC xenografts compared to adenocarcinoma, suggesting both mechanisms might be at play in this setting.
Interestingly, a recent report showed upregulation of aurora kinase A in human SCPC and provided evidence that its inhibition suppressed NEPCa growth (33). Aurora kinase A has also been shown to be upregulated in diverse human carcinomas and been ascribed an oncogenic role. We too observed upregulation of aurora kinase A (but not amplification), as well as numerous other mitotic genes, including aurora kinase B, polo-kinase 1 and FOXM1 (data not shown) in our SCPC models. Hence it appears that the mitotic apparatus is an important target in SCPC and fortunately, a number of mitotic kinase inhibitors are already in early clinical trials(34). However, the mitotic apparatus is complex, and selecting the optimal target will require an in-depth understanding of the hierarchy that drives the disease. Accurate preclinical models of the disease are needed to efficiently prioritize available drugs for clinical development. Despite previous publications advocating PC-3 as an accurate model of SCPC (35), we contend that significant differences exist between PC-3 and SCPC, including the presence of a wild-type RB (36) and the methylation of its AR promoter. The shared biologic properties between our xenografts and their donor tumors and the validation of our results in clinical SCPC/LCNEC samples provide evidence that they are valuable tools for modeling the disease and testing the efficacy of therapeutic strategies.
RB-loss has been implicated in the progression to CRPC via increased AR expression, mediated by E2F transcription factor 1(8). Indeed, the tumor-suppressor function of RB has been attributed mainly to its ability to inhibit E2F transcription factors and induce G1 arrest. However, RB plays diverse cellular roles beyond that of a G1 checkpoint (such as in chromosome condensation, centromeric function, and chromosome stability) and RB-loss has been directly implicated in the development of the chromosomal instability that characterizes poorly differentiated tumors (19). Hence, additional consequences of RB-loss that are not mediated by an increase in AR activity would be expected to emerge in the progression of CRPC.
The high RB expression we observed in the AR+ castrate-resistant adenocarcinomas samples is at odds with the recent report of RB-loss in CRPC(8). Two considerations might explain this discrepancy. First, Sharma et al(8) examined specimens from CRPC metastases, whereas our specimens were all derived from primary CRPC tumors. Perhaps RB status is discrepant between primary and metastastic sites. Second, bladder cancer studies have shown that intense RB protein expression can be attributed to protein hyperphosphorylation, which inactivates RB(37). Both low and high RB protein expression have been associated with nonfunctional RB protein in bladder carcinomas(38). In these studies RB-negative tumors were also cyclin D1−, whereas tumors that overexpressed RB had high cyclin D1. Perhaps in CRPC adenocarcinoma, aberrations of the G1-S transition are mediated through cyclin D1 overexpression, leading to RB hyperphosphorylation, seen on IHC analysis as RB protein overexpression. Thus, different mechanisms of RB inactivation (loss of full-length protein expression versus hyperphosphorylation) might lead to different PCa phenotypes (small-cell carcinoma versus adenocarcinoma), as has been proposed in lung malignancies(39). Elucidation of these mechanisms gains further significance with the introduction of novel cyclin-dependent kinase (CDK) inhibitors, seeking to activate RB,(40) into clinical trials.
The loss of cyclin D1 expression in SCPC was puzzling because this protein is generally activated in proliferating cells and repressed in differentiated cells.(41) However, beyond its ability to activate CDKs to initiate proliferation, cyclin D1 is a regulator of the activity of numerous transcription factors, including the AR(42) and exerts diverse effects depending on the cellular context. For example, Lehn et al(43) showed that cyclin D1 downregulation increased the migratory capacity of breast cancer cell lines and was associated with unfavorable prognostic features. Since cyclin D1 mRNA was undetectable but no loss or rearrangement of the cyclin D1 gene was noted, we propose that its loss is due to transcriptional repression. It has been shown that overexpression of E2F1 can inhibit cyclin D1 promoter activity.(44) In our study, cyclinD1 loss was strongly correlated with RB loss, and the gene expression arrays showed significant overexpression of E2F1 in the SCPC xenografts (data not shown). Thus we speculate that E2F1 repression might contribute to cyclin D1 silencing in the SCPC.
Similarly, although most studies have focused on the oncogenic effects of AR, substantive evidence also supports a tumor -suppressor role for it in PCa (45). For instance, in TRAMP mice, AR favored survival of differentiated tumor epithelium while suppressing proliferation of more-malignant basal intermediate cells(46). The mechanism by which AR expression is lost in SCPC is unknown and the subject of ongoing investigations in our laboratory.
SCPC often express NE markers such as chromogranin A and synaptophysin, and NE differentiation has been proposed to contribute to androgen-independence in PCa. However, the term “NE differentiation” in PCa encompasses a wide range of conditions. NE markers, such as chromogranin A and synaptophysin, are expressed in 10-100% of untreated tumors depending on the methodology used and the extent of cells that stain positively for these markers increases during castration.(47) Notably, the extent of NE marker expression considered to constitute NE differentiation in PCa has not been clearly defined. In our study, the MDA PCa 117 displayed conventional adenocarcinoma morphology and expressed NE markers. Within the clinical CRPC samples with conventional adenocarcinoma morphology, 21 expressed synaptophysin and 2 chromogranin (Supplementary Data). The expression of UBE2C, cyclin D1, Rb, AR and ki67 did not differ significantly in these cases compared to adenocarcinomas lacking NE marker expression. Therefore, the presence of NE differentiation in PCa, while possibly prognostic, is not predictive of a distinct clinical course nor a therapy response profile (48) and must not be confused with SCPC.
In summary, we have developed and characterized a panel of CRPC xenografts models that mirror the human tumors from which they were derived. Their study has allowed us to demonstrate that AR− SCPC/LCNEC tumors display marked UBE2C overexpression, coupled with loss of RB and cyclin D1 expression, features which are likely to contribute to the pathogenesis and AR independence of this poorly understood lethal PCa variant. Hence, we provide evidence that xenograft models are representative of the human disease and can serve as valuable tools to define clinically relevant biology.
Supplementary Material
Statement of Translational Relevance.
Small cell prostate carcinoma (SCPC) is a lethal variant of prostate cancer (PCa). Androgen ablation therapy is ineffective, the frequently observed chemotherapy responses are transient and median survival stands at approximately one year. An improved understanding of the mechanisms of progression to SCPC is urgently needed and may have broader implications in PCa. We characterized unique human PCa xenografts from patients with advanced castration-resistant prostate carcinomas (CRPC) and found significant upregulation of mitotic phase genes, including UBE2C (an anaphase promoting complex specific E2 conjugating enzyme), and loss of retinoblastoma, cyclin D1 and androgen receptor expression in the SCPC xenografts when compared to xenografts with conventional adenocarcinoma morphology. The results were confirmed in the donor tumors and in a cohort of CRPC patients' samples. These novel models can be used as a platform to study the biology underlying SCPC and to prioritize candidate therapies and predictive markers for further study.
Acknowledgments
We thank Karen Knudsen, PhD, of Thomas Jefferson University, and William F. Benedict, PhD, of MD Anderson for their valuable comments and also from MD Anderson: Karen F. Phillips, ELS, for editing of the manuscript; Ina N. Prokhorova, MD, for assistance with pathologic specimens; and Odilia Leon for help with the immunohistochemical studies.
Financial Support: This research was supported in part by the National Institutes of Health through MD Anderson's Cancer Center Support Grant, CA016672; National Institutes of Health Prostate SPORE grant P50 CA140388; and by the Prostate Cancer Foundation
Footnotes
Note: Supplementary data for this article are available at Clinical Cancer Research Online (http://clincancerres.aacrhournals.org/)
Disclosure of Potential Conflicts of Interest: No potential conflicts of interest were disclosed.
Note: The genomic (array CGH) and transcript profiling data have been deposited into NCBI/GEO under superseries GSE33054.
References
- 1.Papandreou CN, Daliani DD, Thall PF, Tu SM, Wang X, Reyes A, et al. Results of a phase II study with doxorubicin, etoposide, and cisplatin in patients with fully characterized small-cell carcinoma of the prostate. J Clin Oncol. 2002;20:3072–80. doi: 10.1200/JCO.2002.12.065. [DOI] [PubMed] [Google Scholar]
- 2.Spiess PE, Pettaway CA, Vakar-Lopez F, Kassouf W, Wang X, Busby JE, et al. Treatment outcomes of small cell carcinoma of the prostate: a single-center study. Cancer. 2007;110:1729–37. doi: 10.1002/cncr.22971. [DOI] [PubMed] [Google Scholar]
- 3.Wang W, Epstein JI. Small cell carcinoma of the prostate. A morphologic and immunohistochemical study of 95 cases. Am J Surg Pathol. 2008;32:65–71. doi: 10.1097/PAS.0b013e318058a96b. [DOI] [PubMed] [Google Scholar]
- 4.Aparicio A, Tzelepi V, Araujo JC, Guo CC, Liang S, Troncoso P, et al. Neuroendocrine prostate cancer xenografts with large-cell and small-cell features derived from a single patient's tumor: morphological, immunohistochemical, and gene expression profiles. Prostate. 2011;71:846–56. doi: 10.1002/pros.21301. [DOI] [PMC free article] [PubMed] [Google Scholar]
- 5.di Sant'Agnese PA. Neuroendocrine differentiation in prostatic carcinoma: an update on recent developments. Ann Oncol. 2001;12(2):S135–40. [PubMed] [Google Scholar]
- 6.Wynn SS, Nagabundi S, Koo J, Chin NW. Recurrent prostate carcinoma presenting as omental large cell carcinoma with neuroendocrine differentiation and resulting in bowel obstruction. Arch Pathol Lab Med. 2000;124:1074–6. doi: 10.5858/2000-124-1074-RPCPAO. [DOI] [PubMed] [Google Scholar]
- 7.Evans AJ, Humphrey PA, Belani J, van der Kwast TH, Srigley JR. Large cell neuroendocrine carcinoma of prostate: a clinicopathologic summary of 7 cases of a rare manifestation of advanced prostate cancer. Am J Surg Pathol. 2006;30:684–93. doi: 10.1097/00000478-200606000-00003. [DOI] [PubMed] [Google Scholar]
- 8.Sharma A, Yeow WS, Ertel A, Coleman I, Clegg N, Thangavel C, et al. The retinoblastoma tumor suppressor controls androgen signaling and human prostate cancer progression. J Clin Invest. 2010;120:4478–92. doi: 10.1172/JCI44239. [DOI] [PMC free article] [PubMed] [Google Scholar]
- 9.Wang Q, Li W, Zhang Y, Yuan X, Xu K, Yu J, et al. Androgen receptor regulates a distinct transcription program in androgen-independent prostate cancer. Cell. 2009;138:245–56. doi: 10.1016/j.cell.2009.04.056. [DOI] [PMC free article] [PubMed] [Google Scholar]
- 10.Aparicio A, Harzstark AL, Lin E, Corn PG, Araujo JC, Tu S, et al. Characterization of the anaplastic prostate carcinomas: A prospective two-stage phase II trial of frontline carboplatin and docetaxel (CD) and salvage etoposide and cisplatin (EP) J Clin Oncol. 2011;29(suppl; abstr 4666) [Google Scholar]
- 11.Pounds S, Morris SW. Estimating the occurrence of false positives and false negatives in microarray studies by approximating and partitioning the empirical distribution of p-values. Bioinformatics. 2003;19:1236–42. doi: 10.1093/bioinformatics/btg148. [DOI] [PubMed] [Google Scholar]
- 12.van Oijen MG, Medema RH, Slootweg PJ, Rijksen G. Positivity of the proliferation marker Ki-67 in noncycling cells. Am J Clin Pathol. 1998;110:24–31. doi: 10.1093/ajcp/110.1.24. [DOI] [PubMed] [Google Scholar]
- 13.Kim JK, Diehl JA. Nuclear cyclin D1: an oncogenic driver in human cancer. J Cell Physiol. 2009;220:292–6. doi: 10.1002/jcp.21791. [DOI] [PMC free article] [PubMed] [Google Scholar]
- 14.Ding Z, Wu CJ, Chu GC, Xiao Y, Ho D, Zhang J, et al. SMAD4-dependent barrier constrains prostate cancer growth and metastatic progression. Nature. 2011;470:269–73. doi: 10.1038/nature09677. [DOI] [PMC free article] [PubMed] [Google Scholar]
- 15.Comstock CE, Augello MA, Benito RP, Karch J, Tran TH, Utama FE, et al. Cyclin D1 splice variants: polymorphism, risk, and isoform-specific regulation in prostate cancer. Clin Cancer Res. 2009;15:5338–49. doi: 10.1158/1078-0432.CCR-08-2865. [DOI] [PMC free article] [PubMed] [Google Scholar]
- 16.Beasley MB, Lantuejoul S, Abbondanzo S, Chu WS, Hasleton PS, Travis WD, et al. The P16/cyclin D1/Rb pathway in neuroendocrine tumors of the lung. Hum Pathol. 2003;34:136–42. doi: 10.1053/hupa.2003.8. [DOI] [PubMed] [Google Scholar]
- 17.Igarashi T, Jiang SX, Kameya T, Asamura H, Sato Y, Nagai K, et al. Divergent cyclin B1 expression and Rb/p16/cyclin D1 pathway aberrations among pulmonary neuroendocrine tumors. Mod Pathol. 2004;17:1259–67. doi: 10.1038/modpathol.3800176. [DOI] [PubMed] [Google Scholar]
- 18.van Ree JH, Jeganathan KB, Malureanu L, van Deursen JM. Overexpression of the E2 ubiquitin-conjugating enzyme UbcH10 causes chromosome missegregation and tumor formation. J Cell Biol. 2010;188:83–100. doi: 10.1083/jcb.200906147. [DOI] [PMC free article] [PubMed] [Google Scholar]
- 19.Sage J, Straight AF. RB's original CIN? Genes Dev. 2010;24:1329–33. doi: 10.1101/gad.1948010. [DOI] [PMC free article] [PubMed] [Google Scholar]
- 20.Sun J, Liu W, Adams TS, Sun J, Li X, Turner AR, et al. DNA copy number alterations in prostate cancers: a combined analysis of published CGH studies. Prostate. 2007;67:692–700. doi: 10.1002/pros.20543. [DOI] [PubMed] [Google Scholar]
- 21.Taylor BS, Schultz N, Hieronymus H, Gopalan A, Xiao Y, Carver BS, et al. Integrative genomic profiling of human prostate cancer. Cancer Cell. 2010;18:11–22. doi: 10.1016/j.ccr.2010.05.026. [DOI] [PMC free article] [PubMed] [Google Scholar]
- 22.Wagner KW, Sapinoso LM, El-Rifai W, Frierson HF, Butz N, Mestan J, et al. Overexpression, genomic amplification and therapeutic potential of inhibiting the UbcH10 ubiquitin conjugase in human carcinomas of diverse anatomic origin. Oncogene. 2004;23:6621–9. doi: 10.1038/sj.onc.1207861. [DOI] [PubMed] [Google Scholar]
- 23.Kinoshita H, Shi Y, Sandefur C, Meisner LF, Chang C, Choon A, et al. Methylation of the androgen receptor minimal promoter silences transcription in human prostate cancer. Cancer Res. 2000;60:3623–30. [PubMed] [Google Scholar]
- 24.Ohtani-Fujita N, Fujita T, Aoike A, Osifchin NE, Robbins PD, Sakai T. CpG methylation inactivates the promoter activity of the human retinoblastoma tumor-suppressor gene. Oncogene. 1993;8:1063–7. [PubMed] [Google Scholar]
- 25.Liu H, Wang J, Epner EM. Cyclin D1 activation in B-cell malignancy: association with changes in histone acetylation, DNA methylation, and RNA polymerase II binding to both promoter and distal sequences. Blood. 2004;104:2505–13. doi: 10.1182/blood-2004-02-0483. [DOI] [PubMed] [Google Scholar]
- 26.Abrahamsson PA. Neuroendocrine differentiation in prostatic carcinoma. Prostate. 1999;39:135–48. doi: 10.1002/(sici)1097-0045(19990501)39:2<135::aid-pros9>3.0.co;2-s. [DOI] [PubMed] [Google Scholar]
- 27.Schron DS, Gipson T, Mendelsohn G. The histogenesis of small cell carcinoma of the prostate. An immunohistochemical study. Cancer. 1984;53:2478–80. doi: 10.1002/1097-0142(19840601)53:11<2478::aid-cncr2820531119>3.0.co;2-q. [DOI] [PubMed] [Google Scholar]
- 28.Helpap B, Kollermann J. Undifferentiated carcinoma of the prostate with small cell features: immunohistochemical subtyping and reflections on histogenesis. Virchows Arch. 1999;434:385–91. doi: 10.1007/s004280050357. [DOI] [PubMed] [Google Scholar]
- 29.Hansel DE, Nakayama M, Luo J, Abukhdeir AM, Park BH, Bieberich CJ, et al. Shared TP53 gene mutation in morphologically and phenotypically distinct concurrent primary small cell neuroendocrine carcinoma and adenocarcinoma of the prostate. Prostate. 2009;69:603–9. doi: 10.1002/pros.20910. [DOI] [PMC free article] [PubMed] [Google Scholar]
- 30.Guo CC, Dancer JY, Wang Y, Aparicio A, Navone NM, Troncoso P, et al. TMPRSS2-ERG gene fusion in small cell carcinoma of the prostate. Hum Pathol. 2011;42:11–7. doi: 10.1016/j.humpath.2010.05.026. [DOI] [PMC free article] [PubMed] [Google Scholar]
- 31.Nath S, Banerjee T, Sen D, Das T, Roychoudhury S. Spindle assembly checkpoint protein Cdc20 transcriptionally activates expression of ubiquitin carrier protein UbcH10. J Biol Chem. 2011;286:15666–77. doi: 10.1074/jbc.M110.160671. [DOI] [PMC free article] [PubMed] [Google Scholar]
- 32.Chen Z, Zhang C, Wu D, Chen H, Rorick A, Zhang X, et al. Phospho-MED1-enhanced UBE2C locus looping drives castration-resistant prostate cancer growth. Embo J. 2011;30:2405–19. doi: 10.1038/emboj.2011.154. [DOI] [PMC free article] [PubMed] [Google Scholar]
- 33.Beltran H, Rickman D, Park K, Sboner A, Macdonald T, Tagawa ST, et al. Molecular characterization of neuroendocrine prostate cancer (NEPC) and identification of new drug targets. J Clin Oncol. 2011;29(suppl 7; abstr 19) doi: 10.1158/2159-8290.CD-11-0130. [DOI] [PMC free article] [PubMed] [Google Scholar]
- 34.Janssen A, Medema RH. Mitosis as an anti-cancer target. Oncogene. 2011;30:2799–809. doi: 10.1038/onc.2011.30. [DOI] [PubMed] [Google Scholar]
- 35.Tai S, Sun Y, Squires JM, Zhang H, Oh WK, Liang CZ, et al. PC3 is a cell line characteristic of prostatic small cell carcinoma. Prostate. doi: 10.1002/pros.21383. [DOI] [PMC free article] [PubMed] [Google Scholar]
- 36.Rubin SJ, Hallahan DE, Ashman CR, Brachman DG, Beckett MA, Virudachalam S, et al. Two prostate carcinoma cell lines demonstrate abnormalities in tumor suppressor genes. J Surg Oncol. 1991;46:31–6. doi: 10.1002/jso.2930460108. [DOI] [PubMed] [Google Scholar]
- 37.Chatterjee SJ, George B, Goebell PJ, Alavi-Tafreshi M, Shi SR, Fung YK, et al. Hyperphosphorylation of pRb: a mechanism for RB tumour suppressor pathway inactivation in bladder cancer. J Pathol. 2004;203:762–70. doi: 10.1002/path.1567. [DOI] [PubMed] [Google Scholar]
- 38.Cote RJ, Dunn MD, Chatterjee SJ, Stein JP, Shi SR, Tran QC, et al. Elevated and absent pRb expression is associated with bladder cancer progression and has cooperative effects with p53. Cancer Res. 1998;58:1090–4. [PubMed] [Google Scholar]
- 39.Wikenheiser-Brokamp KA. Retinoblastoma regulatory pathway in lung cancer. Curr Mol Med. 2006;6:783–93. doi: 10.2174/1566524010606070783. [DOI] [PubMed] [Google Scholar]
- 40.Lapenna S, Giordano A. Cell cycle kinases as therapeutic targets for cancer. Nat Rev Drug Discov. 2009;8:547–66. doi: 10.1038/nrd2907. [DOI] [PubMed] [Google Scholar]
- 41.Klein EA, Assoian RK. Transcriptional regulation of the cyclin D1 gene at a glance. J Cell Sci. 2008;121:3853–7. doi: 10.1242/jcs.039131. [DOI] [PMC free article] [PubMed] [Google Scholar]
- 42.Comstock CE, Augello MA, Schiewer MJ, Karch J, Burd CJ, Ertel A, et al. Cyclin D1 is a selective modifier of androgen-dependent signaling and androgen receptor function. J Biol Chem. 2011;286:8117–27. doi: 10.1074/jbc.M110.170720. [DOI] [PMC free article] [PubMed] [Google Scholar]
- 43.Lehn S, Tobin NP, Berglund P, Nilsson K, Sims AH, Jirstrom K, et al. Down-regulation of the oncogene cyclin D1 increases migratory capacity in breast cancer and is linked to unfavorable prognostic features. Am J Pathol. 2010;177:2886–97. doi: 10.2353/ajpath.2010.100303. [DOI] [PMC free article] [PubMed] [Google Scholar]
- 44.Watanabe G, Albanese C, Lee RJ, Reutens A, Vairo G, Henglein B, et al. Inhibition of cyclin D1 kinase activity is associated with E2F-mediated inhibition of cyclin D1 promoter activity through E2F and Sp1. Mol Cell Biol. 1998;18:3212–22. doi: 10.1128/mcb.18.6.3212. [DOI] [PMC free article] [PubMed] [Google Scholar]
- 45.Niu Y, Chang TM, Yeh S, Ma WL, Wang YZ, Chang C. Differential androgen receptor signals in different cells explain why androgen-deprivation therapy of prostate cancer fails. Oncogene. 2010;29:3593–604. doi: 10.1038/onc.2010.121. [DOI] [PubMed] [Google Scholar]
- 46.Niu Y, Altuwaijri S, Lai KP, Wu CT, Ricke WA, Messing EM, et al. Androgen receptor is a tumor suppressor and proliferator in prostate cancer. Proc Natl Acad Sci U S A. 2008;105:12182–7. doi: 10.1073/pnas.0804700105. [DOI] [PMC free article] [PubMed] [Google Scholar]
- 47.Komiya A, Suzuki H, Imamoto T, Kamiya N, Nihei N, Naya Y, et al. Neuroendocrine differentiation in the progression of prostate cancer. Int J Urol. 2009;16:37–44. doi: 10.1111/j.1442-2042.2008.02175.x. [DOI] [PubMed] [Google Scholar]
- 48.Culine S, El Demery M, Lamy PJ, Iborra F, Avances C, Pinguet F. Docetaxel and cisplatin in patients with metastatic androgen independent prostate cancer and circulating neuroendocrine markers. J Urol. 2007;178:844–8. doi: 10.1016/j.juro.2007.05.044. [DOI] [PubMed] [Google Scholar]
Associated Data
This section collects any data citations, data availability statements, or supplementary materials included in this article.