

Abstract
Drinking in the Dark (DID) is a limited access ethanol drinking phenotype in mice. High Drinking in the Dark (HDID-1) mice have been bred for 27 selected generations (S27) for elevated blood ethanol concentrations (BECs) after a 4 hr period of access to 20% ethanol. A second replicate line (HDID-2) was started later from the same founder population and is currently in S20. An initial report of response to selection in HDID-1 was published after S11. This paper reports genetic and behavioral characteristics of both lines in comparison with the HS controls. Heritability is low in both replicates (h2 = 0.09) but the lines have shown 4-5 fold increases in BEC since S0; 80% of HDID-1 and 60% of HDID-2 mice reach BECs greater than 1.0 mg/ml. Several hours after a DID test, HDID mice show mild signs of withdrawal. Although not considered during selection, intake of ethanol (g/kg) during the DID test increased by approximately 80% in HDID-1 and 60% in HDID-2. Common genetic influences were more important than environmental influences in determining the similarity between BEC and intake for HDID mice. Analysis of the partitioning of intake showed that 60% of intake is concentrated in the last 2 hr of the 4 hr session. However, this has not changed during selection. Hourly BECs during the DID test reach peak levels after 3 or 4 hr of drinking. HDID mice do not differ from HS mice in their rate of elimination of an acute dose of alcohol.
Keywords: binge, ethanol consumption, ethanol withdrawal, genetics, selective breeding
INTRODUCTION
The very first systematic examination of the genetics of two-bottle ethanol preference drinking in mice showed extremely large inbred strain differences in the proportion of total fluid intake taken from the 10% ethanol vs the tap water bottle (McClearn & Rodgers 1959). Examination of strain differences were soon extended to numerous other inbred strains (Rodgers & McClearn 1962) and the strain differences have proven robust in multiple laboratories across the ensuing 50+ years (Wahlsten et al. 2006). Numerous rat and mouse lines have been selectively bred for high vs low ethanol preference drinking where ethanol and water are continuously available, and this literature was relatively recently reviewed [see references in (Crabbe et al. 2010) and (Crabbe 2013)]. In searches for the genetic basis of these differences, the increasing power of genomic strategies first enabled allele-based quantitative trait locus (QTL) mapping studies and, more recently, studies exploring expression-based QTLs (Saba et al. 2011) as well as meta-analyses of a variety of genomic data (Mulligan et al. 2006; Iancu et al. 2013).
The two-bottle preference phenotype is usually assessed during 24 hr continuous access to ethanol and water, during which intake and preference are generally assessed no more frequently than once per day. Because animals distribute their drinking throughout the day and night, a significant limitation of this measurement strategy is that under most circumstances, animals do not reach intoxicating BECs, or even BECs that yield behavioral consequences (Crabbe 2012). Thus, the animals’ drinking under 24-hr access conditions generally does not appear to resemble that of humans, where binge-like drinking is more common (Cranford et al. 2006). Binge drinking is defined by the National Institute on Alcohol Abuse and Alcoholism as a pattern leading to BECs ≥ 0.80 mg EtOH/ml blood (NIAAA 2004) and is highly prevalent (Naimi et al. 2010). Several years ago, rat lines were bred for high (HARF) or low (LARF) consumption of 12% ethanol offered in a two-bottle test vs water during 20 min sessions (Le et al. 2001). Animals were offered 3%, then 6% and finally 12% ethanol over many days, and selection was on average intake of 12% ethanol vs water. Starting with the 7th selected generation, inbreeding was initiated for both lines while selection continued through generation S15. By the 6th generation, HARF rats were drinking about 1.2 g/kg in 20 min while LARF rats drank only 0.6 g/kg (averaged across sexes). After 4 generations, HARF rats reached average BECs = 0.63 (range = 0.16–1.66 mg/ml). Heritability for intake after 6 generations was estimated to be 0.25, apparently for the divergence in intake between HARF and LARF lines. Most of the response to selection was evidently in the HARF line, as intake in the LARF lines was only reduced by about 30% from the foundation population values (Le et al. 2001). Subsequent studies showed that HARF animals had greater two-bottle preference drinking than LARF with continuous access and were more sensitive to the motor impairing effects of acute ethanol and diazepam. HARF and LARF did not differ in body weight or in metabolism of acute injections of ethanol (Le et al 2001; Shram et al 2004). We are aware of no other published data on their characteristics: these lines are extinct.
In an attempt to produce rodent lines that would drink to intoxication, we therefore developed a murine assay for binge-like drinking we called Drinking in the Dark, or DID (Rhodes et al. 2005). After establishing genetic variation across inbred strains (Rhodes et al. 2007), we initiated a genetic selection to produce a High Drinking in the Dark (HDID) mouse line and reported results with early selected generations (Crabbe et al. 2009; Crabbe et al. 2010). Here, we report progress with continued selection of both replicates of the HDID selected lines. We also report some responses differentiating the HDID lines from the non-selected controls that have arisen as selected correlated responses to selection, as well as analyses of the genetic features and topography of DID drinking in these mice.
METHODS
Husbandry
Our animal facility and husbandry procedures are consistent with those previously reported (Crabbe et al. 2011). All mice were born in our colonies at the Portland VA Medical Center, an AAALAC approved facility since 1971. All procedures were in accordance with the VA Institutional Animal Care and Use Committee and were performed according to NIH Guidelines for the Care and Use of Laboratory Animals. Mice were maintained at 21 ± 1 °C in plastic cages (19 × 31 × 13 cm) on Bed-o-cob bedding (Andersons, Maumee, OH) with tap water and Purina 5001 chow (PMI Nutrition International, Brentwood, MO) at all times (for exceptions, see Drinking in the Dark section). The 12h:12h light:dark (L:D) cycle had lights on from 0600-1800 (see Drinking in the dark section for cycle alterations). Pups were weaned and housed with same-sex littermates at postnatal day 21.
Animals
The foundation stock for the selective breeding was HS/Npt (HS), created by Dr. Robert Hitzemann at SUNY-Stony Brook from the intercrosses of 8 standard inbred strains (Hitzemann et al. 1994). Details of the production and maintenance of this stock through the first 61 generations were provided in an earlier publication (Crabbe et al. 2011). The High Drinking in the Dark-1 (HDID-1) selected line was initiated from the G53 generation of HS/Npt in 2005. The second replicate line (HDID-2) was initiated from G61 HS/Npt mice in 2008. We currently maintain a colony of HS/Npt with 48 mating pairs using a within-family rotational breeding scheme. An occasional missing family is replaced with another family approximately 8 or more rotational steps distant (e.g., a missing Family 2 would be replaced with a family ≥ 10).
Drinking in the dark (DID)
Details of the DID assay have been published elsewhere [(Crabbe et al. 2009;Crabbe et al. 2010); for a practical guide to the implementation of the phenotypic assay, see http://www.scripps.edu/california/research/inia/modelmousedrinkingindark.pdf]. To acclimate to a reversed L:D schedule, mice are housed individually for two weeks on a L:D schedule with lights on at 2130 h and off at 0930 h. All DID tests are performed only after acclimation and using red light only during the dark cycle. Starting at 1230 h, 3 h into the dark cycle, the animal’s water bottle is replaced with a graduated tube offering 20% ethanol in tap water (v/v) for 2 hr. At the end of the drinking session, the volume is again recorded and water is returned. Twenty-four h later, this procedure is repeated. Tube volume is read at 2 h, and the tube is left in place for 2 h longer. At 4 h, the final volume is read and a blood sample (20 μl) is drawn with a capillary tube from the periorbital sinus to assess BEC. Tube leakage is assessed from bottles on two cages not containing animals, and average leakage is used as a correction factor.
Selective breeding
The selection method for the HDID-1 line was described earlier (Crabbe et al. 2009) as were the amended procedures used for HDID-2 (Crabbe et al. 2010). A within-family rotational mating scheme was used for the first 5 generations of HDID-1. From S5 on, and throughout the entire course of the HDID-2 selection, quasi-random mating was employed, strictly avoiding mating animals with common grandparents. The selection index was the BEC attained after the second day of DID, i.e., at the end of the 4 h drinking session.
DID - hourly BECs
Only female mice were used for this experiment. Due to availability, the replicate lines were tested in separate batches, 10 weks apart. Mice were 53-96 days old at the start of testing. Mice were acclimated to reversed L:D cycle for 2 weeks while singly housed. All mice were given the 2-day DID test used to select mice for breeding (Crabbe et al. 2009). Mice within cages were assigned pseudorandomly to time Groups 1-5. Group 5 had a blood sample drawn from the peri-orbital sinus at the end of the 2 hr drinking session on Day 1, and again after 4 hr of drinking on Day 2. Groups 1-4 were sampled after drinking on Day 2 for 1, 2, 3, or 4 hr, respectively.
DID - withdrawal testing
The replicate lines were tested in separate experiments. Each experiment was balanced across sexes and treatment conditions. We wanted to use generations with approximately equivalent BECs after drinking, so we tested S22 HDID-1 mice that were 78-85 days old at the start of the experiments. Eighteen months later, we tested S19 HDID-2 mice that were 88-94 days old. Males and females were acclimated to reverse L:D cycle for 2 weeks while singly housed and assigned to receive access to either water or 20% ethanol during the DID test. On the first day, one hour before lights out (0830), each mouse was scored for a baseline handling induced convulsion (HIC). The HIC is a sign of mild central nervous system excitability and is scored by picking the mouse up by the tail and, if necessary, spinning it through a 180 degree arc. Scores range from 0 (no convulsion, even after spin) through 7 (lethal tonic hind limb extensor seizure, spontaneous or elicited by lifting the cage lid) and the scale has been detailed elsewhere (Metten & Crabbe 2005). The HIC waxes and wanes over several hours during withdrawal from ethanol and provides a quantitative index of the severity of ethanol withdrawal (Goldstein & Pal 1971;Goldstein 1972;Metten & Crabbe 1994;Metten & Crabbe 2005). Following an early report that a single anesthetic dose of ethanol in mice could produce increases in susceptibility to chemical convulsants several hours after the ethanol treatment into withdrawal (McQuarrie & Fingl 1958), we have used it extensively to characterize genetic differences in the sensitivity to acute ethanol withdrawal following a 4 g/kg intraperitoneal dose (Metten & Crabbe 1994).
Mice were then tested for a total of 4 days for DID, using our established method (Rhodes et al. 2005). On Days 1-3, mice were given access to a single bottle of either water or 20% ethanol in water (v/v) for 2 hr and intake was recorded. On the 4th day, intake was recorded after 2 hr, and again at 4 hr. Each mouse was assessed for HIC, then had a 20 μl blood sample drawn from the periorbital sinus with a capillary tube, and HIC scores were assessed hourly for 6 more hr.
Ethanol metabolism
Male and female mice (n = 144) were 59-73 days old at the start of testing. In order to test HDID-1, HDID-2 and HS mice at the same time, mice were tested in 4 batches. Six mice of each sex and genotype were tested in each batch; the entire experiment was completed within 6 weeks. Each mouse was weighed and given 2.5 g/kg ethanol, ip (.0158mL/g body weight), a dose consistent with moderate intoxication. To reduce the number of mice, we assigned each mouse to have two blood samples drawn from the tip of the tail at different times. Mice were assigned to be sampled at either 15 or 30 min. Thereafter, balanced subgroups of mice initially sampled at 15 or 30 min were assigned to have a second sample drawn at either 60, 90, 120, or 180 min after injection.
Ethanol and blood ethanol concentrations
Ethanol (Decon Laboratories, Inc., King of Prussia, PA) was mixed 20% v/v in tap water daily. Blood samples were assayed for ethanol concentration using gas chromatography as previously described (Rustay & Crabbe 2004).
Statistical analysis
All analyses were conducted with regression based statistics, as detailed for each experiment in the Results section below.
RESULTS
Selective breeding
Selection response of HDID-1 mice through generation S27 is shown in Fig. 1 (Panel A). Mice now attain an average BEC of about 1.42 mg/ml, a 4.7-fold increase from the average BEC (0.30 mg/ml) of the starting HS population. The independent replication of this selection through S20 is also shown. Average BEC’s in the HDID-2 mice now exceed 1.0 mg/ml, as did the HDID-1 mice at the same point during selection, a 4.0-fold increase across generations. Although g/kg ethanol intake during the DID test plays no role in the choice of mating pairs, Fig. 1 (Panel B) shows that it has increased in both replicates as a correlated response to selection. S27 HDID-1 and S20 HDID-2 mice now drink approximately 7.1 g/kg during their DID test; these amounts represent increases of 80% in HDID-1 and 60% in HDID-2 when compared with the intakes of their respective S0 cohorts. Fig. 2 shows that increasing proportions of HDID-1 and HDID-2 mice have attained BECs greater than 1.0 mg/ml each generation; in the current generation, 80% of HDID-1 and 50% of HDID-2 mice reach BECs > 1.0 mg/ml. Eighteen percent of HDID-1 and nearly 9% of HDID-2 mice now reach BECs > 2.0 mg/ml.
Figure 1.
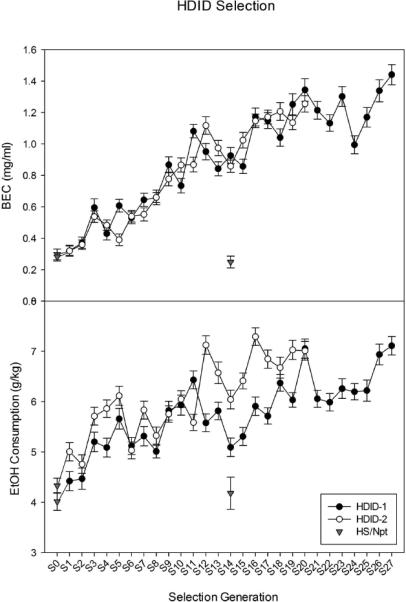
Response to selection for high BEC after 4 hr of access to ethanol on Day 2 of the DID test across 27 (HDID-1) and 20 (HDID-2) selected generations. Panel A. Mean ± SEM is shown. Solid symbols = HDID-1; open symbols = HDID-2. Each data point is the average for 98-266 mice, approximately half female and half male (for numbers each generation, see Supplementary Table 1). Panel B. Corresponding ethanol intake on Day 2 for the mice in Panel A each generation. Selection index was BEC; data from Panel B represent a correlated response to selection. In both panels, data from the unselected HS/Npt control line, which is shared by both replicates, are shown in inverted triangles. Data shown as S0 for both replicates were HS/Npt mice. HS/Npt mice (N = 210) were tested about the time of S6 for HDID-1 to form the founding population for the selection of HDID-2. HS/Npt mice (N = 25) were also tested contemporaneously with HDID-2 S14 mice: at this time, the HDID-1 line was in S19. These HS data points (representing about half male and half female mice at each time) are shown at generation S14.
Figure 2.
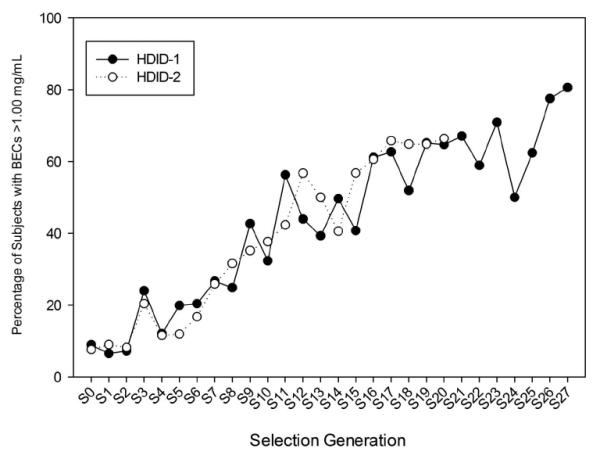
Percent of population tested that reached BEC ≥ 1.0 mg/ml each generation. Closed symbols, HDID-1. Open symbols, HDID-2.
Details of the data collected during selective breeding are given in Supplementary Table I (Table S1). Table S1 gives numbers tested each generation; BEC; selection differential (S; see below); 4 hr consumption (g/kg); age; and body weight. Table S2 gives for each generation the number of families that successfully mated to produce the next generation; the effective breeding size (Ne) of the breeding population; and the cumulative inbreeding coefficient (ΔF)(Falconer & Mackay 1996).
Fig. 3 shows the realized response to selection (R, the difference between average BEC that generation and the BEC in S0) plotted vs selection differential cumulated across generations for the HDID-1 and HDID-2 lines. The selection differential (S) is the difference between the BEC of those animals selected as parents to produce the next generation and the average BEC for the population from which they were selected. The slope of the linear regression of R on cumulative S yields an estimate of heritability, the proportion of individual differences that can be attributed to additive genetic (heritable) differences (Falconer & Mackay 1996). Heritability after 11 selected generations was h2 = 0.09 for both HDID-1 and HDID-2. The linear fit for both regressions was good (R2 = .85 and .90, respectively). As the HDID lines (especially HDID-1) may be reaching a limit in their response to selection (see Fig. 1), we also estimated heritabilities through the first 19 selected generations. This yielded estimates of h2 = 0.07 for both HDID-1 and HDID-2 (R2 = .88 and .93, respectively). By S26, response to selection in HDID-1 was clearly flattening (h2 = 0.05, R2 = .82). When we estimated heritability using only generations S20 – S26, we saw h2 = 0.04, R2 = .24. This is an expected result of the depletion of additive genetic variance as genes affecting DID become fixed homozygously. As the best estimates of realized heritability are derived in early generations, before R/S slope departs from linearity, we conclude that initial heritability is 0.09 in both replicate lines, estimated from generations S0 – S11.
Figure 3.
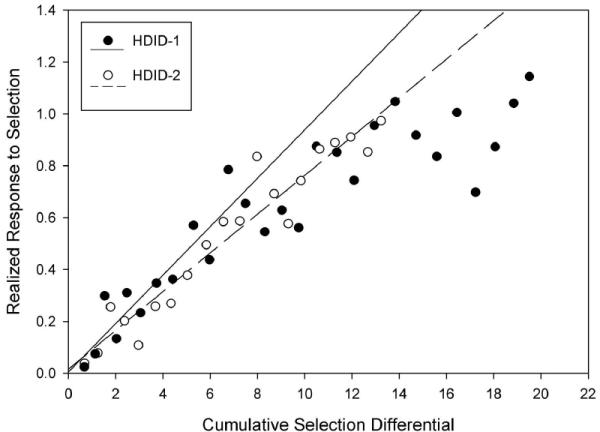
Realized response to selection vs cumulative selection differential across 27 (HDID-1) or 20 (HDID-2) generations. Solid symbols = HDID-1; open symbols = HDID-2. Realized response to selection at selection generation N (RN) is the difference between BEC at the Nth generation and mean BEC at generation S0. Selection differential (S) at each generation is the difference in BEC between individuals selected as parents and the mean BEC of the population from which they were chosen. For example, the 171 individuals comprising the S2 generation for HDID-2 reached BECs averaging 0.36 mg/ml, and the 44 parents selected for mating to generate the S1 generation averaged BECs of 0.90 mg/ml, yielding S = 0.54 mg/ml. Generation S3 offspring averaged BECs of 0.54 mg/ml, showing a total realized response to selection of 0.26 mg/ml. Data are given in Supplementary Table 1. Linear regression of R on cumulative S across the first 11 selected generations is depicted separately for each replicate. Solid line = HDID-1; dashed line = HDID-2. Slope of these lines yields estimates of heritability (see text). Units for both axes are mg ethanol/ml blood, but axes of R vs S plots are not labeled by convention.
That the heritability estimated for HDID-1 was clearly lower when data for generations beyond S11 were included suggests that the pool of additive genetic variation influencing DID is becoming depleted, an expected result of long-term intense selection. To insure that the flattening of response in later generations of HDID-1 was not simply due to systematic reduction in selection intensity in those generations, we regressed inter-generation S on generation number. We started with Generation S6 after which values of S ranged between 0.66 – 0.88 because for generations S0 – S5 we were employing within-family selection to reduce inbreeding, a method that yields lower values of S (See Table S1) because it systematically reduces variance in the number of breeders per family contributing to the next generation. For HDID-1, S averaged 0.74 ± 0.03 across generations S6 – S11; 0.77 ± 0.02 for generations S6 – S19; and 0.78 ± 0.02 across generations S6 – S26. Neither of the slopes of the latter two least squares linear regressions on generation number differed significantly from zero slope (range of slopes = 0.004 – 0.009). For HDID-2 values of S (range = 0.54 – 0.80) averaged 0.66 ± 0.02 for both S1 – S11 and S1 – S19. Slopes of the regressions were 0.02 and 0.00, respectively. Thus, there was no systematic decline in S across generations, but rather a small, non-significant increase. We assume that the HDID-2 lines, too, will begin to reach an asymptotic level of BECs within the next few generations.
Because the individuals selected as parents on the basis of their BECs also drank more than the population from which they were drawn, it is possible to compute cumulative S and realized R for the correlated response, g/kg/4 hr. Although the fits to these regressions were not as strong (.38 ≤ R2 ≤ .65), interestingly, the estimated heritability of total intake on Day 2 was 0.10 and 0.09 through 11 generations for HDID-1 and HDID-2, respectively.
We also had body weight data for all mice (Table S1). When we examined the pattern of average body weight across generations, there was an apparent declining trend for HDID-1 animals, and an apparent increasing trend for HDID-2 mice. Both trends continued unabated across all generations of selection in both sexes. However, the average age of the population tested each generation varied between 56 and 103 days. Across this age range, body weight obviously increases significantly. Also, on average, males weigh more than females at every age. Thus, we wanted to see whether body weight changed across generations independent of age of testing and sex. We estimated the overall growth curves for our mice by linear regression of weight on age for all 2,063 HDID-1 female mice tested across all generations. Using this idealized (but noisy) curve (R2 = .12), we then generated a predicted body weight for female HDID-1 mice for each generation based on the average age of the population that generation. Finally, we calculated the difference between the actual mean body weight and the predicted body weight. To assess whether HDID-1 female weights changed across generations in a systematic fashion, we then regressed the difference scores on generation number (see Fig. S1). There was a significant linear trend toward declining body weight across 26 generations (slope = −0.10 ± 0.01 g/generation, t = −7.1, p < .0001, R2 = .66). The equivalent analyses of body weight data for HDID-1 males yielded a slope = −0.11 ± 0.01, p < 0.0001. In contrast, significant positive slopes were seen for both female and male HDID-2 mice across 20 generations of selection (slopes = 0.08 ± 0.02 and 0.10 ± 0.03, respectively, both ps < 0.01).
Patterns of drinking
Besides drinking more, another way that mice could reach higher BECs would be to apportion their drinking to the latter part of the 4 hr session, which would lead to an increased tendency to detect a high BEC. We assessed this possibility using the intake data for the first 2 and second two hr on Day 2 of the DID test. Table S3 shows the proportion of total g/kg intake taken during the second two hours of access on Day 2 for several generations of HDID-1 and HDID-2 mice: this averaged about 60%. Regression of the mean scores on selected generation for data from all 27 generations of HDID-1 mice yielded a line with slope = −0.08 ± 0.48. This did not differ significantly from zero slope, indicating that mice in later generations are not drinking more of their total dose later in the access period. Data from 20 generations of HDID-2 mice also yielded an overall 60% intake during hrs 2-4. The regression with slope = −.34 ± 0.10 for HDID-2, which did differ significantly from zero (t = 3.26, p < 0.01). Thus, later generations of HDID-2 mice may be drinking a lesser proportion of their total dose during the last half of the session, but the rate of change amounts to only 0.15% per generation. Quantity ingested on Day 2 across the entire 4 hr test has clearly increased across generations (Fig 1). Intake on Day 1 has also increased from 1.8 to 3.0 g/kg for HDID-1 (67%) and from 2.1 to 3.5 g/kg for HDID-2 (67%): these values are roughly similar to the increases across generations of 80% and 60%, respectively in g/kg intake across the 4 hr Day 2 test.
DID - hourly BECs
Fig. 4 shows BECs at the end of the first 2 hr access period on DID Day 1, and how BEC increased over time during the 4 hr DID test on Day 2. Fig. 5 shows the consumption of these groups (discussed below). We first analyzed the BEC data from Groups 1-4 separately, as these mice had not had a BEC drawn on Day 1 and therefore most closely represent the selection phenotype. There was a significant effect of Group (time) (F(3,44) = 9.5, p < 0.0001). Post hoc tests established that BECs after 3 and 4 hr of drinking did not differ significantly from each other. Strikingly, BEC after only 2 hr of drinking on Day 1 (Group 5) was almost as high as those seen near the end of drinking on Day 2. We also compared the Day 2 BECs of Groups 4 (no Day 1 BEC) and 5 (Day 1 BEC), and saw no significant effect of prior sampling on BEC in Group 5 (F(1,20) = 1.9, p = 0.18).
Figure 4.
Blood ethanol concentrations achieved by separate groups of HDID-1 (left panel) and HDID-2 (right panel) mice tested after 2 hr of drinking (Day 1) or 1, 2, 3, or 4 hr drinking on Day 2 (Groups 1-4, respectively). Group 5 was also tested after 4 hr drinking on Day 2 and had a second blood sample drawn. Mean ± SEM shown.
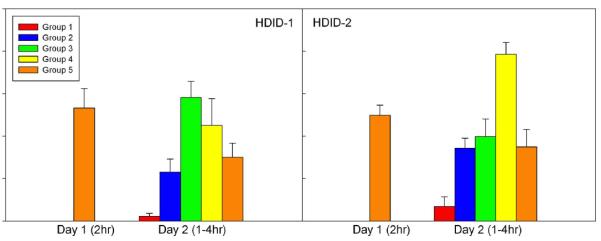
Figure 5.
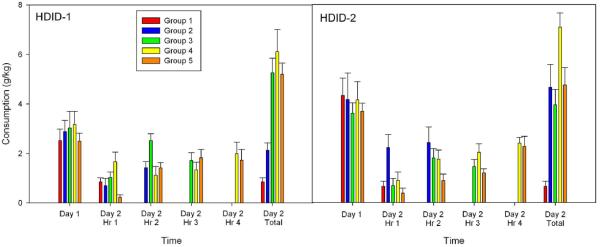
Intake in g/kg for Groups 1-5 on Days 1 and 2 of the DID test (see caption to Figure 4). Day 1 data represent consumption during 2 hr of drinking. Middle 4 sets of bars in each panel represent intake during 1 hr of drinking. Day 2 Total represent drinking across 1-4 hr depending on Group.
All 5 HDID-1 groups ingested similar doses of ethanol on Day 1 (Fig. 5, left-most bars: F(4,53) <1). Total ingestion on Day 2 paralleled the group differences in BECs (Fig. 5, right-most bars). Ingestion during the first hr was somewhat greater in the 4-hr group (Group 4) than the other groups (especially those mice (Group 5) that had been sampled on Day 1). Mice in Groups 3-5 drank equivalently during the third two-hr block, and drinking during hr 4 was very similar across the two remaining groups (Fig. 5, middle 4 sets of bars).
Analysis of HDID-2 mice showed similar results for the essential findings (Fig. 4). Groups 1-4 differed significantly on Day 2 BECs (F(3,28) = 24.4, p < 0.0001). HDID-2 mice reached higher BECs, averaging 2.0 mg/ml, but did not reach this peak until hr 4; Group 5 mice reached about the same level (1.2 mg/ml) after 2 hr of drinking on Day 1 as HDID-1 mice had. All 5 HDID-2 groups ingested similar levels on Day 1 (F <1), and hourly drinking resembled that seen in HDID-1 (Fig. 5). The only other difference between replicates was that prior sampling led to significantly lower BEC in Group 5 than in Group 4 for the HDID-2 mice [F(,1,14) = 18.8, p < 0.005].
DID - withdrawal
Results for the two replicate lines vs HS controls were analyzed separately. HIC scores taken before any treatment was given were low and did not differ significantly between HDID-1 males and females assigned to drink water or ethanol (all Fs ≤ 1.3). After drinking ethanol or water during the 4 day DID test, HIC scores at hr 0 (immediately after the 4 hr test on Day 4) were low, and also showed no average differences across treatment groups and sexes. To index withdrawal, we summed the HIC scores across post-drinking hrs 1-6 (see Fig. 6). While scores remained low in those mice that had been drinking water, ethanol-drinking mice showed a rebound increase characteristic of a mild withdrawal response. This response appeared to taper off somewhat during hrs 5 and 6 (data not shown). Total HIC scores differed significantly between water and ethanol-withdrawing mice [F(1,42) = 9.2, p < 0.005]. For the HDID-2 mice, the pattern of responses and results of the statistical analyses were very similar. Total HIC scores differed significantly between water and ethanol-withdrawing HDID-2 mice [F(1,46) = 5.8, p < 0.05]. Although no statistical comparison is appropriate across replicates, the apparently greater post-water HIC scores in HDID-2 as compared with HDID-1 has been noted before (Crabbe et al., 2012a).
Figure 6.
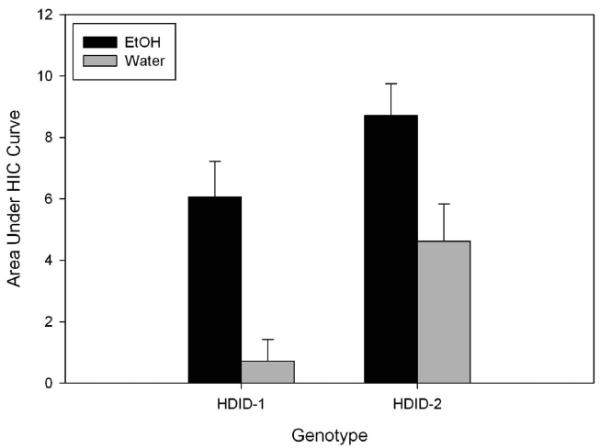
Area under the handling-induced convulsion curve for HDID-1 and HDID-2 mice during 6 hr after drinking ethanol or water in a 4 hr DID test. Means ± SEM shown.
Ethanol metabolism
Fig. 7 shows the absorption and elimination curves for BECs for all 3 genotypes. Five samples (3.5%) were uninterpretable and were eliminated. We first analyzed the data for the two groups tested at 15 or 30 minutes at those time points. The main effect of Genotype approached significance (F(2,129) = 2.9, p = 0.06). Mice reached significantly higher BECs at 30 min than 15 min (F(1,129) = 24.9, p < 0.0001), during the rising phase. There was a significant Genotype by Sex interaction (F(2, 129) = 3.0, p = 0.05). Post hoc testing showed that HDID-1 female mice reached significantly higher BECs than HS mice (Tukey’s HSD, p < 0.01). No other main effects or interactions were significant (all Fs < 1). We next analyzed the data from 60-180 min after injection (declining phase). The only significant finding was a main effect of Time Point (F(3,118) = 29.5, p < 0.0001). All other main effects and interactions were non-significant (all Fs < 1), including that of Genotype (p = 0.14). We conclude that HDID-1 mice tend to reach higher BECs than HS, but that all 3 genotypes eliminate ethanol at approximately the same rate.
Figure 7.
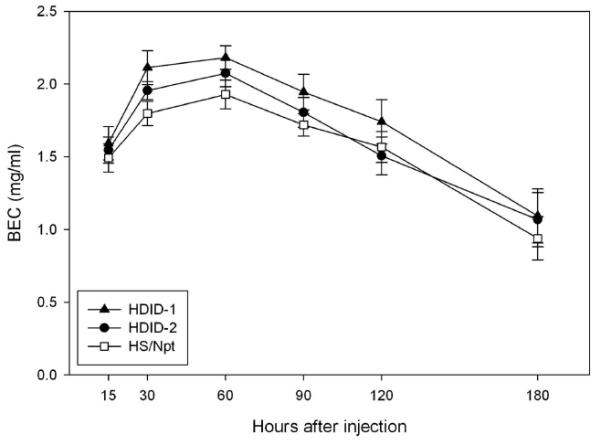
Blood ethanol levels in HDID-1, HDID-2 and HS mice following acute ip injection of a 2.25 g/kg dose of ethanol. For timing of blood sampling and statistical analyses, see text.
DISCUSSION
Alcoholism is a chronic, relapsing disease, and those who suffer from alcohol dependence typically drink both too frequently and too much at one time. While not all alcoholics drink in binge-like patterns, most do, and binge drinking at an early age is a potent lifetime risk factor. While numerous rodent lines have been genetically selected for their tendency to prefer 10% ethanol solutions to tap water, the HDID selection is the first based on the blood alcohol level achieved after drinking. It is also focused on their binge-like drinking during a relatively short session of access. The successful result of this selection now offers alcohol researchers a novel tool for exploring the genetic predisposition to binge.
Genetic features of the model
The heritability of the trait is relatively low compared to other alcohol phenotypes estimated in rodent populations. This was apparent from the many generations of selection needed before BECs were elevated to levels resembling binging humans. Despite explaining no more than 10% of individual differences in BEC, there was a steady accumulation of genetic influences in both replicates of the selection across 20 generations, leading to a 4- to 5-fold increase in BECs. In mice selectively bred for the duration of loss of righting reflex after an acute high dose of alcohol, the realized heritability for the difference between Long Sleep (LS) and Short Sleep (SS) mice was only 0.18, but the phenotypic difference between the lines after a few selected generations was greater than 10-fold (McClearn & Kakihana 1981).The low heritability and continued increase in response for many generations in HDID mice suggests at least a multigenic and probably polygenic mode of inheritance of this trait (see Falconer & Mackay 1996). One surprising feature of the project was the nearly perfect parallelism of the rate of response to selection in HDID-1 and HDID-2 mice (see Figs. 1-3). BECs increased about 0.04 – 0.05 mg/ml per generation for 20 generations in both lines. Despite the similar magnitude of selection intensities across generations (see Table S1), the response in the generation immediately following also varied quite a bit. For example, average BECs declined between generations S11 - S13 in the HDID-1 line despite relatively stable selection differentials for those generations (0.7-0.8). We do not know the reason for this variability and assume that it is stochastic and also is related to the declining heritability as additive genetic variance is diminished in later generations. With heritability less than 10%, environmental sources of variation are clearly important. That said, we cannot identify a pattern that parallels these generational vicissitudes in response in any environmental variable such as season when the animals were tested, or age at time of testing (data not shown). For both panels of Fig. 1, note that the populations of HDID-1 and HDID-2 mice for a given selected generation were tested at least 2 years apart. Thus, even where the pattern of responses of HDID-2 “ups and downs” across generations closely mimicked that seen in HDID-1, this cannot be attributed to an environmental source of influence that was working contemporaneously. Another reason for variation in generation means is that this was a unidirectional selection (high direction only). In the more typical bidirectional selection, the difference between the high and low selected lines is more stable since that difference largely corrects for environmental influences affecting both lines simultaneously in any generation.
Characteristics of drinking in the HDID lines
There are several things we want to learn from the HDID lines. Of immediate interest is how they are achieving these high BECs. For example, are they drinking too much, too frequently, or both? How are they patterning their drinking across the sessions? Using a rough index of drinking microstructure, we entertained the hypothesis that mice with high BECs after 4 hr might simply have been drinking more of their total dose later during the 4 hr session. However, this does not appear to be the primary basis upon which the genetic influences have operated during selectionThe other data we can bring to bear on drinking characteristics have been gleaned from studies with recent generations of mice that have responded to selection. The advantage of this sort of data is that hypotheses can be pursued with additional studies. Initial studies have taken advantage of an apparatus that monitors intake continuously (BioDAQ, Research Diets, New Brunswick, NJ) and show that male HDID-1 mice drink in larger bouts and tend to have more drinking bouts than HS mice during the DID test. They also seem to be drinking more efficiently, because bout duration does not differ between HDID-1 and HS (Barkley-Levenson & Crabbe 2012) and HDID-1 mice have a greater volume intake per lick than HS (unpublished data). Various limited-access drinking protocols have long been employed with other rodent genetic animal models. Some studies have shown that after fairly extensive training, rats will drink as much alcohol during limited access sessions as they will across an entire day of continuous access [e.g., Bell et al. 2011]. Microstructural analyses have shown that rats may drink more ethanol per drinking bout when access is short than when it is unrestricted (Marcucella et al. 1984). Comparable observations have been noted in male C57BL/6J mice, with mean bout sizes of 236 ± 9 and 130 ± 8 licks during 2-hr limited and 24 hr continuous access conditions, respectively (Ford et al., unpublished data).
Bell and colleagues conducted an experiment similar to that depicted in Figs. 4 & 5. After an extensive and complex history of access to multiple concentrations of alcohol for repeated, 1 hr periods during the circadian dark, adolescent P rats were sampled for intake and BEC at 15, 30, 45 or 60 min of drinking in the final session. Although intake was greatest during the first 15 min, the highest BECs were seen after 30 and 60 min. It is possible that these animals had shifted their intake to the earliest part of the session, but as the authors note, parallel groups sampled at those times during their first exposure to a 1 hr session would be required to be sure (Bell et al. 2011). When we examined C57BL/6J mice during their 4 hr DID session on the 4th day of ethanol access using lickometers and looked at sipper contacts in 30 min bins, we saw that males and females both showed more responses during the initial 30 min than during any other part of the session. Males also showed some tendency to drink more in the final 30 min time window. However, we did not previously report patterns during the first 3 days of DID drinking (Rhodes et al. 2007). We recently analyzed these data, and the spout contacts seen across the 2 hr sessions on Days 1-3 and during the first 2 hr on Day 4 are shown in 30 min bins for the male and female C57BL/6J mice (collapsed across sex: Fig. S2). Mice had more contacts during the first 30 min than during any of the other 30-min bins of access on all days, and they initially licked approximately 15% more in total on Day 1 than on Days 2-4. Changes in temporal distribution of licking from Day 1 to 4 were accompanied by shifts in underlying bout patterns, with steady declines in bout frequency (−18%) and bout duration (−57%) and a marked increase in bout lick rates (+95%) being most notable (data not shown). In an unpublished study where C57BL/6J mice were given repeated days of 2 hr ethanol access immediately after lights off, we saw significant variability in the partitioning of drinking across 30 min bins, though there was a tendency towards greater drinking in the last hour of testing. Intake during the first 30 min interval also showed a steady decrease over days, with mice eventually consuming very little during this time period. These data make it clear that there is no simple relationship between drinking microstructure and ingested dose during initial exposures to alcohol, but do suggest that drinking repertoires evolve with repeated exposure to a limited access condition (i.e., during acquisition of drinking).
The high BECs we saw after the HDID animals’ exposure to only 2 hr of drinking (Fig. 4) are consistent with the tendency of C57BL/6J mice to concentrate drinking early in the session upon inaugural ethanol exposure (Fig. S2), and the fact that animals did not reach peak BECs on Day 2 in our study until hr 3 (HDID-1) or 4 (HDID-2) was suggestive of a shift of the concentration of drinking to later in the session. Our available microstructure data in HDID-1 mice provides evidence for a similar shift from an early to a later concentration of drinking (Barkley-Levenson & Crabbe 2012). In a 2-day DID test, g/kg intake was greater during the first 30 min session on Day 1 than during the other 3 half-hr time bins for both HDID-1 and HS males. On Day 2, both genotypes showed low intakes during the first hr. HDID-1 mice then showed increased intakes during the final 2 hr of the test, while HS mice remained at low levels (Barkley-Levenson & Crabbe 2012). We have seen this pattern of consumption repeatedly in other DID experiments with HDID mice, but it is not always present and shows some degree of variability. However, when mice do have high intake on Day 1, low drinking early in the session on Day 2 is consistently observed (unpublished data). We therefore hypothesize that rapid early consumption during the first exposure to ethanol may result in the development of a mild conditioned taste aversion that is gradually overcome during the next drinking session(s). We have found that males of both HDID replicates are less sensitive to a taste aversion conditioned by ethanol injections than the HS mice (Barkley-Levenson et al in press), which could help explain the rebound in drinking during the latter half of the Day 2 test. Experiments are currently underway to test whether decreasing the g/kg intake (hence, the BECs reached) on Day 1, and therefore decreasing the likelihood of a conditioned taste aversion, will result in greater Day 2 intake and early session drinking in particular. When we examined the relationship between 2 hr intake on Day 1 and the first 2 hr intake on Day 2 across selected generations, we found that they were slightly reduced on Day 2: the patterns were very similar in both replicates, and were variable from generation to generation. The average reduction on Day 2 was slightly more than 6% for both HDID-1 and HDID-2 mice (data not shown). We do not know why we tend to see greater reductions in 2 hr intake between Days 1 and 2 in the BioDAQ microstructure studies than we do during the periodic home-cage assessments of DID conducted to ascertain the selection phenotype. It may simply reflect some physical/structural features of the monitoring system.
The importance of the patterning of drinking has long been known, and much evidence suggests that both drinking patterns and intakes differ depending on whether the animals are performing an operant response to gain periodic, scheduled access to ethanol or are proved unrestricted access from a sipper tube (Samson et al 2000; Samson & Czachowski 2002). However, the microstructure literature is generally derived from analyses of drinking patterns in animals that have extensive experience with alcohol. Two exceptions are studies that examined acquisition of ethanol intake in rat (Boyle et al., 1997) and mouse (Ford et al, 2008). Most relevant to the current work are unpublished observations from the experiments in Ford et al. (2008), where male C57BL/6J mice were provided a choice between 10% v/v ethanol and water during daily 2-hr sessions. Mice heavily concentrated their intake within the initial 20-min of access on Day 1, and then progressively elevated their total intakes over Days 2-7 by additionally drinking increasingly more in the latter half of the session. This pattern of acquisition and shift in the temporal distribution of licks over repeated sessions is largely consistent with behavior of both HDID and male C57BL/6J mice provided only a single bottle of 20% v/v ethanol in the DID procedure.
It is clear that more data will be needed to clarify the role of microstructure on BEC during the DID test as well as its potential role in the genetic differences underlying the response to selection. A recent analysis of drinking microstructure in C57BL/6J mice employed a schedule-induced polydipsia paradigm that elicits substantial increases over baseline intake and resulting BEC after many weeks of drinking. Although there are many differences between this procedure and DID, the C57BL/6J mice in this study showed a near doubling of their achieved BEC with no change in total intake in a 60 min session. The BEC increases were due to increased drinking rate and augmentation in the size of the first bout (Ford et al, in press). We are convinced that the HDID mice have developed differences in their patterning of drinking that will explain their elevated BECs without changes in their ethanol metabolism or very large changes in their total intake during a session. However, we do not currently possess the appropriate data to ascertain what those patterning changes are.
Other features of the selection
Interestingly, the 9-10% heritabilities estimated for g/kg intake on the test day were nearly identical to those for the selected trait, BEC. Selection intensity for intake was far less than that for BEC, consistent with the lesser change in intake across generations. To our knowledge, all other selections for ethanol drinking excluding the HARF/LARF rats and HAP/LAP mice have been based on average daily preference ratios (amount of 10% ethanol drunk/total fluid drunk). While high preference lines (P, HAD, AA, & sP rats; HAP mice) all have demonstrably higher g/kg intake than their corresponding low preference lines (NP,LAD,ANA, sNP, LAP), we are not aware of any formal estimates of the heritability of the correlated response (intake) from these lines (Crabbe et al., 2010).
The phenotypic correlations (rP) between BEC and g/kg intake on Day 2 for each generation of HDID-1 and HDID-2 mice varied within a moderate range. For HDID-1, the mean correlation coefficients were r = 0.55 ± 0.01 (range = 0.43 – 0.66), and for HDID-2, the means were rP = 0.48 ± 0.02 (range = 0.30 – 0.62). Visual inspection of these correlations across generations revealed no change with increasing selection in either replicate line (data not shown). This is completely consistent with the apparent steady increase in both BEC and g/kg intake across all 19 generations in HDID-2 mice (see Fig 1, Panels A vs B). The heritability estimates for BEC in HDID-2 were essentially the same across 11 and 20 generations, indicating that the selection response is still linear. Furthermore, the pattern of changes across generations for BEC and intake were also consistent. For HDID-1, as the heritability estimates declined from S11 to S27, there was also an apparent reduction in the rate of increase in g/kg intake in HDID-1 after a few generations.
These correlations are between phenotypes and therefore reflect both heritable genetic and environmental sources of covariation. The structure of phenotypic correlations is expected to change across generations of selection as additive genetic variance is depleted. Because the response to selection is declining, we believe additive genetic variance is declining. It is possible to estimate the genetic correlation (rG) between the BEC and ethanol intake (g/kg) phenotypes, which indexes the degree to which the two traits share common genetic influences (Crabbe et al., 1990; Falconer and Mackay, 1996). These genetic correlations were calculated by correlating the generation means shown in Fig 1 from S0 to S19 for both traits: during these generations a linear selection response was observed, and there were sufficient generations upon which to derive a reasonable estimate. The estimates were rG = 0.83 for HDID-1 and 0.88 for HDID-2. Given the observed phenotypic correlations of 0.48 for HDID-1 and 0.55 for HDID-2 noted above, and the heritability estimates reported above for both traits of 0.07 to 0.09, the environmental correlation (rE) can also be estimated based on Equation 19.1 of Falconer and Mackay (1996). For both replicates, rE was estimated to be approximately 0.48 - 0.49, which indexes the magnitude of common environmental influences on the observed phenotypic correlation between these two phenotypes. Thus, we conclude that common genetic influences were more important than environmental influences in determining the similarity between BEC and intake for HDID mice.
We detected a small difference in ethanol pharmacokinetics between HDID and HS mice given 2.5 g/kg ethanol (see Fig. 7). Both the slightly higher values reached by HDID-1 mice compared to HS and the lack of a difference in subsequent elimination rate were consistent with our finding from a mixed group of older HDID-1 female and male mice in S11 given 2.0 g/kg (Crabbe et al 2009). In contrast, female and male mice from S18 of HDID-1 and S11 of HDID 2 did not differ in BECs 10-15 min after injection of 1.4 g/kg or 2.0 g/kg, respectively (Crabbe et al 2012). Across the fairly narrow range of post-DID BECs, we have not found behavioral intoxication to be significantly predicted by BEC (unpublished data). More generally, across numerous inbred strains and in numerous behavioral assays reflecting intoxication, strain differences in BEC have been unable to account for strain differences in behavioral sensitivity (Crabbe et al 2005). Differences in ethanol metabolism do not appear to be strongly genetically correlated with tendency to engage in high drinking in the dark.
In conclusion, we have successfully created two lines of mice that drink sufficient ethanol under limited access conditions to achieve intoxicating blood alcohol levels. While BEC, on which selection has been based, and g/kg intake have both systematically increased across generations, the degree of change in intake is not sufficient to explain the degree of change in BECs. Several aspects of alcohol drinking microstructure differ between HDID mice and their non-selected HS controls, and future studies will continue to explore the role of ethanol’s hedonic effects as well as other possible explanations underlying the trait. These mice are available to any interested investigator.
Supplementary Material
Supplementary Figure S1. Difference between age-predicted and actual mean population weight for HDID-1 female mice each generation of selection. Predicted weights were derived from the overall regression of weight on age from all mice in all generations. Line shows least squares linear regression of these difference scores on generation number. See text for statistical analyses.
Supplementary Figure S2. Number of licks at a spout containing 20% ethanol in 30 min time bins across 4 days of exposure to alcohol for 2 hr sessions in male and female C57BL/6J mice. Means ± SEM shown. ***P < 0.001 versus 0-30 min interval in Session 1. Data (collapsed on sex) are from Experiment 1 in Rhodes et al (2007), with permission.
Acknowledgments
These studies were supported by grants from the US Department of Veterans Affairs, by NIH grants AA013519, AA010760, and AA020245 from the NIAAA; by NIH grant OD11092; and by Dept. of the Army/DoD-TATRC Grant 10245005.05. AB-L was supported by NIAAA grant AA022009 and an OHSU Graduate Research Scholar Award. The authors confirm that they have no conflicts of interest, such as relationship, financial or otherwise, that might be perceived as influencing an author’s objectivity.
References
- Barkley-Levenson AM, Crabbe JC. Ethanol drinking microstructure of a High Drinking in the Dark selected mouse line. Alcohol Clin Exp Res. 2012;36:1330–1339. doi: 10.1111/j.1530-0277.2012.01749.x. [DOI] [PMC free article] [PubMed] [Google Scholar]
- Barkley-Levenson AM, Cunningham CL, Smitasin PJ,, Crabbe JC. Rewarding and aversive effects of ethanol in High Drinking in the Dark selectively bred mice. Addict Biol. 2013 Jul 30; doi: 10.1111/adb.12079. doi: 10.1111/adb.12079. [Epub ahead of print] [DOI] [PMC free article] [PubMed] [Google Scholar]
- Bell RL, Rodd ZA, Smith RJ, Toalston JE, Franklin KM, McBride WJ. Modeling binge-like ethanol drinking by peri-adolescent and adult P rats. Pharmacol Biochem Behav. 2011;100:90–97. doi: 10.1016/j.pbb.2011.07.017. [DOI] [PMC free article] [PubMed] [Google Scholar]
- Boyle AE, Smith BR, Amit Z. A descriptive analysis of the structure and temporal pattern of voluntary ethanol intake within an acquisition paradigm. J Stud Alcohol. 1997;58:382–391. doi: 10.15288/jsa.1997.58.382. [DOI] [PubMed] [Google Scholar]
- Crabbe JC. Translational behaviour-genetic studies of alcohol: are we there yet? Genes Brain Behav. 2012;11:375–386. doi: 10.1111/j.1601-183X.2012.00798.x. [DOI] [PMC free article] [PubMed] [Google Scholar]
- Crabbe JC. Rodent Models of Genetic Contributions to Motivation to Abuse Alcohol. In: Stoltenberg SF, editor. Genes and the Motivation to Use Substances. Springer; New York: 2013. in press. [Google Scholar]
- Crabbe JC, Colville AM, Kruse LC, Cameron AJ, Spence SE, Schlumbohm JP, Huang LC, Metten P. Ethanol tolerance and withdrawal severity in High Drinking in the Dark selectively bred mice. Alcohol Clin Exp Res. 2012a;36:1152–1161. doi: 10.1111/j.1530-0277.2011.01715.x. [DOI] [PMC free article] [PubMed] [Google Scholar]
- Crabbe JC, Kruse LC, Colville AM, Cameron AJ, Spence SE, Schlumbohm JP, Huang LC, Metten P. Ethanol sensitivity in high drinking in the dark selectively bred mice. Alcohol Clin Exp Res. 2012b;36:1162–1170. doi: 10.1111/j.1530-0277.2012.01735.x. [DOI] [PMC free article] [PubMed] [Google Scholar]
- Crabbe JC, Metten P, Cameron AJ, Wahlsten D. An analysis of the genetics of alcohol intoxication in inbred mice. Neurosci Biobehav Rev. 2005;28:785–802. doi: 10.1016/j.neubiorev.2004.08.002. [DOI] [PubMed] [Google Scholar]
- Crabbe JC, Metten P, Rhodes JS, Yu C-H, Brown LL, Phillips TJ, Finn DA. A line of mice selected for high blood ethanol concentrations shows drinking in the dark to intoxication. Biol Psychiat. 2009;65:662–670. doi: 10.1016/j.biopsych.2008.11.002. [DOI] [PMC free article] [PubMed] [Google Scholar]
- Crabbe JC, Phillips TJ, Belknap JK. The complexity of alcohol drinking: studies in rodent genetic models. Behav Genet. 2010;40:737–750. doi: 10.1007/s10519-010-9371-z. [DOI] [PMC free article] [PubMed] [Google Scholar]
- Crabbe JC, Phillips TJ, Kosobud A, Belknap JK. Estimation of genetic correlation: interpretation of experiments using slelctively bred and inbred animals. Alcohol Clin Exp Res. 1990;14:141–151. doi: 10.1111/j.1530-0277.1990.tb00461.x. [DOI] [PubMed] [Google Scholar]
- Crabbe JC, Spence SE, Brown LL, Metten P. Alcohol preference drinking in a mouse line selectively bred for high drinking in the dark. Alcohol. 2011;45:427–440. doi: 10.1016/j.alcohol.2010.12.001. [DOI] [PMC free article] [PubMed] [Google Scholar]
- Cranford JA, McCabe SE, Boyd CJ. A new measure of binge drinking: prevalence and correlates in a probability sample of undergraduates. Alcohol Clin Exp Res. 2006;30:1896–1905. doi: 10.1111/j.1530-0277.2006.00234.x. [DOI] [PMC free article] [PubMed] [Google Scholar]
- Falconer DS, Mackay TFC. Introduction to Quantitative Genetics. Longman; Harlow, England: 1996. [Google Scholar]
- Ford MM, Steele AM, McCracken AD, Finn DA, Grant KA. The relationship between adjunctive drinking, blood ethanol concentration and plasma corticosterone across fixed-time intervals of food delivery in two inbred mouse strains. Psychoneuroendocrinology, epub ahead of print. 2013 doi: 10.1016/j.psyneuen.2013.06.011. [DOI] [PMC free article] [PubMed] [Google Scholar]
- Ford MM, Yoneyama N, Strong MN, Fretwell A, Tanchuck M, Finn DA. Inhibition of 5alpha-reduced steroid biosynthesis impedes acquisition of ethanol drinking in male C57BL/6J mice. Alcohol Clin Exp Res. 2008;32:1408–1416. doi: 10.1111/j.1530-0277.2008.00718.x. [DOI] [PMC free article] [PubMed] [Google Scholar]
- Goldstein DB. Relationship of alcohol dose to intensity of withdrawal signs in mice. J Pharmacol Exp Ther. 1972;180:203–215. [PubMed] [Google Scholar]
- Goldstein DB, Pal N. Alcohol dependence produced in mice by inhalation of ethanol: grading the withdrawal reaction. Science. 1971;172:288–290. doi: 10.1126/science.172.3980.288. [DOI] [PubMed] [Google Scholar]
- Hitzemann B, Dains K, Kanes S, Hitzemann R. Further studies on the relationship between dopamine cell density and haloperidol-induced catalepsy. J Pharmacol Exp Ther. 1994;271:969–976. [PubMed] [Google Scholar]
- Iancu OD, Overbeck D, Darakjian P, Metten P, McWeeney S, Crabbe JC, Hitzemann R. Selection for drinking in the dark alters brain gene coexpression networks. Alcohol Clin Exp Res. 2013 doi: 10.1111/acer.12100. epub ahead of print. [DOI] [PMC free article] [PubMed] [Google Scholar]
- Le AD, Israel Y, Juzytsch W, Quan B, Harding S. Genetic selection for high and low alcohol consumption in a limited access paradigm. Alcohol Clin Exp Res. 2001;25:1613–1620. doi: 10.1111/j.1530-0277.2001.tb02168.x. [DOI] [PubMed] [Google Scholar]
- Marcucella H, Munro I. Ethanol consumption of free feeding animals during restricted ethanol access. Alcohol Drug Res. 1987;7:405–414. [PubMed] [Google Scholar]
- Marcucella H, Munro I, MacDonall JS. Patterns of ethanol consumption as a function of the schedule of ethanol access. J Pharmacol Exp Ther. 1984;230:658–664. [PubMed] [Google Scholar]
- McClearn GE, Kakihana R. Selective Breeding for Ethanol Sensitivity: Short-Sleep and Long-Sleep Mice. In: McClearn GE, Deitrich RA, Erwin VG, editors. Development of Animal Models as Pharmacogenetic Tools. USDHHS; NIAAA, Rockville, MD: 1981. pp. 147–159. [Google Scholar]
- McClearn GE, Rodgers DA. Differences in alcohol preference among inbred strains of mice. Quart J Stud Alcohol. 1959;20:691–695. [Google Scholar]
- McQuarrie DG, Fingl E. Effects of single doses and chronic administration of ethanol on experimental seizures in mice. J Pharmacol Exp Ther. 1958;124:264–271. [PubMed] [Google Scholar]
- Metten P, Crabbe JC. Common genetic determinants of severity of acute withdrawal from ethanol, pentobarbital and diazepam in inbred mice. Behav Pharmacol. 1994;5:533–547. doi: 10.1097/00008877-199408000-00014. [DOI] [PubMed] [Google Scholar]
- Metten P, Crabbe JC. Alcohol withdrawal severity in inbred mouse (Mus musculus) strains. Behav Neurosci. 2005;119:911–925. doi: 10.1037/0735-7044.119.4.911. [DOI] [PubMed] [Google Scholar]
- Mulligan MK, Ponomarev I, Hitzemann RJ, Belknap JK, Tabakoff B, Harris RA, Crabbe JC, Blednov Y, Grahame NJ, Phillips TJ, Finn DA, Hoffman PL, Iyer VR, Koob GF, Bergeson SE. Toward understanding the genetics of alcohol drinking through transcriptome meta-analysis. Proc Natl Acad Sci USA. 2006;103:6368–6373. doi: 10.1073/pnas.0510188103. [DOI] [PMC free article] [PubMed] [Google Scholar]
- Naimi TS, Nelson DE, Brewer RD. The intensity of binge alcohol consumption among U.S. adults. Am J Prev Med. 2010;38:201–207. doi: 10.1016/j.amepre.2009.09.039. [DOI] [PubMed] [Google Scholar]
- NIAAA . NIAAA Council Approves Definition of Binge Drinking. DHHS-NIH; Bethesda, MD: 2004. p. 3. [Google Scholar]
- Rhodes JS, Best K, Belknap JK, Finn DA, Crabbe JC. Evaluation of a simple model of ethanol drinking to intoxication in C57BL/6J mice. Physiol Behav. 2005;84:53–63. doi: 10.1016/j.physbeh.2004.10.007. [DOI] [PubMed] [Google Scholar]
- Rhodes JS, Ford MM, Yu C-H, Brown LL, Finn DA, Garland T, Jr., Crabbe JC. Mouse inbred strain differences in ethanol drinking to intoxication. Genes Brain Behav. 2007;6:1–18. doi: 10.1111/j.1601-183X.2006.00210.x. [DOI] [PubMed] [Google Scholar]
- Rodgers DA, McClearn GE. Mouse strain differences in preference for various concentrations of alcohol. Quart J Stud Alcohol. 1962;231:26–33. [PubMed] [Google Scholar]
- Rustay NR, Crabbe JC. Genetic analysis of rapid tolerance to ethanol's incoordinating effects in mice: Inbred strains and artificial selection. Behav Genet. 2004;34:441–451. doi: 10.1023/B:BEGE.0000023649.60539.dd. [DOI] [PubMed] [Google Scholar]
- Saba LM, Bennett B, Hoffman PL, Barcomb K, Ishii T, Kechris K, Tabakoff B. A systems genetic analysis of alcohol drinking by mice, rats and men: influence of brain GABAergic transmission. Neuropharmacology. 2011;60:1269–1280. doi: 10.1016/j.neuropharm.2010.12.019. [DOI] [PMC free article] [PubMed] [Google Scholar]
- Samson HH, Czachowski CL. Behavioral measures of alcohol self-administration and intake control: rodent models. Int Rev Neurobiol. 2002;54:107–143. doi: 10.1016/s0074-7742(03)54004-1. [DOI] [PubMed] [Google Scholar]
- Samson HH, Czachowski CL, Slawecki CJ. A new assessment of the ability of oral ethanol to function as a reinforcing stimulus. Alcohol Clin Exp Res. 2000;24:766–773. [PubMed] [Google Scholar]
- Shram MJ, Bahroos M, Beleskey JI, Tampakeras M, Le AD, Tomkins DM. Motor impairing effects of ethanol and diazepam in rats selectively bred for high and low ethanol consumption in a limited-access paradigm. Alcohol Clin Exp Res. 2004;28:1814–1821. doi: 10.1097/01.alc.0000148105.79934.14. [DOI] [PubMed] [Google Scholar]
- Wahlsten D, Bachmanov A, Finn DA, Crabbe JC. Stability of inbred mouse strain differences in behavior and brain size between laboratories and across decades. Proc Natl Acad Sci USA. 2006;103:16364–16369. doi: 10.1073/pnas.0605342103. [DOI] [PMC free article] [PubMed] [Google Scholar]
Associated Data
This section collects any data citations, data availability statements, or supplementary materials included in this article.
Supplementary Materials
Supplementary Figure S1. Difference between age-predicted and actual mean population weight for HDID-1 female mice each generation of selection. Predicted weights were derived from the overall regression of weight on age from all mice in all generations. Line shows least squares linear regression of these difference scores on generation number. See text for statistical analyses.
Supplementary Figure S2. Number of licks at a spout containing 20% ethanol in 30 min time bins across 4 days of exposure to alcohol for 2 hr sessions in male and female C57BL/6J mice. Means ± SEM shown. ***P < 0.001 versus 0-30 min interval in Session 1. Data (collapsed on sex) are from Experiment 1 in Rhodes et al (2007), with permission.