

Abstract
Individual mice differ in the dose of ethanol they will ingest voluntarily when it is offered during limited access periods in the circadian dark, a phenotype called drinking in the dark (DID). Substantial genetic variation in DID has been reported across a few standard inbred mouse strains, and a line of High Drinking in the Dark (HDID) mice has been established through selective breeding on the blood ethanol concentration (BEC) they attain at the end of a drinking session. Here, we report ethanol DID data for 23 inbred mouse strains, including 11 not previously reported, corroborating the genetic contributions to this trait. We also report data on a different ethanol drinking trait, the increased intake seen after multiple cycles of chronic intermittent exposure to ethanol vapor (CIE). Drinking escalated significantly during ethanol withdrawal. However, HDID mice and their HS controls showed equivalent escalation during withdrawal, demonstrating that withdrawal-associated drinking escalation is not a clear genetic correlate of selection on DID. Across inbred strains, DID is substantially genetically correlated with previously-published two-bottle ethanol preference drinking data assessed under conditions of continuous ethanol access. Although inbred strain data for withdrawal-associated drinking are not available, the current pattern of results suggests that withdrawal-associated drinking is genetically distinct from DID, while genetic contributions to DID and two-bottle preference drinking are substantially similar.
Keywords: Withdrawal, Drinking, Preference, Genetics, Mouse, Selective breeding, Inbred strains, Chronic intermittent exposure, Dependence
Introduction
Ethanol intake is usually studied in rodents by offering them two bottles, one containing ethanol (usually 10% in water) and the other, water, with food freely available. Access is continuous and intake is generally assessed once daily. Genetic contributions to individual differences in this two-bottle preference assay were noted in rats in the 1940's [1] and across inbred mouse strains in the 1950's [2]. Ethanol preference (the proportion of total daily fluid taken from the ethanol-containing bottle) is a trait with relatively high heritability [3] and surveys of multiple inbred mouse strains have shown that strains' characteristic ethanol preference is highly stable genetically across 50 years and multiple laboratories [4].
One limitation of the preference drinking assay is that even high-preferring genotypes rarely ingest sufficient ethanol in a short period to reach intoxicating blood ethanol concentrations (BEC), unlike humans who drink abusively [3]. This led us to develop a method for mice that better resembled binge drinking as defined by the National Institute on Alcohol Abuse and Alcoholism, i.e., a pattern of ingestion leading [humans] to BECs > 80 mg% [5]. We offered mice access to a single bottle of 20% v/v ethanol for a period of 2 hr starting shortly after the onset of their circadian dark period. After 3 days of 2 hr access, we extended access on the 4th day to 4 hr. The high-preferring C57BL/6J inbred mouse strain drank more than 4 g/kg in 4 hr and reached BECs > 100 mg% in this “drinking in the dark” (DID) test [6]. A subsequent survey of 12 inbred strains showed substantial genetic variability in DID as assessed by both intake and BEC [7]. Further establishing a genetic basis for DID, we successfully bred a line of High Drinking in the Dark (HDID-1) mice by mating those animals that reached the highest BECs after DID [8]. Heritability of the DID trait is substantially less than that of two-bottle preference drinking; however, HDID mice drink to higher BECs than C57BL/6J mice [8]. Both genotypes display behavioral signs of intoxication after DID [6-8].
Another approach that investigators have taken to achieve oral ethanol intakes that lead to intoxication is to establish limited access two-bottle preference for 15% ethanol and then induce a state of physical dependence through chronic intermittent exposure to ethanol vapor by inhalation (CIE). After multiple cycles of CIE, post-dependence drinking escalates significantly; nearly all of these studies have only tested C57BL/6J mice (e.g., [9,10]). Because self-medication with alcohol during periods of abstinence is thought to be a frequent contributor to relapse to abusive drinking in humans, the CIE model has begun to see wider use (for review, see [11]).
Thus, there is clear genetic contribution to both two-bottle preference drinking and to DID, binge-like drinking. Post-CIE drinking has been studied genetically only in C57BL/6J inbreds and two lines of mice genetically selected for two-bottle preference drinking. High (HAP-2) and Low (LAP-2) Alcohol Preference lines were first given extensive limited-access drinking experience with 10% ethanol vs water in 2 hr sessions early in their circadian dark. Following two cycles of CIE, HAP-2 males (and C57BL/6J males included for reference) showed modest escalations in ethanol drinking, which was not seen in HAP-2 females or either LAP-2 males or females. This suggests the possibility of shared genetic contributions between preference drinking and post-CIE drinking [12]. We have shown that inbred mouse strains differ markedly in their severity of withdrawal after a single cycle of CIE [13]. Given that nearly all traits related to ethanol thus far surveyed across multiple murine genotypes have revealed the presence of genetic influence, it is to be expected that the post-CIE drinking escalation would differ in magnitude across inbred strains. Comparisons across 7 inbred strains for their mean intake data for DID and g/kg daily consumption in a two-bottle preference test have suggested a substantial degree of positive correlation for these two traits (r = 0.70, see [7]). A comparison of HDID-1 and the HS control mice from which they were bred on limited access two-bottle preference for 15% ethanol showed modestly (but significantly) greater drinking in HDID-1 than HS [14]. Little is known about the potential genetic overlap between ethanol DID and post-CIE drinking.
To test whether the genetic influences in common for the DID phenotype vs consumption in two-bottle preference tests might also influence post-CIE drinking, we used two methods to assess the genetic correlations among traits – testing lines selectively bred for extremes on one trait for correlated responses to selection on the other trait, and comparisons (correlations) among inbred strain mean values on the two traits [15]. First, we compared naive animals from the HDID-1 line with its non-selected control population, HS/Npt mice using the methods of Becker & Lopez [9,10]. Mice were first given 4 weeks access to two-hr sessions where 15% ethanol and water were offered. We then exposed them to 3 weekly cycles of CIE and evaluated post-CIE drinking after each cycle. We predicted that HDID-1 mice would show greater escalations in drinking post-CIE than HS controls. Second, we extended the range of mouse inbred strains studied for DID from 12 to 23. We then correlated strain mean data for intake during DID with a data set assembled from three previously-published sets of two-bottle preference drinking data. Genetic correlations between DID and 2-bottle preference intake were estimated from the 23 inbred strains in common across the two data sets. We predicted that the positive genetic correlation seen in the more limited sample would be substantiated.
Experimental procedures
Animals and husbandry
HDID-1 mice were from the 23rd selected generation (S23). The genetically heterogeneous stock HS/Npt was the foundation and is the control population for HDID-1; HS mice were from the 71st filial generation (G71). Derivation of the HS and selection of HDID-1 have been described elsewhere [8]. All mice were naive at the time of testing. Inbred strains (i.e., those identified as “New data” in Table 3) were purchased from The Jackson Laboratory (Bar Harbor, ME) at 4-5 weeks of age. Because comparable inbred strain data for a substantial number of strains for DID and preference drinking were only available for males, we report here only analyses of the DID data for male inbred mice ranging from 8-11 weeks old at the start of testing. HDID-1 and HS mice tested for withdrawal-associated drinking were females ranging in age from 8-11 weeks at the start of testing. We employed females because we had data from a very small pilot study using females, and had hopes of combining data sets to increase statistical power. In the end, BECs during exposure were too different and we had sufficient power with the data reported here (see Results). Until studies began most animals were housed in groups of 2-5 on Thoren racks with automatic lixit water spouts always available. Two-three weeks before and during drinking tests, mice were housed individually in standard polycarbonate or polysulfone cages with stainless steel wire bar tops on Bed-o-cob bedding. Details of the apparatus for testing DID are given in Ref [7]. Cages were changed bi-weekly. Animals were maintained on a 12 hr:12 hr light:dark schedule at a temperature of 21 ± 1°C, and Purina 5001 chow (PMI Nutrition International, Brentwood, MO, USA) was available at all times.
Table 3. Blood ethanol concentration after 4 hr DID access (mg ethanol/ml blood)*.
| Strain | N | BEC (mg/ml) | Source |
|---|---|---|---|
| 129P3/J | 6 | 0.11 ± 0.03 | New data |
| 129S1/SvImJ | 6 | 0.04 ± 0.03 | Rhodes et al., 2007 |
| A/J | 6 | 0.12 ± 0.05 | Rhodes et al., 2007 |
| AKR/J | 6 | 0.13 ± 0.07 | Rhodes et al., 2007 |
| BALB/cJ | 6 | 0.37 ± 0.16 | Rhodes et al., 2007 |
| BALB/cByJ | 6 | 0.09 ± 0.07 | Rhodes et al., 2007 |
| BTBR Ttf/J | 6 | 0.36 ± 0.17 | Rhodes et al., 2007 |
| C3H/HeJ | 6 | 0.09 ± 0.07 | Rhodes et al., 2007 |
| C57BL/6J | 22 | 1.14 ± 0.11 | Rhodes et al., 2007; New data |
| C57BLKS/J | 6 | 1.10 ± 0.13 | New data |
| C57BR/cdJ | 6 | 0.90 ± 0.18 | New data |
| C57L/J | 6 | 0.75 ± 0.20 | New data |
| CAST/EiJ | 6 | 0.03 ± 0.01 | New data |
| CBA/J | 6 | 0.01 ± 0.01 | Rhodes et al., 2007 |
| DBA/1J | 3 | 0.14 ± 0.14 | New data |
| DBA/2J | 6 | 0.02 ± 0.02 | Rhodes et al., 2007 |
| FVB/NJ | 11 | 0.34 ± 0.13 | Rhodes et al., 2007; New data |
| LP/J | 6 | 0.01 ± 0.01 | Rhodes et al., 2007 |
| NOD/ShiLtJ | 6 | 0.26 ± 0.17 | New data |
| NZB/BINJ | 6 | 0.17 ± 0.07 | New data |
| PL/J | 5 | 0.28 ± 0.12 | New data |
| SJL/J | 6 | 0.01 ± 0.01 | New data |
| SWR/J | 6 | 0.02 ± 0.02 | New data |
Means ± standard errors*
All procedures were approved by the Portland VA Medical Center Institutional Animal Care and Use Committee and were performed according to NIH Guidelines for the Care and Use of Laboratory Animals.
Withdrawal-associated drinking
Mice were placed on a reverse light:dark cycle for 2 weeks and maintained on this cycle throughout testing. Lights were on from 0200 to 1400 each day. We followed the procedure of Lopez & Becker [16] as closely as possible, with the exception of not employing the sucrose fading procedure. Twenty female mice of each genotype were randomly assigned to the Control condition and 30 to the CIE condition. They were then given access to two bottles, one containing 15% ethanol and the other tap water, for 2 hr each day starting 30 min before lights off. The side on which ethanol was offered was reversed daily, and fresh ethanol solution and water were provided daily. After 4 weeks of this limited-access, two-bottle drinking, starting on a Monday at hr 1600 of their dark cycle, mice were exposed to ethanol vapor (CIE groups) or to air (Control groups) for 16 hr. At 0800, both groups of animals were switched to a different inhalation chamber for 8 hr with only air provided, and ethanol animals were given fresh food to avoid any ethanol vapor absorption. Three more daily, 16 hr ethanol vapor or air exposures were given. After the 4th day of CIE or air, mice were returned to their home cages (Friday at hr 0800 of their light cycle) and water only was made available in the center of the cage for 24 hr. The following Monday, 77.5 hr after removal from the vapor chambers, the mice were again offered two bottles (ethanol vs water) for 2 hr/day for 5 days. The second cycle of CIE or air, followed by 5 days of 2-hr ethanol vs water drinking, began the following Monday, and the third and final cycle on the Monday two weeks after the second.
The vapor inhalation apparatus and procedures for inducing dependence have been extensively detailed elsewhere [13]. CIE mice were given an injection (ip, in saline) each day that combined 95% ethanol (2.0 g/kg, 20% v/v, Decon Laboratories, King of Prussia, PA, USA) plus the alcohol dehydrogenase inhibitor, pyrazole HCl (68.1 mg/kg; Sigma-Aldrich, St. Louis, MO, USA). Control-group mice were given only pyrazole. Mice were then immediately placed into a chamber where they inhaled ethanol vapor (CIE groups) or air (Control groups). We adjusted the ethanol vapor concentrations daily to try to maintain BECs at a level of 1.75 mg/ml or greater as recommended for elicitation of withdrawal-associated drinking escalation [10]. Because genotypes have differential sensitivity to ethanol vapor, this required placing the HDID-1 and HS mice in two different vapor concentrations (the HDID-1s were more sensitive than HS/Npt). We have discussed the principles underlying matching genotypes for BEC [17] and have used these methods to equate multiple inbred strains for BEC after ethanol vapor exposure [13,18]. Ten mice of each genotype were treated identically to the CIE Group and had blood samples drawn each day from the tail vein at the end of their 16 hr ethanol vapor exposure. The BEC values from these sentinel groups were used to make any adjustments to the next days' vapor concentrations: data from these mice were not included in any other analyses. At the end of the 4th day of ethanol vapor exposure each week, BEC samples were drawn from all CIE mice and Control mice underwent a sham sampling procedure. Each mouse was placed briefly in a plastic tube restrainer, and the end of the tail was nicked. Ethanol treated mice had a 20 ul blood sample drawn into a capillary tube, while control mice had only the tail vein nick. The tail tips were then dipped into warm wax and mice were returned to their cages. BEC levels were assessed by gas chromatography [19].
DID procedures with inbred strains
These have been described extensively elsewhere [6-8]. Mice were given access to a single tube of 20% ethanol v/v in lieu of their water for 2 hr starting 3 hr into their circadian dark phase. At the end of this test, free access to water was restored. Two more 2 hr access sessions were given on Days 2 and 3 of the test. On the 4th day, the ethanol tube was left in place for 4 hr, although tube levels were read at both 2 and 4 hr. Immediately after the 4 hr reading, a blood sample was drawn. A more detailed discussion of implementation of the DID test is available at http://www.scripps.edu/california/research/inia/modelmousedrinkingindark.pdf.
We employed this procedure to test 11 inbred strains not previously tested for DID. All mice were tested in one experiment.
Drinking data reduction and statistical analyses
We have extensively discussed how we handle drinking data in DID and preference studies ([14,20] and see http://www.scripps.edu/california/research/inia/modelmousedrinkingindark.pdf). These discussions cover such topics as corrections for leakage, exclusion of outliers, and treatment of missing data. Here we report analyses of data from the 4th day of the DID tests for g/kg intake across all 4 hr, and BEC (mg/ml) at the end of the test. We employed procedures identical to those employed in the earlier study of 12 strains [7]. We combined the two data sets, employing strain averages weighted for number of mice in each experiment for the two strains (C57BL/6J and FVB/NJ) that were tested in both experiments (neither Experiment nor Strain × Experiment were significant in a 2-way ANOVA [Fs(1,30) < 1.39, ps > 0.24]). We used only the data from males reported by Rhodes [7].
For the withdrawal-associated drinking data in HDID-1 and HS, we primarily report g/kg intake averaged across each 7-day week for weeks 1-4 prior to vapor or air exposure and across 5 days following each vapor or air exposure cycle. Where appropriate for multiple comparisons, post hoc tests employed a Bonferroni correction. Further steps taken to reduce the withdrawal data are described in the Results.
Finally, to compare DID data with those from standard two-bottle preference tests (24 hr access), we combined strain weighted mean intake and preference (% total daily fluid from the ethanol bottle) across 3 published studies that used male inbred mice. Yoneyama [21] tested 22 inbred strains (8-10 weeks old) for 4 days each of 3%, then 6%, then 10% ethanol vs water. Belknap [22] used the same increasing series of ethanol concentrations but for only 3 days at each concentration in a test of 15 inbred strains aged 9-11 weeks. Bachmanov [4] tested 28 strains aged about 8 weeks for 4 days of 10% ethanol vs water.
All data not reported here are freely available upon request.
Results
Withdrawal-associated drinking
Subject elimination procedures to achieve matched BECs
A total of 40 mice were assigned to the air-exposed groups, 20 per genotype. A total of 60 mice were assigned to the ethanol-exposed groups, 30 per genotype. As expected, a proportion of the mice exposed to ethanol died during the course of the experiment, or achieved compromisingly high BECs. These mice were eliminated from the experiment during its course, leaving 18 HDID-1 and 20 HS mice. All 40 mice exposed to air reached the end of the study. Results of the study including all subjects before matching are shown in Supplemental Fig. 1.
Because we wanted to compare drinking in HDID-1 and HS mice that had experienced equivalent ethanol exposure, we first analyzed the BEC values at the end of the 4th day of the 3rd cycle of ethanol vapor. HDID-1 mice had higher mean BECs than HS [3.23 ± 0.23 versus 2.42 ± 0.14 mg/ml, t(25) = 2.59, p < .05]. We therefore eliminated the 7 HDID-1 mice with the highest BECs to achieve exposure matched across genotypes.
We then examined average drinking for these groups, as well as the two air-exposed groups. Visual inspection showed that the CIE and Control group HS mice drank equivalent amounts for all 4 weeks of pre-inhalation drinking. However, for the HDID-1 mice, those mice randomly assigned to the CIE group tended to drink more ethanol during all 4 pre-vapor weeks than their Control group. We therefore eliminated the 7 mice from the HDID-1 Control group that showed the lowest drinking during Week 1. We report statistical analyses of this data set (see Fig. 1 and Tables 1 and 2), which was well-matched for BEC achieved during inhalation exposure; furthermore, control and ethanol groups within each genotype were now matched for pre-vapor-exposure baseline drinking.
Figure 1.
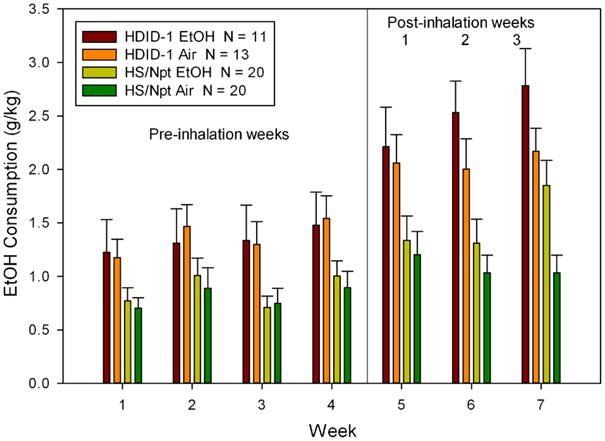
Chronic intermittent exposure to ethanol vapor increased ethanol drinking in both HDID-1 and HS mice as compared with air-exposed groups. Means ± standard errors intake during daily 2 hr sessions averaged over each 7-day period are shown for four weeks before ethanol vapor or air inhalation was initiated. Weeks 5-7 represent drinking averaged over the 5-day test period following each of the 3 cycles of four days of chronic intermittent vapor exposure.
Table 1. Blood ethanol concentration (mg ethanol/ml blood)*.
| Genotype | Post-Inhalation Week | ||
|---|---|---|---|
|
| |||
| 5 | 6 | 7 | |
| HDID-1 | 1.26 ± 0.24 | 2.35 ± 0.23 | 2.54 ± 0.12 |
| HS/Npt | 1.40 ± 0.18 | 2.29 ± 0.19 | 2.42 ± 0.14 |
Means ± standard errors
Table 2. Ethanol preference ratios before and after inhalation exposure (proportion of total fluid intake)*.
| Genotype | Treatment | Baseline (Week 4) | Post-inhalation week | ||
|---|---|---|---|---|---|
|
| |||||
| 5 | 6 | 7 | |||
|
|
|||||
| HDID-1 | Ethanol | 0.68 ± 0.09 | 0.77 ± 0.09 | 0.84 ± 0.07 | 0.81 ± 0.09 |
| HDID-1 | Air | 0.76 ± 0.08 | 0.85 ± 0.08 | 0.81 ± 0.09 | 0.82 ± 0.07 |
| HS/Npt | Ethanol | 0.47 ± 0.03 | 0.53 ± 0.05 | 0.59 ± 0.06 | 0.67 ± 0.05 |
| HS/Npt | Air | 0.48 ± 0.05 | 0.58 ± 0.05 | 0.48 ± 0.06 | 0.52 ± 0.07 |
Means ± standard errors*
Ethanol withdrawal-associated drinking in HDID-1 and HS mice
Fig. 1 shows the results of the comparison of HDID-1 and HS mice for drinking during the 4 weeks before ethanol vapor or air exposure and the three post-exposure drinking weeks. CIE to ethanol vapor increased drinking in both HDID-1 and HS mice to a greater extent than in air-exposed groups. BEC at the end of chronic intermittent exposure cycles 1, 2, and 3 were analyzed with repeated-measures ANOVA (Table 1). There was a significant effect of exposure week [F(2,56) = 27.4, p < 0.0001], as BECs after the first week were lower than the two subsequent weeks. However, neither the effect of genotype nor its interaction with exposure cycle were significant (both Fs < 1). Final sample sizes for the ethanol inhalation groups were N = 11 HDID-1 and N = 20 HS.
We then analyzed drinking before the onset of CIE to ethanol or air vapor inhalation with repeated-measures ANOVA. There was a significant effect of genotype, with HDID-1 drinking significantly more than HS [F(1,60) = 8.8, p < 0.01]. There was also a significant effect of week of drinking [F(3,180) = 6.7, p < 0.001]. Neither treatment group nor any of its interactions were significant (all Fs < 1).
As is customary with CIE drinking escalation data [9,10], we compared drinking during Week 4 (baseline) with that seen during the three post-inhalation weeks. These analyses did not reveal a significant main effect of treatment [F(1,60) = 2.3, p = 0.13]. However, there was a significant effect of week of drinking [F(3,180) = 22.8, p < 0.0001] and genotype [F(1,60) = 18.0, p < 0.0001]. Drinking during each post-baseline week was significantly greater after inhalation than Week 4 baseline drinking (all ps < 0.0001); and HDID-1 drank more than HS. The interaction of treatment × week was significant [F(3,180) = 5.8, p < 0.001] as was the interaction of genotype and week [F(3,180) = 3.5, p < 0.05]. During baseline (Week 4), groups scheduled to be exposed to ethanol did not differ from those to be exposed to air (F<1). After the first two weeks of exposure, treatment groups also did not differ significantly [Fs(1,60) = 0.3 and 2.9, respectively, both NS]. However, during the 3rd and final post-exposure test, ethanol-exposed mice drank more than air exposed mice [F(1,60) = 6.9, p < 0.01].
We also analyzed preference ratios before and after inhalation exposure. These data are shown in Table 2. Statistical analyses of the preference data yielded outcomes parallel to those of the g/kg intake data, and are therefore not presented. The only exception was that for preference ratios post-inhalation, the interaction of genotype × week was not significant.
Total total fluid intake (ml/30 g mouse) was also assessed during these periods. Mean intakes for all subgroups across all weeks ranged from 0.43 - 0.87 ml/30 g and tended to increase across the course of the study. For drinking before inhalation, repeated measures ANOVA revealed only a significant main effect of week [F(3,180) = 5.9, p < 0.001]. Drinking increased from 0.47 ml/30 g in Week 1 to 0.58 ml/30 g in Week 4. Comparisons of total intake across Weeks 4-7 revealed no significant effects of treatment, genotype or their interaction (all Fs < 1). Neither the interaction of treatment × week nor the three-way interaction were significant. However, there was a significant main effect of week [F(3,180) = 6.5, p < 0.001] and an interaction between week and genotype [F(3,180) = 4.2, p < 0.01]. The genotypes did not differ significantly during any week [all Fs(1,62) ≤ 2.9, ps ≥ 0.10]. HDID-1 mice drank significantly more during Week 7 (0.78 ml/30 g) than Week 4 (0.52 ml/30 g) (p < 0.001) while HS mice did not increase drinking significantly from Week 4 (0.62 ml/30 g) to Week 7 (0.67 ml/30 g).
There were no significant main effects on body weight from the beginning of the experiment to the end for either treatment [F(1,60) = 1.4, NS] or genotype [F(1,60) = 2.3, NS], nor for their interaction (F < 1). Mice gained weight across the experiment [F(1,60) = 217.9, p < 0.0001], and there was a significant interaction between day × genotype [F(1, 60) = 60.4, p < 0.0001]. The interactions of Day × Treatment and the three way interaction both failed to reach significance [Fs = 0.7 and 2.4, both ps > 0.10]. HDID-1 mice weighed 19.2 ± 0.4 g at the beginning of the study and 20.4 ± 0.4 g at the end. HS mice weighed 18.7 ± 0.3 g at the beginning and 22.3 ± 0.3 g at the end.
Drinking in the Dark in inbred strains
Ethanol intake across the 4 day DID test is shown in Fig. 2. BEC at the end of drinking is shown in Table 2. Mean BEC [F(22,132) = 11.0, p < 0.0001] and g/kg intake [F(22,134) = 6.05, p < 0.0001] differed significantly across the 23 strains. Strain mean ethanol intake accounted for 45% of the variance in strain mean BEC at the end of drinking (r = 0.67, p < 0.01). Strain mean intake after 2 hr of drinking (data not shown) was significantly correlated with the 4 hr intakes (r = 0.92, p < 0.0001) as well as with the BEC after 4 hr (r = 0.66, p < 0.001). Additionally, as seen in the original report [7], significant effects of strain were seen using only the 11 new strains for both BEC [F(12,60) = 12.6, p < 0.0001] and g/kg intake [F(12,62) = 2.57, p < 0.01].
Figure 2.

Ethanol intake (g/kg) for each inbred strain for Day 4 of the DID test. On Days 1-3 mice had access to 20% ethanol for 2 hr (data not shown), and on Day 4 access was for 4 hr. Data depicted with orange bars represent strains for which data were previously unpublished; green bars are data from reference [7]. Chartreuse bars show combined data from both sources. Means ± standard errors intakes are shown.
Genetic correlations with two-bottle preference drinking
Previously published data for average daily g/kg intake of a 10% ethanol solution when offered continuously with water were next examined to see whether strain mean correlations with DID intake and BEC suggested genetic correlations between these two drinking traits. Across the 3 available data sets [4,21,22], the strain mean correlation between g/kg intake and preference ratio (the proportion of total daily fluid ingested from the ethanol bottle) was r = 0.88 across these 41 strains. Since we believe g/kg intake to be the superior index of avidity for ethanol solutions (as it depends less on the concentration of ethanol offered than does the preference ratio), we correlated the g/kg intake from the two-bottle tests with g/kg intake from the DID test, as well as the BEC after DID. These correlations for the 23 strains in common were r = 0.70 and r = 0.84, respectively (both ps < 0.01). Thus, the DID measures share approximately 50-70% of genetic variance in common with g/kg intake of 10% ethanol in the standard two-bottle preference test.
Discussion
Our data from selectively bred lines do not suggest substantial common genetic influence on DID and withdrawal-associated drinking after CIE. Compared to control mice exposed only to air, both the HDID-1 and HS mice showed significantly increased drinking after the 3rd cycle of CIE. However, the genotypes did not differ in the magnitude of escalation. This finding must be considered preliminary, however, for several reasons. The reciprocal study could not be performed - no lines have been selected for CIE escalations in drinking that could be tested for DID. No inbred strain data for withdrawal-associated drinking have been published, so the strain correlational approach cannot yet be employed. There is a second replicate line of the HDID selection (HDID-2) that could be tested for withdrawal-associated drinking, but this line is in an earlier selected generation and has not yet diverged from the progenitor HS genotype to the extent that HDID-1 has [3]. Were the HDID-2 mice to show much greater (or much lesser) withdrawal-associated drinking increases than HS it is conceivable that we would conclude that there was moderate evidence for a genetic correlation, but the magnitude of the difference between HDID-2 and HS would have to be extreme given the lack of a difference between HDID-1 and HS (for discussion, see [15]). Any vapor inhalation study such as this that attempts to maintain multiple genotypes at nearly identical BECs yields fluctuations in daily BECs. These fluctuations generally become more pronounced as the study progresses, presumably in part because the animals develop metabolic tolerance to the ethanol at different rates. We were able to achieve well-matched BECs across genotypes by deleting data from some extreme-scoring mice, as reported. Another way to test whether the experiment delivered approximately equal doses to the two genotypes is to consider the daily BECs of the 8 HDID-1 and 9 HS sentinel mice that survived across the three exposure weeks. By summing the 12 daily median values for these groups of mice, we estimate that during the 12, 16 hr exposure periods, both genotypes were experiencing, on average, 2.1 mg/ml BECs. In other words, we believe that the genotypes were well-matched for exposure throughout the intermittent periods of inhalation. Another caveat is that we performed the chronic intermittent exposure experiment in female mice, while the other drinking data analyzed and reported here were for males. Thus, the possibility of sex differences in the patterns of genetic association among traits remains to be explored more fully.
Both ethanol-exposed and air-exposed mice showed escalations in drinking during the subsequent tests (see Results and Fig. 1). This phenomenon is common in published studies of withdrawal-associated drinking escalations, but why control mice only exposed to air also show increased post-inhalation drinking has not been experimentally tested to our knowledge. Dozens of studies show that ethanol consumption tends to increase over time. The periods of a few days of withdrawal abstinence between the end of each inhalation cycle and the initiation of the post-inhalation drinking tests could elevate ethanol drinking through an alcohol deprivation effect, but this could not explain the control group escalations. The stress of the inhalation procedure itself could elevate drinking in both groups. Clarifying these possibilities would require focused investigation. The investigator most experienced with these studies recommends many weeks of pre-inhalation drinking, but does not know why control groups also escalate, albeit less than ethanol-withdrawing groups [Howard Becker, personal communication].
HDID-1 mice reached greater BECs than HS after exposure to ethanol vapor, as we had noted earlier [23], even though we had exposed them to lower ethanol vapor concentrations than HS. This necessitated removal of several HDID-1 mice from the study to achieve equal ethanol treatment doses between genotypes. It is therefore possible that the differential censoring of the two genotypes could have affected the pattern of results, although we believe this to be unlikely. HS/Npt mice gained more weight (20%) over the course of the experiment than did HDID-1 (6%), but this genotypic difference was independent of treatment. The experience of three weekly exposures to ethanol vapor did not affect body weight differentially from mice exposed intermittently to air. BECs increased over the three CIE sessions, which we attribute to our having increased the vapor concentrations in attempts to achieve effective BECs. Because we did not hold vapor concentration constant across the 3 CIE sessions, we do not know whether BECs would have escalated with repeated exposures, but prior studies suggest that they would have decreased [17].
In our previous examination of chronic withdrawal in HDID-1 and HS mice [23], the two genotypes were exposed to the same vapor concentrations, and the HDID-1 reached only about 5% higher BECs than HS mice, a non-significant difference. Here, the differences in BEC showed a larger disparity between genotypes. There are several possible reasons for this. The most likely in our opinion is that we exposed the HDID-1 to vapor concentrations that were too high in our attempt to equate the two genotypes for exposure. Another possibility is that the mice tested here were from the 23rd selected generation vs the 18th and 19th for the earlier comparison, so the larger difference in BEC could have been related to the continued selection pressure. If the differences are related to selection, the source could be either of two possibilities or their interactions – greater sensitivity to pyrazole inhibition of ADH, or reduced rate of ethanol metabolism due to altered ADH activity. It would be extremely difficult to dissect these possibilities, so we elected to match animals for BEC as described. We could measure ethanol elimination during withdrawal from the final inhalation session, but that would require repeating the entire experiment: we have no data in any genotype about whether CIE affects metabolic rate. In earlier studies, we compared ethanol elimination rate in 4 murine genotypes that had required different combinations of pyrazole dose, and ethanol loading dose and vapor concentrations to reach equivalent BECs. These genotypes did not differ in elimination rate after 72 hrs of chronic vapor exposure [17]. Unpublished studies showed that they did not differ after either 1, 2, or 3 days of inhalation, suggesting that metabolic tolerance was not acquired to a significant extent. We also know that HDID-1 and HS do not differ in their rate of elimination of an acute ethanol dose [8]. We believe overall that we successfully maintained equivalent chronic ethanol doses in our matched samples from the two genotypes, which suggests that our finding of equivalent escalation of drinking post-inhalation is the most reasonable interpretation. Our previous studies found that HDID-1 and HS showed equivalent severity of ethanol withdrawal handling-induced convulsions [23].
A similar, singular piece of data addresses the potential correlation between CIE and two-bottle preference drinking. Lines of mice selected for High Alcohol Preference (HAP-2) or Low Alcohol Preference (LAP-2) were given 4 weeks of 2 hr access to 10% ethanol vs water, followed by two cycles of CIE or air and post-inhalation drinking. HAP-2 male mice showed increased withdrawal-associated drinking, while LAP-2 mice did not. This suggests some genetic overlap between contributions to CIE drinking and standard two-bottle preference drinking, at least in males; neither female HAP-2 nor LAP-2 mice showed post-CIE escalations. The genotypes were matched reasonably well for BEC during inhalation [12]. Note that in this experiment 10% ethanol was offered while 15% was offered in our experiment. The sex dependence of the HAP-2/LAP-2 difference in escalation is questionable, however, because the HAP-2 and LAP-2 females tended to achieve lower BECs during their second CIE cycle than the males. More systematic studies of sex differences in both traits will be needed to resolve whether or not the genetic correlation between two-bottle preference drinking (with or without limited access) and post-CIE escalations in ethanol intake are sexually dimorphic.
Because two-bottle preference drinking with continuous access is still the “industry standard” for genetic studies with mice, we wanted to re-assess the potential overlap between DID (a binge like drinking phenotype) and preference drinking. With the new inbred strain data we present here, abundant evidence was now available to assess this question. Interestingly, the two data sets available gave somewhat different answers. Considering only inbred strains, there appeared to be a fairly substantial degree of genetic overlap. The estimated genetic correlations between DID and the 2-bottle continuous access preference test were 0.70 or 0.84 depending on the index for DID (g/kg or BEC, respectively). We also correlated values for females and males separately for the 8 strains for which we had data in common for 2-bottle preference and DID. All these correlations were >0.80, suggesting that the relationship is robust in both sexes. Additionally, withdrawal severity after 72 hr of continuous vapor inhalation showed a negative genetic correlation with DID intake (r = -.50, p = 0.07) and DID BEC (r = -0.66, p = 0.02) across 12-14 inbred strain means. Other studies have shown that withdrawal convulsion severity and preference drinking tend to be negatively genetically correlated [24]. Thus, the extended DID data set agrees well with strain differences in other forms of drinking.
On the other hand, we had previously compared S13 HDID-1 and G64 HS mice for two bottle preference drinking using a protocol very similar to those employed for the inbred strain studies [4,21,22]. In that comparison, strains were offered 4 days each of choice between 3%, 6%, 9%, 12%, 15% ethanol versus water, and then higher concentrations [14]. HDID-1 mice tended to drink a little more ethanol than HS at the 9-15% concentrations, inclusive, but did not differ at lower concentrations, and, surprisingly, drank less ethanol than HS at concentrations ≥20%. The very modestly elevated intake of 9-15% ethanol in HDID-1 does not suggest a major influence of common genes on DID and two-bottle preference for concentrations in the usual (9-15%) range. As we report here, when access is limited to 2-4 hr and takes place in the circadian dark, HDID-1 mice clearly drink more 15% ethanol than HS when water is also available (Fig. 1). We found a similar difference in the earlier study, although the difference emerged after some weeks of exposure [14]. A recent paper also reported a small difference between HDID-1 and HS mice in continuous-access preference for 10% ethanol vs water [25]. Thus, the evidence for common genetic contributions to preference drinking and DID is generally consistent, but is stronger in inbred strain comparisons than in studies where lines selected on one trait have been tested for the other. Some technical reasons why these two approaches to assessing genetic correlation among traits may yield different answers are discussed elsewhere [15].
Individual differences in intake of ethanol are affected by many factors, including availability, concentration, experience, circadian period, and taste [11]. Genetic contributions are pronounced, and other studies comparing genetic contributions to drinking across different drinking phenotypes have also tended to report a pattern of both similar and discrete genetic contributions across traits [3]. Given the increase in interest in withdrawal-associated drinking, and the relative dearth of information about its genetic underpinnings, more studies targeting its genetics would be welcome. In particular, it will be important to confirm the lack of a difference in withdrawal-associated drinking in the second replicate of the HDID selection. This test will be most powerful when the HDID-2 line has diverged from the HS in drinking in the dark to the same extent as the HDID-1 mice tested here, which will not be until a few more generations of directional selection have been performed [see Refs 3,8]. In conclusion, while genetic contributions to DID and two-bottle preference drinking seem to be fairly substantial and are probably shared to a significant degree, preliminary indications suggest that withdrawal-associated drinking is less genetically congruent with both other traits. This is interesting in part because the withdrawal-associated drinking paradigm is a hybrid of the two methods. Animals are given a choice between a moderate concentration of ethanol (15% or 10%) and water, and that choice is restricted to a limited time window near the beginning of the circadian dark phase. Yet, despite the procedural similarities between withdrawal-associated drinking and the other tests, genetic overlap currently appears sparse. Perhaps the accumulation of additional data will reveal conditions under which all three phenotypes share strong genetic consistency, or perhaps not. Human drinking patterns are distinctly heterogeneous, and this greatly complicates attempts at complex trait data analysis [26]. Our best hope is that progress toward elucidating genetic contributions will advance in parallel in the human genetics and genetic animal models literature and that practitioners from both camps will continue to attend to the other [27].
Acknowledgments
These studies were funded by the US Department of Veterans Affairs, and by NIAAA Grants AA10760 and AA13519 from the NIH. AB-L is supported by T32 AA007468 and the Achievement Rewards for College Scientists Foundation.
References
- 1.Mardones J, Segovia-Riquelme N. Thirty-two years of selection of rats by ethanol preference: UChA and UChB strains. Neurobehav Toxicol Teratol. 1983;5:171–8. [PubMed] [Google Scholar]
- 2.McClearn GE, Rodgers DA. Differences in alcohol preference among inbred strains of mice. Quart J Stud Alcohol. 1959;20:691–5. [Google Scholar]
- 3.Crabbe JC, Phillips TJ, Belknap JK. The complexity of alcohol drinking: studies in rodent genetic models. Behav Genet. 2010;40:737–50. doi: 10.1007/s10519-010-9371-z. [DOI] [PMC free article] [PubMed] [Google Scholar]
- 4.Wahlsten D, Bachmanov A, Finn DA, Crabbe JC. Stability of inbred mouse strain differences in behavior and brain size between laboratories and across decades. Proc Natl Acad Sci USA. 2006;103:16364–9. doi: 10.1073/pnas.0605342103. [DOI] [PMC free article] [PubMed] [Google Scholar]
- 5.NIAAA Council Approves Definition of Binge Drinking. NIAAA Newsletter. 2004;3 [Google Scholar]
- 6.Rhodes JS, Best K, Belknap JK, Finn DA, Crabbe JC. Evaluation of a simple model of ethanol drinking to intoxication in C57BL/6J mice. Physiol Behav. 2005;84:53–63. doi: 10.1016/j.physbeh.2004.10.007. [DOI] [PubMed] [Google Scholar]
- 7.Rhodes JS, Ford MM, Yu CH, Brown LL, Finn DA, Garland T, Jr, et al. Mouse inbred strain differences in ethanol drinking to intoxication. Genes Brain Behav. 2007;6:1–18. doi: 10.1111/j.1601-183X.2006.00210.x. [DOI] [PubMed] [Google Scholar]
- 8.Crabbe JC, Metten P, Rhodes JS, Yu CH, Brown LL, Phillips TJ, et al. A line of mice selected for high blood ethanol concentrations shows drinking in the dark to intoxication. Biol Psychiat. 2009;65:662–70. doi: 10.1016/j.biopsych.2008.11.002. [DOI] [PMC free article] [PubMed] [Google Scholar]
- 9.Becker HC, Lopez MF. Increased ethanol drinking after repeated chronic ethanol exposure and withdrawal experience in C57BL/6 mice. Alcohol Clin Exp Res. 2004;28:1829–38. doi: 10.1097/01.alc.0000149977.95306.3a. [DOI] [PubMed] [Google Scholar]
- 10.Griffin WC, III, Lopez MF, Becker HC. Intensity and duration of chronic ethanol exposure is critical for subsequent escalation of voluntary ethanol drinking in mice. Alcohol Clin Exp Res. 2009;33:1893–900. doi: 10.1111/j.1530-0277.2009.01027.x. [DOI] [PMC free article] [PubMed] [Google Scholar]
- 11.Becker HC. Animal models of excessive alcohol consumption. Curr Top Behav Neurosci. 2012 Feb 28; doi: 10.1007/7854_2012_203. Epub ahead of print. [DOI] [PubMed] [Google Scholar]
- 12.Lopez MF, Grahame NJ, Becker HC. Development of ethanol withdrawal-related sensitization and relapse drinking in mice selected for high- or low-ethanol preference. Alcohol Clin Exp Res. 2011;35:953–62. doi: 10.1111/j.1530-0277.2010.01426.x. [DOI] [PMC free article] [PubMed] [Google Scholar]
- 13.Metten P, Sorensen ML, Cameron AJ, Yu CH, Crabbe JC. Withdrawal severity after chronic intermittent ethanol in inbred mouse strains. Alcohol Clin Exp Res. 2010;34:1552–64. doi: 10.1111/j.1530-0277.2010.01240.x. [DOI] [PMC free article] [PubMed] [Google Scholar]
- 14.Crabbe JC, Spence SE, Brown LL, Metten P. Alcohol preference drinking in a mouse line selectively bred for high drinking in the dark. Alcohol. 2011;45:427–40. doi: 10.1016/j.alcohol.2010.12.001. [DOI] [PMC free article] [PubMed] [Google Scholar]
- 15.Crabbe JC, Phillips TJ, Kosobud A, Belknap JK. Estimation of genetic correlation: interpretation of experiments using selectively bred and inbred animals. Alcohol Clin Exp Res. 1990;14(2):141–51. doi: 10.1111/j.1530-0277.1990.tb00461.x. [DOI] [PubMed] [Google Scholar]
- 16.Lopez MF, Becker HC. Effect of pattern and number of chronic ethanol exposures on subsequent voluntary ethanol intake in C57BL/6J mice. Psychopharmacology (Berl) 2005;181:688–96. doi: 10.1007/s00213-005-0026-3. [DOI] [PubMed] [Google Scholar]
- 17.Terdal ES, Crabbe JC. Indexing withdrawal in mice: matching genotypes for exposure in studies using ethanol vapor inhalation. Alcohol Clin Exp Res. 1994;18:542–7. doi: 10.1111/j.1530-0277.1994.tb00907.x. [DOI] [PubMed] [Google Scholar]
- 18.Metten P, Crabbe JC. Alcohol withdrawal severity in inbred mouse (Mus musculus) strains. Behav Neurosci. 2005;119:911–25. doi: 10.1037/0735-7044.119.4.911. [DOI] [PubMed] [Google Scholar]
- 19.Rustay NR, Crabbe JC. Genetic analysis of rapid tolerance to ethanol's incoordinating effects in mice: Inbred strains and artificial selection. Behav Genet. 2004;34:441–51. doi: 10.1023/B:BEGE.0000023649.60539.dd. [DOI] [PubMed] [Google Scholar]
- 20.Metten P, Brown LL, Crabbe JC. Limited access ethanol drinking in the dark in adolescent and adult mice. Pharmacol Biochem Behav. 2011;98:279–85. doi: 10.1016/j.pbb.2011.01.003. [DOI] [PMC free article] [PubMed] [Google Scholar]
- 21.Yoneyama N, Crabbe JC, Ford MM, Murillo A, Finn DA. Voluntary ethanol consumption in 22 inbred mouse strains. Alcohol. 2008;42:149–60. doi: 10.1016/j.alcohol.2007.12.006. [DOI] [PMC free article] [PubMed] [Google Scholar]
- 22.Belknap JK, Crabbe JC, Young ER. Voluntary consumption of ethanol in 15 inbred mouse strains. Psychopharmacology. 1993;112:503–10. doi: 10.1007/BF02244901. [DOI] [PubMed] [Google Scholar]
- 23.Crabbe JC, Colville AM, Kruse LC, Cameron AJ, Spence SE, Schlumbohm JP, et al. Ethanol tolerance and withdrawal severity in High Drinking in the Dark selectively bred mice. Alcohol Clin Exp Res. 2012;36:1152–61. doi: 10.1111/j.1530-0277.2011.01715.x. [DOI] [PMC free article] [PubMed] [Google Scholar]
- 24.Metten P, Phillips TJ, Crabbe JC, Tarantino LM, McClearn GE, Plomin R, Erwin VG, Belknap JK. High genetic susceptibility to ethanol withdrawal predicts low ethanol consumption. Mammal Genome. 1998;9:9833–990. doi: 10.1007/s003359900911. [DOI] [PubMed] [Google Scholar]
- 25.Rosenwasser AM, Fixaris MC, Crabbe JC, Brooks PC, Ascheid S. Escalation of intake under intermittent ethanol access in diverse mouse genotypes. Addict Biol. 2012 doi: 10.1111/j.1369-1600.2012.00481.x. epub ahead of print. [DOI] [PMC free article] [PubMed] [Google Scholar]
- 26.Agrawal A, Freedman ND, Cheng YC, Lin P, Shaffer JR, Sun Q, et al. Measuring alcohol consumption for genomic meta-analyses of alcohol intake: opportunities and challenges. Am J Clin Nutr. 2012;95:539–47. doi: 10.3945/ajcn.111.015545. [DOI] [PMC free article] [PubMed] [Google Scholar]
- 27.Crabbe JC. Translational behaviour-genetic studies of alcohol: are we there yet? Genes Brain Behav. 2012;11:375–86. doi: 10.1111/j.1601-183X.2012.00798.x. [DOI] [PMC free article] [PubMed] [Google Scholar]