

Abstract
The short-wavelength-sensitive (S) cones play an important role in color vision of primates, and may also contribute to the coding of other visual features, such as luminance and motion. The color signals carried by the S cones and other cone types are largely separated in the subcortical visual pathway. Studies on nonhuman primates or humans have suggested that these signals are combined in the striate cortex (V1) following a substantial amplifi cation of the S-cone signals in the same area. In addition to reviewing these studies, this review describes the circuitry in V1 that may underlie the processing of the S-cone signals and the dynamics of this processing. It also relates the interaction between various cone signals in V1 to the results of some psychophysical and physiological studies on color perception, which leads to a discussion of a previous model, in which color perception is produced by a multistage processing of the cone signals. Finally, I discuss the processing of the S-cone signals in the extrastriate area V2.
Keywords: S-cone signals, Striate cortex, Color vision, Koniocellular, V2
In diurnal primates, the short-wavelength-sensitive (S) cones constitute only 5–10% of the cone mosaic (DeMonasterio et al., 1981; Wikler & Rakic, 1990; Martin & Grunert, 1999). Their peak spectral sensitivity is well separated from those of the middle-wavelength-sensitive (M) and the long-wavelength-sensitive (L) cones (Nathans, 1999). Due to chromatic aberrations, light of short wavelength carries little information at high spatial frequencies. Based on these features, it has been proposed that the primary function of S-cones is coding color information (De Valois et al., 2000; Hashemi-Nezhad et al., 2008). However, psychophysical and brain imaging studies have shown that the S-cone signals may also contribute to the coding of other visual features, such as motion, luminance, and orientation (Stockman et al., 1991; Gegenfurtner & Hawken, 1995; Sumner et al., 2008). Therefore, understanding the cortical processing of the S-cone signals is critical for understanding how color and other features are represented in the cortex.
The majority of the cortical projections from the lateral geniculate nucleus (LGN) terminate in the striate cortex (V1), although a minority of them reach extrastriate areas (e.g., Benevento & Yoshida, 1981; Bullier & Kennedy, 1983; Lysakowski et al., 1988; Weller et al., 2002 ; Sincich et al., 2004). It is therefore reasonable to assume that the main portion of the S-cone signals is processed in V1 before they reach other areas, and only a small portion of these signals may bypass V1. This review focuses on the processing of the S-cone signals in areas V1 and V2.
The S-cone inputs from the LGN to V1
The S-cone signals are mostly carried by the koniocellular (K) layers in the LGN, with little or minor presence in the parvocellular (P) or magnocelluar (M) layers (see the review by Hendry & Reid, 2000; Chatterjee & Callaway, 2002; Sun et al., 2006; Hashemi-Nezhad et al., 2008). The projections from the K layers to V1 terminate in layer 4A and in the cytochrome oxidase (CO) blobs of layers 2/3 (see the reviews by Casagrande, 1994; Hendry & Reid, 2000). However, the K layers contain several types of cells, not all of them carrying the S-cone signals (see the reviews by Casagrande, 1994; Hendry & Reid, 2000). So the precise distribution of the LGN terminals in V1 that carry the S-cone signals remained unknown until it was described by Chatterjee and Callaway (2003). In that study, the distribution of the LGN terminals in V1 that carry various cone-specific signals was mapped after the neuronal activity within V1 was silenced by a GABA agonist. Their results suggested that the terminals that carry S-on signals innervate layer 4A and lower layer 3, whereas the terminals that carry S-off signals innervate lower layer 4A (Fig. 1A). The terminals that carry the nonopponent and opponent L- and M-cone signals were found in layers 4Cα and 4Cβ, respectively. Based on their results from a small number of recording sites, Chatterjee and Callaway (2003) hypothesized that the S-on terminals in layer 4 are uniformly distributed, whereas the S-on terminals in lower layer 3 and S-off terminals in lower layer 4A are confined to small patches (Fig. 1A). Further studies with more recording sites are needed to test the patchiness or lack of it associated with these terminals. Given that the middle and upper parts of the CO blobs also receive direct projections from the LGN (Fitzpatrick et al., 1983) and that these projections are largely from the koniocellular layers (Hendry & Yoshioka, 1994), it is possible that S-on and/or S-off terminals also innervate these locations but were not encountered by Chatterjee and Callaway (2003) due to their small number of recording sites in layers 2 and 3.
Fig. 1.

Anatomical pathways associated with the S-cone signals in V1. (A) A schematic diagram of the cone-specific projections from the LGN to V1. Terminals that carry S-off signals innervate layer 4A, whereas those carrying S-on signals innervate both layers 4A and 3. Terminals that carry opponent and nonopponent L/M-cone signals innervate layers 4Cβ and 4Cα, respectively. It was hypothesized that the S-on terminals in layer 3 and the S-off ones in layer 4 are concentrated in small patches. M, P, and K denote projections from the magnocellular, parvocellular, and koniocellular layers of the LGN, respectively. Reprinted by permission from Macmillan Publishers Ltd: Nature (Chatterjee and Callaway, 2003), copyright 2003. (B) A schematic diagram of the distribution of axonal terminals originating from cells in layer 4A. Most of these terminals in layer 3 are clustered in the CO blobs, although they are missing in a minority of the blobs (marked with *). There are also extensive connections between cells within layer 4A. From Yoshioka et al. (1994). Copyright 1994, Cambridge University Press.
Since layer 4A is the major recipient of the LGN terminals that carry the S-cone signals, the efferent pattern of the cells in this layer may determine the spatial distribution of the next stage of the processing of the S-cone signals. One study based on microinjection of an anatomical tracer suggested that cells in layer 4A project mainly to the blobs in layers 2/3, although a minority of the blobs do not receive this projection (Fig. 1B) (Yoshioka et al., 1994). This projection pattern, as well as the direct projections from the K layers to the blobs, suggests that the blobs play a prominent role in the cortical processing of the S-cone signals immediately after layer 4A. Cells in the interblob regions of layers 2/3 may receive weaker S-cone signals via their dendrites in blobs (Hubener & Bolz, 1992; Malach, 1992). However, the pattern of connectivity depicted in Fig. 1B is inconsistent with the results of two other studies (Lachica et al., 1992; Sawatari & Callaway, 2000). Thus, the question of whether the blobs receive more S-cone signals from layer 4A than the interblob regions of layers 2/3 remains controversial.
Strength of the S-cone inputs to cells in V1
Although the S-cone signals are largely confi ned to the K layers in the LGN, they are more widespread in V1. De Valois et al. (2000) compared the strength of the S-cone inputs across cells in V1 and LGN (Fig. 2). They measured the responses of each cell to gratings that stimulated L-, M-, or S-cones only. In Fig. 2, the abscissa represents the S-cone weight, which is the response magnitude elicited by an S-cone-isolating grating, divided by the sum of response magnitudes that were elicited by all cone-isolating gratings. The ordinate represents the percentage of cells with a given S-cone weight. The solid line represents the distribution across cells in the LGN, and the dashed line shows the distribution in V1. The bimodal distribution in the LGN refl ects the existence of two distinct populations of cells in terms of the S-cone weights. The vast majority of cells in the M and P layers had small S-cone weights, whereas many cells in the K layers had large S-cone weights. The distribution in V1 suggests that the relative separation between S- and L/M-cone inputs was lost in V1, and most cells were driven robustly by all three cone inputs. The median S-cone weight in V1 was twice as large as that in the LGN. In addition, the continuous distribution of S-cone weights in V1 suggests that V1 contains color-selective cells that are tuned to various color directions, as suggested by many other studies (reviewed by Gegenfurtner & Kiper, 2003; Lennie & Movshon, 2005). The activities of neurons that combine S- and L/M-cone inputs were also detected in human V1 in an fMRI study that differentiated patterns of response elicited by different combinations of the two opponent cone inputs (Goddard et al., 2010). Therefore, the results of many studies are consistent with the hypothesis of De Valois et al. (2000) that the S-cone signals are amplifi ed in V1 relative to the LGN. This hypothesis is further supported by fMRI studies that directly compared the activity in human LGN and V1 in response to cone-specific stimuli (Mullen et al., 2010; D’Souza et al., 2011). It is also consistent with imaging studies on marmosets (Buzas et al., 2008) and tree shrews (Johnson et al., 2010) that found widespread activation in V1 in response to S-cone stimulation. Finally, an EEG study on human V1 found strong S-cone inputs to the mechanism underlying surround suppression (Xiao & Wade, 2010), although this mechanism was found to receive predominantly achromatic inputs in a study of single neurons in monkey V1 (Solomon et al., 2004).
Fig. 2.
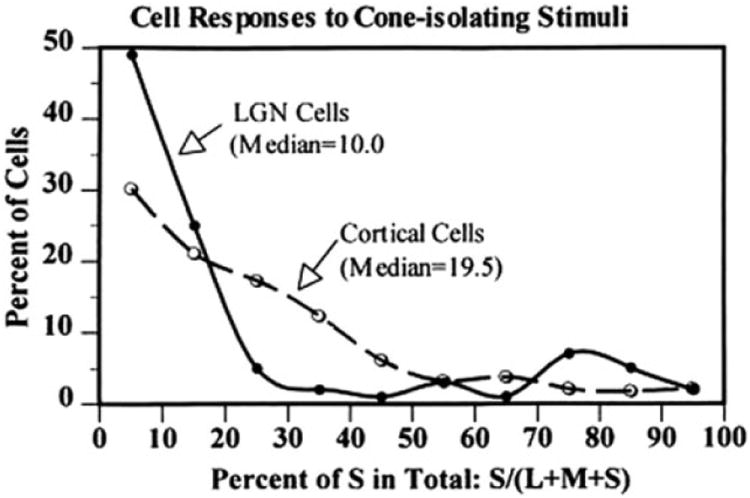
Distributions of the relative S-cone weights across LGN cells and V1 cells. The LGN contains two distinct groups of cells, one with small S-cone weights and the other with large S-cone weights. There are few cells with intermediate weights. The fi rst group corresponds to cells in the parvocellular and magnocellular layers of the LGN, which constitute the majority of LGN cells. The second group corresponds to cells in the koniocellular layers. V1 cells cannot be divided into distinct groups according to their S-cone weights, and the median weight is twice as large as that found in LGN cells. From De Valois et al. (2000). Copyright 2000, National Academy of Sciences, USA.
In the study by De Valois et al. (2000), the cone contrast for the S-cone-isolating grating was much higher than those for the M- and L-cone-isolating gratings. Because of this difference in cone contrast, the abscissa value in Fig. 2 may not reflect the true contribution of the S-cone inputs relative to other cone inputs to a given cell. To make the comparison more meaningful, some studies used comparable cone contrasts for different cone-isolating stimuli (Johnson et al., 2004) or normalized the cone weights with the respective contrasts (Lennie et al., 1990; Solomon & Lennie, 2005; Hashemi-Nezhad et al., 2008). These studies reported much smaller S-cone contribution to V1 cells than did the studies that did not take into account the difference in cone contrast (De Valois et al., 2000; Conway & Livingstone, 2006; Horwitz et al., 2007). However, to determine the contribution of various cones to V1 activity in the natural visual environment, the distributions of various cone contrasts elicited by natural scenes also need to be taken into account. Such distributions are largely unknown as previous studies on natural scenes did not analyze the cone contrasts between a given surface and the adaptation color (Ruderman et al., 1998; Nascimento et al., 2002), which are what physiological studies usually use to normalize the responses.
Interactions between various cone inputs to individual cells in V1
In the LGN, the majority of S-cone sensitive cells are S-on cells that receive excitatory S-cone inputs and inhibitory L- and M-cone inputs. The rare S-off cells receive excitatory L-cone inputs opposed by inhibitory M- and S-cone inputs (Solomon & Lennie, 2005; Tailby et al., 2008b). In V1, however, for both S-on and S-off cells that receive robust S-cone inputs and opponent L/M-cone inputs, the S-cone inputs usually take the sign of the M-cone inputs according to some studies (Conway, 2001; Solomon & Lennie, 2005; Conway & Livingstone, 2006; Horwitz et al., 2007). In addition, there seems to be a comparable number of S-on and S-off cells in V1 (De Valois et al., 2000). These results suggest that the S-off signals from the LGN are amplifi ed in V1 more than the S-on signals (Solomon & Lennie, 2005) or that about half of the S-on signals from the LGN are inverted after amplification in V1 (De Valois et al., 2000). However, while studies from one group found that the S-cone inputs had the same sign as the M-cone inputs in nearly all cells that received opponent L/M-cone inputs (Conway, 2001; Conway & Livingstone, 2006), other studies found either more exceptions to this tendency (Solomon & Lennie, 2005; Horwitz et al., 2007) or no such tendency at all (Cottaris & De Valois, 1998; De Valois et al., 2000). The latter results were more consistent with a continuous distribution of the preferred colors across V1 cells (reviewed by Gegenfurtner & Kiper, 2003; Lennie & Movshon, 2005). As Conway (2001) and Conway and Livingstone (2006) focused on a subset of color-selective cells that responded well to a small cone-isolating spot, it is possible that the S- and M-cone inputs to this subset of cells are always aligned.
A V1 cell that receives opponent L/M-cone inputs has either a single-opponent or a double-opponent receptive field (Conway, 2001; Conway & Livingstone, 2006; Johnson et al., 2008; reviewed by; Shapley & Hawken, 2011). In a single-opponent receptive field, the center receives opponent inputs from L- and M-cones and the surround receives inputs from only one cone type that provides the weaker drive to the center. A double-opponent receptive field contains two parts. Each part receives opponent inputs from L- and M-cones, and the signs of the cone inputs are opposite between the two parts. However, the precise spatial structure of a double-opponent receptive field is still hotly debated (reviewed by Conway et al., 2010; Shapley & Hawken, 2011). Some of the originally identified double-opponent receptive fields might have a cone opponent center and a suppressive surround that are not cone opponent (Ts’o & Gilbert, 1988; Solomon et al., 2004).
The S-cone signals are present in both single-opponent and double-opponent receptive fields, including various configurations of the latter (Johnson et al., 2004; Conway & Livingstone, 2006). Therefore, both single-opponent and double-opponent receptive fields are potentially capable of representing the full gamut of colors, but the specific role that each type of receptive field plays in representing color remains unclear. One possibility is that a single-opponent receptive field encodes wavelength composition of the light reflected from a surface, whereas a double-opponent receptive field encodes chromatic contrast at the border between surfaces and may play an important role in color constancy (Gegenfurtner, 2003). The single-opponent receptive fields are unselective for orientation and are larger than other types of receptive fields that are orientation selective (Solomon et al., 2004). These characteristics could be the result of the cortical adaptation during evolution to the statistical structure of the visual world (Cecchi et al., 2010).
Many V1 cells that receive nonopponent L- and M-cone inputs also receive the S-cone inputs (Johnson et al., 2004; Solomon & Lennie, 2005; Conway & Livingstone, 2006; Horwitz et al., 2007). In these cells, the S-cone inputs were either opposed to or aligned with those from L- and M-cones. The opponent inputs may originate from S-on cells in the LGN, which also receive opponent S- and (L + M)-cone inputs. V1 cells that receive opponent S- and (L + M)-cone inputs may contribute primarily to color vision.
The alignment of the inputs from all cone types may result from the merging between the S-cone signals and luminance signals in some cells. A previous study found that some cells in the magnocellular layers of the LGN also received aligned inputs from all cone types (Chatterjee & Callaway, 2002), although the conclusion of that study was challenged later on methodological grounds (Sun et al., 2006; Hashemi-Nezhad et al., 2008). In any case, V1 cells that receive aligned inputs from all cone types might be part of the pathway that sends the S-cone signals to area MT (Seidemann et al., 1999) and could mediate the S-cone’s contributions to luminance and motion-sensitive mechanisms (Stockman et al., 1991; Gegenfurtner & Hawken, 1995).
Dynamics of the S-cone signals in V1
In a study based on reverse correlation between spikes and uniform stimuli of various colors, it was found that among the responsive cells in V1, the majority received either opponent L/M-cone signals with a short latency (<96 ms) or S-cone signals with a long latency (>96 ms), or a combination of these two signals (Cottaris & De Valois, 1998). The latency was measured as the interval between stimulus presentation and the peak response. The longer latency of the S-cone signals relative to other cone signals was confirmed in another study (Conway & Livingstone, 2006). This difference in latency might contribute to the difference in latency at the behavioral level between the responses to different cone-isolating stimuli (Smithson & Mollon, 2004). Since this latency difference was not detected in the LGN (Tailby et al., 2008b), it is likely caused by processing at the input layers of V1.
In addition to the difference in latency, cells with or without the S-cone inputs also differed in the dynamics of their color tuning (Cottaris & De Valois, 1998). Cells without any S-cone input had a more stable color tuning over time than did those with the S-cone inputs. Taken together, the results of Cottaris and De Valois (1998) suggest that relative to other cone signals, the S-cone signals go through a longer and more active stage of processing before exerting maximal impact on V1 cells. This processing stage might be responsible for the amplification of the S-cone signals in V1 (De Valois et al., 2000). The neural substrate of this postulated processing stage remains unknown, but a possible candidate is the network of neurons in layer 4A that is formed through extensive intralaminar connections (Fig. 1B) (Yoshioka et al., 1994).
In the study by Cottaris and De Valois (1998), a minority of the cells received the S-cone inputs with very short latencies (<70 ms). Most of these cells were found in layer 6 and were assumed to mediate the contribution of the S-cone signals to the luminance and motion-sensitive mechanisms (Stockman et al., 1991; Gegenfurtner & Hawken, 1995). In contrast, cells that only received slower S-cone inputs were found mainly in the supragranular layers, whereas those receiving both the S-cone and L/M-cone inputs were found across all layers.
Several fMRI studies on humans have found that the V1 responses to S-cone-specific stimuli were tuned to a narrower bandwidth of temporal frequencies than were the responses to other cone-specific stimuli (Liu & Wandell, 2005; D’Souza et al., 2011). For instance, D’Souza et al. (2011) found that while the V1 response to opponent L/M-cone signals remained relatively constant for temporal frequencies up to 12 Hz, the response to the S-cone signals declined sharply as the temporal frequency increased in the same range. In contrast, similar differences in temporal frequency tuning were not found in the LGN (D’Souza et al., 2011). These results are consistent with the fi nding that the latency of the S-cone signals in V1 cells is longer than that of other cone signals and support the hypothesis that the delay is caused by the S-cone processing mechanism in V1. However, another fMRI study did not find significant difference in temporal frequency tuning between V1 responses to the S-cone compared with the L/M-cone signals (Mullen et al., 2010).
The relationship between cone signals and color perception
When the S-cone opponent cells that difference the S-cone signals from the sum of the L- and M-cone signals were first found in the LGN, they were thought to mediate our color perception along the blue-yellow axis, and the LGN cells that difference the L- and M-cone signals were thought to mediate our perception along the red-green axis (De Valois, 1965; De Valois et al., 1966). However, a more recent study showed that these opponent-cell color axes do not precisely correspond to the perceptual red-green and blue-yellow axes (De Valois et al., 1997). Instead, they correspond to the two “cardinal directions” along which psychophysically measured chromatic sensitivity can be adapted independently (Krauskopf et al., 1982). The specificity of adaptation along the cardinal directions was taken as evidence suggesting that color is represented by two discrete postreceptoral mechanisms (Krauskopf et al., 1982). However, later psychophysical studies with various measurements, including an reanalysis of the data of Krauskopf et al. (1982), suggested that there are many “higher order” color mechanisms that are tuned to various color directions that include both the cardinal and intermediate ones (reviewed by Eskew, 2009). This hypothesis is consistent with physiological findings that the majority of color selective cells in V1 prefer intermediate colors between the cardinal axes (Lennie et al., 1990; De Valois et al., 2000; Wachtler et al., 2003; Hass & Horwitz, 2013). More recent studies suggested that the independent adaptation along the cardinal directions occurs at the geniculate-input layers of V1 where the S/(L + M) and L/M opponent signals are separated (Tailby et al., 2008a; Stoughton et al., 2012).
The studies reviewed above are consistent with a multistage model that contains a cortical stage in which the S-cone opponent signals are amplified and combined with the opponent L/M signals (Fig. 3) (De Valois & De Valois, 1993). According to this model, the S-cone signals modulate the cortical activity in V1 that is predominantly determined by the opponent L/M signals in trichromatic primates. This hypothesis is consistent with a recent study on trichromatic marmosets that showed a predominant role of the opponent L/M signals in the response of the color patches in V1 (Valverde Salzmann et al., 2012). It is also consistent with our recent study of response patterns in V1 to various uniform colors (Xiao et al., 2011). When the response patterns are divided into two groups according to their similarity, one group is usually associated with hues that have a positive L–M cone contrast, whereas the other group is associated with hues that have a negative L–M cone contrast. This bipartite division is not correlated with the value or sign of the S-cone contrast. The S-cone contrast seems to fine-tune the response pattern within each group, as predicted by the multistage model. Interestingly, a similar bipartite analysis of color names across many languages (Lindsey & Brown, 2006) found a universal division between “warm” and “cool” colors, suggesting a fundamental difference between these two groups of colors. These two groups of colors also have opposite signs of L–M cone contrasts (Xiao et al., 2011), supporting the view that the S-cone signals play a largely modulatory role on the opponent L/M-cone signals in producing color perception of trichromatic subjects (De Valois & De Valois, 1993; De Valois et al., 2000).
Fig. 3.

The transformation from cone-opponent signals in the LGN to a continuous representation of color in visual cortex. The S-cone signals from the LGN are amplifi ed in V1 relative to the L/M-cone signals, as symbolized by the change in the line width that denotes the signal strength. According to the multistage model by De Valois and De Valois (1993), the S-cone signals play a modulatory role on the opponent L/M-cone signals in V1. As a result, chromatic preferences of V1 neurons cover the full gamut of color.
Since CO blobs in V1 receive direct projections from the koniocellular layers of the LGN, which carry the S-cone signals, CO blobs may play a particularly important role in processing color information (Livingstone & Hubel, 1984). This hypothesis is supported by studies on macaque monkeys using imaging of intrinsic optical signals. In one study, CO blobs were found to be co-localized with color-preferring regions that were preferentially activated by equiluminant chromatic stimuli (Lu & Roe, 2008). In another study, these color-preferring regions were found to contain hue maps in which perceptually similar hues elicited peak responses at nearby locations (Xiao et al., 2007). The finding of hue maps in color-preferring regions suggests clustering of neurons according to their cone inputs in these regions, a suggestion that was confirmed by a preliminary study using two-photon calcium imaging (Chatterjee et al., 2008; Conway et al., 2010).
A few fMRI studies suggest that human V1 also contains an inhomogeneous, spatial distribution of hue preferences, as stimulus hue can be decoded from the spatial pattern of response in V1 (Brouwer & Heeger, 2009; Parkes et al., 2009; Goddard et al., 2010). This inhomogeneity was taken as an evidence for the existence of hue maps in human V1 (Parkes et al., 2009), although the low spatial resolution of fMRI prevented it from excluding other possible spatial arrangement of hue preferences. One of these fMRI studies reported that the similarity between the response patterns in human V1 did not follow that between the stimulus hues, which seems to contradict the existence of hue maps in V1 (Brouwer & Heeger, 2009). One possible explanation for the apparent discrepancy between Brouwer and Heeger (2009) and Xiao et al. (2007) is that while Xiao et al. (2007) found hue maps in the color-preferring regions of supragranular layers, the results of Brouwer and Heeger (2009) were based on responses that were averaged across various regions and layers due to the large size of each voxel.
Hue maps or spatial clustering of hue preferences was also found in color-preferring regions of higher visual areas in macaque monkeys (Zeki, 1980; Xiao et al., 2003; Conway et al., 2007; Tanigawa et al., 2010). A study on human subject suggested the existence of a similar hue map in the temporal cortex, where an electrical stimulation elicited the percept of blue even when no visual stimulus was presented (Murphey et al., 2008). The presumed hue map in human temporal cortex was also located in a color-preferring region as identifi ed by fMRI, suggesting that it originates from the hue maps in V1.
In summary, many experimental and theoretical studies reviewed here suggest that V1 is the first stage of the process that combines various cone-specific signals from the LGN to form our color perception. In addition, by mixing the S-cone signals with luminance signals, V1 is likely part of the pathway through which S-cone signals contribute to the coding of other features, such as luminance and motion.
The S-cone signals in the visual area V2
Like V1 neurons, the majority of V2 neurons also receive S-cone inputs and have chromatic preference intermediate to the cardinal directions (Kiper et al., 1997; Solomon et al., 2004). However, unlike V1 where S-off signals were more frequently recorded than S-on signals (De Valois et al., 2000; Wachtler et al., 2003), V2 was found to contain more neurons with S-on inputs than those with S-off inputs (Kiper et al., 1997). It is unclear whether this difference was caused by a skewed sampling in each area or by the processing of the S-cone signals in V2. In addition, it is possible that V2 receives the S-cone signals directly from the LGN since one study found direct projections from the koniocellular layers of the LGN to V2 (Bullier & Kennedy, 1983).
A few fMRI studies on humans reported robust responses to the S-cone-isolating stimuli in V2 (Mullen et al., 2007; Sumner et al., 2008; Mullen et al., 2010; D’Souza et al., 2011). D’Souza reported that the V2 response to the S-cone inputs declined steeply as the temporal frequency increased from 2 to 12 Hz. But Mullen et al. (2010) reported that those responses were fl at up to 8 Hz. In both studies, the temporal frequency tuning of the S-cone signals was the same in V1 and V2, suggesting that there is no additional temporal fi ltering of the S-cone signals in V2. The relative strengths of the S-cone signals versus the L/M-cone signals are the same in V2 as in V1 (Mullen et al., 2007), suggesting that there is no additional amplification of the S-cone signals in V2.
V2 contains CO-rich thin and thick stripes and CO-poor interstripes (Tootell et al., 1983; Horton, 1984; Livingstone & Hubel, 1984). Most electrophysiological studies have found that the thin stripes contain more color selective neurons than the other compartments, although the precise percentage of color selective neurons in each compartment varies considerably among studies (for a thorough study and review, see Shipp & Zeki, 2002). The thin stripes also represent the only compartment in V2 that receives the projections from the V1 blobs (Livingstone & Hubel, 1984; Sincich & Horton, 2002; Xiao & Felleman, 2004). Consistent with the electrophysiological and anatomical results, imaging studies found color-preferring regions centered at the thin stripes (Roe & Ts’o, 1995; Xiao et al., 2003; Tootell et al., 2004; Valverde Salzmann et al., 2012). In addition, these color-preferring regions were found to contain hue maps (Xiao et al., 2003). All these results suggest a particularly important role of the thin stripes in processing color information including the S-cone signals. A relevant question is whether the aforementioned direct projections from the LGN terminate in the thin stripes since these projections are likely to carry the S-cone signals (Bullier & Kennedy, 1983).
Acknowledgments
The preparation of this review was supported by a grant from the US National Eye Institute, EY021575. The author thanks Dr. Ehud Kaplan for helpful comments.
References
- Benevento LA, Yoshida K. The afferent and efferent organization of the lateral geniculo-prestriate pathways in the macaque monkey. The Journal of Comparative Neurology. 1981;203:455–474. doi: 10.1002/cne.902030309. [DOI] [PubMed] [Google Scholar]
- Brouwer GJ, Heeger DJ. Decoding and reconstructing color from responses in human visual cortex. The Journal of Neuroscience. 2009;29:13992–14003. doi: 10.1523/JNEUROSCI.3577-09.2009. [DOI] [PMC free article] [PubMed] [Google Scholar]
- Bullier J, Kennedy H. Projection of the lateral geniculate nucleus onto cortical area V2 in the macaque monkey. Experimental Brain Research. 1983;53:168–172. doi: 10.1007/BF00239409. [DOI] [PubMed] [Google Scholar]
- Buzas P, Szmajda BA, Hashemi-Nezhad M, Dreher B, Martin PR. Color signals in the primary visual cortex of marmosets. Journal of Vision. 2008;8:1–16. doi: 10.1167/8.10.7. [DOI] [PubMed] [Google Scholar]
- Casagrande VA. A third parallel visual pathway to primate area V1. Trends in Neurosciences. 1994;17:305–310. doi: 10.1016/0166-2236(94)90065-5. [DOI] [PubMed] [Google Scholar]
- Cecchi GA, Rao AR, Xiao Y, Kaplan E. Statistics of natural scenes and cortical color processing. Journal of Vision. 2010;10:21. doi: 10.1167/10.11.21. [DOI] [PMC free article] [PubMed] [Google Scholar]
- Chatterjee S, Callaway EM. S cone contributions to the magnocellular visual pathway in macaque monkey. Neuron. 2002;35:1135–1146. doi: 10.1016/s0896-6273(02)00874-7. [DOI] [PubMed] [Google Scholar]
- Chatterjee S, Callaway EM. Parallel colour-opponent pathways to primary visual cortex. Nature. 2003;426:668–671. doi: 10.1038/nature02167. [DOI] [PubMed] [Google Scholar]
- Chatterjee S, Ohki K, Reid RC. Functional micro-architecture of color selectivity in macaque primary visual cortex. Soc Neurosci Abstr. 2008;34 [Google Scholar]
- Conway BR. Spatial structure of cone inputs to color cells in alert macaque primary visual cortex (V-1) The Journal of Neuroscience. 2001;21:2768–2783. doi: 10.1523/JNEUROSCI.21-08-02768.2001. [DOI] [PMC free article] [PubMed] [Google Scholar]
- Conway BR, Chatterjee S, Field GD, Horwitz GD, Johnson EN, Koida K, Mancuso K. Advances in color science: From retina to behavior. The Journal of Neuroscience. 2010;30:14955–14963. doi: 10.1523/JNEUROSCI.4348-10.2010. [DOI] [PMC free article] [PubMed] [Google Scholar]
- Conway BR, Livingstone MS. Spatial and temporal properties of cone signals in alert macaque primary visual cortex. The Journal of Neuroscience. 2006;26:10826–10846. doi: 10.1523/JNEUROSCI.2091-06.2006. [DOI] [PMC free article] [PubMed] [Google Scholar]
- Conway BR, Moeller S, Tsao DY. Specialized color modules in macaque extrastriate cortex. Neuron. 2007;56:560–573. doi: 10.1016/j.neuron.2007.10.008. [DOI] [PMC free article] [PubMed] [Google Scholar]
- Cottaris NP, De Valois RL. Temporal dynamics of chromatic tuning in macaque primary visual cortex. Nature. 1998;395:896–900. doi: 10.1038/27666. [DOI] [PubMed] [Google Scholar]
- D’souza DV, Auer T, Strasburger H, Frahm J, Lee BB. Temporal frequency and chromatic processing in humans: An fMRI study of the cortical visual areas. Journal of Vision. 2011;11 doi: 10.1167/11.8.8. [DOI] [PubMed] [Google Scholar]
- De Valois RL. Analysis and coding of color vision in the primate visual system. Cold Spring Harbor Symposia on Quantitative Biology. 1965;30:567–579. doi: 10.1101/sqb.1965.030.01.055. [DOI] [PubMed] [Google Scholar]
- De Valois RL, Abramov I, Jacobs GH. Analysis of response patterns of LGN cells. Journal of the Optical Society of America. 1966;56:966–977. doi: 10.1364/josa.56.000966. [DOI] [PubMed] [Google Scholar]
- De Valois RL, Cottaris NP, Elfar SD, Mahon LE, Wilson JA. Some transformations of color information from lateral geniculate nucleus to striate cortex. Proceedings of the National Academy of Sciences of the United States of America. 2000;97:4997–5002. doi: 10.1073/pnas.97.9.4997. [DOI] [PMC free article] [PubMed] [Google Scholar]
- De Valois RL, De Valois KK. A multi-stage color model. Vision Research. 1993;33:1053–1065. doi: 10.1016/0042-6989(93)90240-w. [DOI] [PubMed] [Google Scholar]
- De Valois RL, De Valois KK, Switkes E, Mahon L. Hue scaling of isoluminant and cone-specific lights. Vision Research. 1997;37:885–897. doi: 10.1016/s0042-6989(96)00234-9. [DOI] [PubMed] [Google Scholar]
- DeMonasterio FM, Schein SJ, McCrane EP. Staining of blue-sensitive cones of the macaque retina by a fl uorescent dye. Science. 1981;213:1278–1281. doi: 10.1126/science.7268439. [DOI] [PubMed] [Google Scholar]
- Eskew RT., Jr Higher order color mechanisms: A critical review. Vision Research. 2009;49:2686–2704. doi: 10.1016/j.visres.2009.07.005. [DOI] [PubMed] [Google Scholar]
- Fitzpatrick D, Itoh K, Diamond IT. The laminar organization of the lateral geniculate body and the striate cortex in the squirrel monkey (Saimiri sciureus) The Journal of Neuroscience. 1983;3:673–702. doi: 10.1523/JNEUROSCI.03-04-00673.1983. [DOI] [PMC free article] [PubMed] [Google Scholar]
- Gegenfurtner KR. Cortical mechanisms of colour vision. Nature Reviews Neuroscience. 2003;4:563–572. doi: 10.1038/nrn1138. [DOI] [PubMed] [Google Scholar]
- Gegenfurtner KR, Hawken MJ. Temporal and chromatic properties of motion mechanisms. Vision Research. 1995;35:1547–1563. doi: 10.1016/0042-6989(94)00264-m. [DOI] [PubMed] [Google Scholar]
- Gegenfurtner KR, Kiper DC. Color vision. Annual Review of Neuroscience. 2003;26:181–206. doi: 10.1146/annurev.neuro.26.041002.131116. [DOI] [PubMed] [Google Scholar]
- Goddard E, Mannion DJ, McDonald JS, Solomon SG, Clifford CW. Combination of subcortical color channels in human visual cortex. Journal of Vision. 2010;10:25. doi: 10.1167/10.5.25. [DOI] [PubMed] [Google Scholar]
- Hashemi-Nezhad M, Blessing EM, Dreher B, Martin PR. Segregation of short-wavelength sensitive (“blue”) cone signals among neurons in the lateral geniculate nucleus and striate cortex of marmosets. Vision Research. 2008;48:2604–2614. doi: 10.1016/j.visres.2008.02.017. [DOI] [PubMed] [Google Scholar]
- Hass CA, Horwitz GD. V1 mechanisms underlying chromatic contrast detection. Journal of Neurophysiology. 2013 doi: 10.1152/jn.00671.2012. [DOI] [PMC free article] [PubMed] [Google Scholar]
- Hendry SH, Reid RC. The koniocellular pathway in primate vision. Annual Review of Neuroscience. 2000;23:127–153. doi: 10.1146/annurev.neuro.23.1.127. [DOI] [PubMed] [Google Scholar]
- Hendry SH, Yoshioka T. A neurochemically distinct third channel in the macaque dorsal lateral geniculate nucleus. Science. 1994;264:575–577. doi: 10.1126/science.8160015. [DOI] [PubMed] [Google Scholar]
- Horton JC. Cytochrome oxidase patches: A new cytoarchitectonic feature of monkey visual cortex. Philosophical Transactions of the Royal Society of London Series B, Biological Sciences. 1984;304:199–253. doi: 10.1098/rstb.1984.0021. [DOI] [PubMed] [Google Scholar]
- Horwitz GD, Chichilnisky EJ, Albright TD. Cone inputs to simple and complex cells in V1 of awake macaque. Journal of Neurophysiology. 2007;97:3070–3081. doi: 10.1152/jn.00965.2006. [DOI] [PubMed] [Google Scholar]
- Hubener M, Bolz J. Relationships between dendritic morphology and cytochrome oxidase compartments in monkey striate cortex. The Journal of Comparative Neurology. 1992;324:67–80. doi: 10.1002/cne.903240106. [DOI] [PubMed] [Google Scholar]
- Johnson EN, Hawken MJ, Shapley R. Cone inputs in macaque primary visual cortex. Journal of Neurophysiology. 2004;91:2501–2514. doi: 10.1152/jn.01043.2003. [DOI] [PubMed] [Google Scholar]
- Johnson EN, Hawken MJ, Shapley R. The orientation selectivity of color-responsive neurons in macaque V1. The Journal of Neuroscience. 2008;28:8096–8106. doi: 10.1523/JNEUROSCI.1404-08.2008. [DOI] [PMC free article] [PubMed] [Google Scholar]
- Johnson EN, Van Hooser SD, Fitzpatrick D. The representation of S-cone signals in primary visual cortex. The Journal of Neuroscience. 2010;30:10337–10350. doi: 10.1523/JNEUROSCI.1428-10.2010. [DOI] [PMC free article] [PubMed] [Google Scholar]
- Kiper DC, Fenstemaker SB, Gegenfurtner KR. Chromatic properties of neurons in macaque area V2. Visual Neuroscience. 1997;14:1061–1072. doi: 10.1017/s0952523800011779. [DOI] [PubMed] [Google Scholar]
- Krauskopf J, Williams DR, Heeley DW. Cardinal directions of color space. Vision Research. 1982;22:1123–1131. doi: 10.1016/0042-6989(82)90077-3. [DOI] [PubMed] [Google Scholar]
- Lachica EA, Beck PD, Casagrande VA. Parallel pathways in macaque monkey striate cortex: Anatomically defi ned columns in layer III. Proceedings of the National Academy of Sciences of the United States of America. 1992;89:3566–3570. doi: 10.1073/pnas.89.8.3566. [DOI] [PMC free article] [PubMed] [Google Scholar]
- Lennie P, Krauskopf J, Sclar G. Chromatic mechanisms in striate cortex of macaque. The Journal of Neuroscience. 1990;10:649–669. doi: 10.1523/JNEUROSCI.10-02-00649.1990. [DOI] [PMC free article] [PubMed] [Google Scholar]
- Lennie P, Movshon JA. Coding of color and form in the geniculostriate visual pathway (invited review) Journal of the Optical Society of America A, Optics and Image Science. 2005;22:2013–2033. doi: 10.1364/josaa.22.002013. [DOI] [PubMed] [Google Scholar]
- Lindsey DT, Brown AM. Universality of color names. Proceedings of the National Academy of Sciences of the United States of America. 2006;103:16608–16613. doi: 10.1073/pnas.0607708103. [DOI] [PMC free article] [PubMed] [Google Scholar]
- Liu J, Wandell BA. Specializations for chromatic and temporal signals in human visual cortex. The Journal of Neuroscience. 2005;25:3459–3468. doi: 10.1523/JNEUROSCI.4206-04.2005. [DOI] [PMC free article] [PubMed] [Google Scholar]
- Livingstone MS, Hubel DH. Anatomy and physiology of a color system in the primate visual cortex. The Journal of Neuroscience. 1984;4:309–356. doi: 10.1523/JNEUROSCI.04-01-00309.1984. [DOI] [PMC free article] [PubMed] [Google Scholar]
- Lu HD, Roe AW. Functional organization of color domains in V1 and V2 of macaque monkey revealed by optical imaging. Cerebral Cortex. 2008;18:516–533. doi: 10.1093/cercor/bhm081. [DOI] [PMC free article] [PubMed] [Google Scholar]
- Lysakowski A, Standage GP, Benevento LA. An investigation of collateral projections of the dorsal lateral geniculate nucleus and other subcortical structures to cortical areas V1 and V4 in the macaque monkey: A double label retrograde tracer study. Experimental Brain Research. 1988;69:651–661. doi: 10.1007/BF00247317. [DOI] [PubMed] [Google Scholar]
- Malach R. Dendritic sampling across processing streams in monkey striate cortex. The Journal of Comparative Neurology. 1992;315:303–312. doi: 10.1002/cne.903150306. [DOI] [PubMed] [Google Scholar]
- Martin PR, Grunert U. Analysis of the short wavelength-sensitive (“blue”) cone mosaic in the primate retina: Comparison of New World and Old World monkeys. The Journal of Comparative Neurology. 1999;406:1–14. doi: 10.1002/(sici)1096-9861(19990329)406:1<1::aid-cne1>3.0.co;2-1. [DOI] [PubMed] [Google Scholar]
- Mullen KT, Dumoulin SO, McMahon KL, De Zubicaray GI, Hess RF. Selectivity of human retinotopic visual cortex to S-cone-opponent, L/M-cone-opponent and achromatic stimulation. The European Journal of Neuroscience. 2007;25:491–502. doi: 10.1111/j.1460-9568.2007.05302.x. [DOI] [PubMed] [Google Scholar]
- Mullen KT, Thompson B, Hess RF. Responses of the human visual cortex and LGN to achromatic and chromatic temporal modulations: An fMRI study. Journal of Vision. 2010;10:13. doi: 10.1167/10.13.13. [DOI] [PubMed] [Google Scholar]
- Murphey DK, Yoshor D, Beauchamp MS. Perception matches selectivity in the human anterior color center. Current Biology: CB. 2008;18:216–220. doi: 10.1016/j.cub.2008.01.013. [DOI] [PubMed] [Google Scholar]
- Nascimento SM, Ferreira FP, Foster DH. Statistics of spatial cone-excitation ratios in natural scenes. Journal of the Optical Society of America A, Optics and Image Science. 2002;19:1484–1490. doi: 10.1364/josaa.19.001484. [DOI] [PMC free article] [PubMed] [Google Scholar]
- Nathans J. The evolution and physiology of human color vision: Insights from molecular genetic studies of visual pigments. Neuron. 1999;24:299–312. doi: 10.1016/s0896-6273(00)80845-4. [DOI] [PubMed] [Google Scholar]
- Parkes LM, Marsman JB, Oxley DC, Goulermas JY, Wuerger SM. Multivoxel fMRI analysis of color tuning in human primary visual cortex. Journal of Vision. 2009;9:1–13. doi: 10.1167/9.1.1. [DOI] [PubMed] [Google Scholar]
- Roe AW, Ts’o DY. Visual topography in primate V2: Multiple representation across functional stripes. The Journal of Neuroscience. 1995;15:3689–3715. doi: 10.1523/JNEUROSCI.15-05-03689.1995. [DOI] [PMC free article] [PubMed] [Google Scholar]
- Ruderman DL, Cronin TW, Chiao CC. Statistics of cone responses to natural images: Implications for visual coding. Journal of the Optical Society of America A, Optics and Image Science. 1998;15:2036–2045. [Google Scholar]
- Sawatari A, Callaway EM. Diversity and cell type specifi city of local excitatory connections to neurons in layer 3B of monkey primary visual cortex. Neuron. 2000;25:459–471. doi: 10.1016/s0896-6273(00)80908-3. [DOI] [PubMed] [Google Scholar]
- Seidemann E, Poirson AB, Wandell BA, Newsome WT. Color signals in area MT of the macaque monkey. Neuron. 1999;24:911–917. doi: 10.1016/s0896-6273(00)81038-7. [DOI] [PubMed] [Google Scholar]
- Shapley R, Hawken MJ. Color in the cortex: Single- and double-opponent cells. Vision Research. 2011;51:701–717. doi: 10.1016/j.visres.2011.02.012. [DOI] [PMC free article] [PubMed] [Google Scholar]
- Shipp S, Zeki S. The functional organization of area V2, I: Specialization across stripes and layers. Visual Neuroscience. 2002;19:187–210. doi: 10.1017/s0952523802191164. [DOI] [PubMed] [Google Scholar]
- Sincich LC, Horton JC. Divided by cytochrome oxidase: A map of the projections from v1 to v2 in macaques. Science. 2002;295:1734–1737. doi: 10.1126/science.1067902. [DOI] [PubMed] [Google Scholar]
- Sincich LC, Park KF, Wohlgemuth MJ, Horton JC. Bypassing V1: A direct geniculate input to area MT. Nature Neuroscience. 2004;7:1123–1128. doi: 10.1038/nn1318. [DOI] [PubMed] [Google Scholar]
- Smithson HE, Mollon JD. Is the S-opponent chromatic sub-system sluggish? Vision Research. 2004;44:2919–2929. doi: 10.1016/j.visres.2004.06.022. [DOI] [PubMed] [Google Scholar]
- Solomon SG, Lennie P. Chromatic gain controls in visual cortical neurons. The Journal of Neuroscience. 2005;25:4779–4792. doi: 10.1523/JNEUROSCI.5316-04.2005. [DOI] [PMC free article] [PubMed] [Google Scholar]
- Solomon SG, Peirce JW, Lennie P. The impact of suppressive surrounds on chromatic properties of cortical neurons. The Journal of Neuroscience. 2004;24:148–160. doi: 10.1523/JNEUROSCI.3036-03.2004. [DOI] [PMC free article] [PubMed] [Google Scholar]
- Stockman A, MacLeod DI, DePriest DD. The temporal properties of the human short-wave photoreceptors and their associated pathways. Vision Research. 1991;31:189–208. doi: 10.1016/0042-6989(91)90111-h. [DOI] [PubMed] [Google Scholar]
- Stoughton CM, Lafer-Sousa R, Gagin G, Conway BR. Psychophysical chromatic mechanisms in macaque monkey. The Journal of Neuroscience. 2012;32:15216–15226. doi: 10.1523/JNEUROSCI.2048-12.2012. [DOI] [PMC free article] [PubMed] [Google Scholar]
- Sumner P, Anderson EJ, Sylvester R, Haynes JD, Rees G. Combined orientation and colour information in human V1 for both L-M and S-cone chromatic axes. Neuroimage. 2008;39:814–824. doi: 10.1016/j.neuroimage.2007.09.013. [DOI] [PubMed] [Google Scholar]
- Sun H, Smithson HE, Zaidi Q, Lee BB. Do magnocellular and parvocellular ganglion cells avoid short-wavelength cone input? Visual Neuroscience. 2006;23:441–446. doi: 10.1017/S0952523806233042. [DOI] [PMC free article] [PubMed] [Google Scholar]
- Tailby C, Solomon SG, Dhruv NT, Lennie P. Habituation reveals fundamental chromatic mechanisms in striate cortex of macaque. The Journal of Neuroscience. 2008a;28:1131–1139. doi: 10.1523/JNEUROSCI.4682-07.2008. [DOI] [PMC free article] [PubMed] [Google Scholar]
- Tailby C, Solomon SG, Lennie P. Functional asymmetries in visual pathways carrying S-cone signals in macaque. The Journal of Neuroscience. 2008b;28:4078–4087. doi: 10.1523/JNEUROSCI.5338-07.2008. [DOI] [PMC free article] [PubMed] [Google Scholar]
- Tanigawa H, Lu HD, Roe AW. Functional organization for color and orientation in macaque V4. Nature Neuroscience. 2010;13:1542–1548. doi: 10.1038/nn.2676. [DOI] [PMC free article] [PubMed] [Google Scholar]
- Tootell RB, Nelissen K, Vanduffel W, Orban GA. Search for color ‘center(s)’ in macaque visual cortex. Cerebral Cortex. 2004;14:353–363. doi: 10.1093/cercor/bhh001. [DOI] [PubMed] [Google Scholar]
- Tootell RB, Silverman MS, De Valois RL, Jacobs GH. Functional organization of the second cortical visual area in primates. Science. 1983;220:737–739. doi: 10.1126/science.6301017. [DOI] [PubMed] [Google Scholar]
- Ts’o DY, Gilbert CD. The organization of chromatic and spatial interactions in the primate striate cortex. The Journal of Neuroscience. 1988;8:1712–1727. doi: 10.1523/JNEUROSCI.08-05-01712.1988. [DOI] [PMC free article] [PubMed] [Google Scholar]
- Valverde Salzmann MF, Bartels A, Logothetis NK, Schuz A. Color blobs in cortical areas V1 and V2 of the new world monkey Callithrix jacchus, revealed by non-differential optical imaging. The Journal of Neuroscience. 2012;32:7881–7894. doi: 10.1523/JNEUROSCI.4832-11.2012. [DOI] [PMC free article] [PubMed] [Google Scholar]
- Wachtler T, Sejnowski TJ, Albright TD. Representation of color stimuli in awake macaque primary visual cortex. Neuron. 2003;37:681–691. doi: 10.1016/s0896-6273(03)00035-7. [DOI] [PMC free article] [PubMed] [Google Scholar]
- Weller RE, Steele GE, Kaas JH. Pulvinar and other subcortical connections of dorsolateral visual cortex in monkeys. The Journal of Comparative Neurology. 2002;450:215–240. doi: 10.1002/cne.10298. [DOI] [PubMed] [Google Scholar]
- Wikler KC, Rakic P. Distribution of photoreceptor subtypes in the retina of diurnal and nocturnal primates. The Journal of Neuroscience. 1990;10:3390–3401. doi: 10.1523/JNEUROSCI.10-10-03390.1990. [DOI] [PMC free article] [PubMed] [Google Scholar]
- Xiao B, Wade AR. Measurements of long-range suppression in human opponent S-cone and achromatic luminance channels. Journal of Vision. 2010;10:10. doi: 10.1167/10.13.10. [DOI] [PubMed] [Google Scholar]
- Xiao Y, Casti A, Xiao J, Kaplan E. Hue maps in primate striate cortex. Neuroimage. 2007;35:771–786. doi: 10.1016/j.neuroimage.2006.11.059. [DOI] [PMC free article] [PubMed] [Google Scholar]
- Xiao Y, Felleman DJ. Projections from primary visual cortex to cytochrome oxidase thin stripes and interstripes of macaque visual area 2. Proceedings of the National Academy of Sciences of the United States of America. 2004;101:7147–7151. doi: 10.1073/pnas.0402052101. [DOI] [PMC free article] [PubMed] [Google Scholar]
- Xiao Y, Kavanau C, Bertin L, Kaplan E. The biological basis of a universal constraint on color naming: Cone contrasts and the two-way categorization of colors. PLoS One. 2011;6:e24994. doi: 10.1371/journal.pone.0024994. [DOI] [PMC free article] [PubMed] [Google Scholar]
- Xiao Y, Wang Y, Felleman DJ. A spatially organized representation of colour in macaque cortical area V2. Nature. 2003;421:535–539. doi: 10.1038/nature01372. [DOI] [PubMed] [Google Scholar]
- Yoshioka T, Levitt JB, Lund JS. Independence and merger of thalamocortical channels within macaque monkey primary visual cortex: Anatomy of interlaminar projections. Visual Neuroscience. 1994;11:467–489. doi: 10.1017/s0952523800002406. [DOI] [PubMed] [Google Scholar]
- Zeki S. The representation of colours in the cerebral cortex. Nature. 1980;284:412–418. doi: 10.1038/284412a0. [DOI] [PubMed] [Google Scholar]