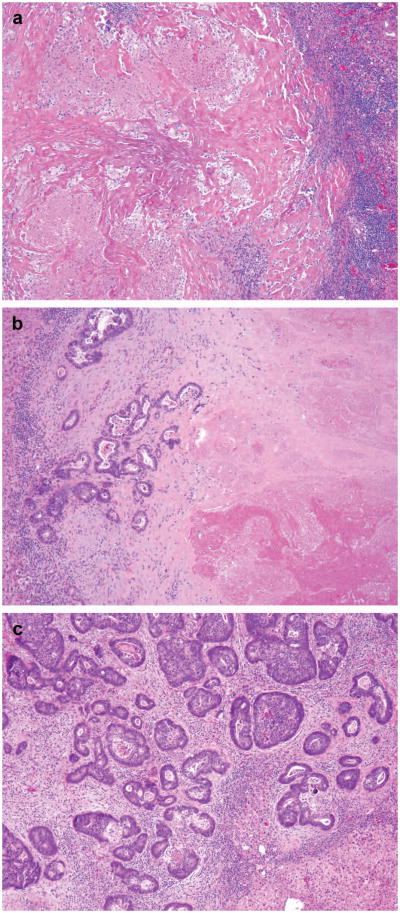
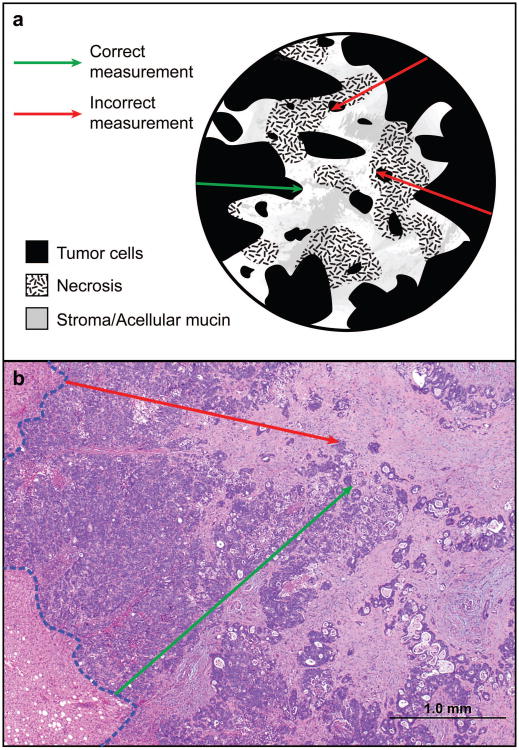
Figure 1.
(A) Photomicrographs of representative examples of complete (a), major (b), and minor pathologic response (c). (a) shows tumor bed with necrotic debris, hyalinized/collagenized tissue and inflammatory cells with no tumor cells, (b) shows neoplastic glands occupying less than half of the tumor bed and (c) shows neoplastic glands occupying majority (>50%) of the tumor bed admixed with minor component of fibrocollagenous stroma with inflammation. (B) Cartoon (a) and photomicrograph (b) demonstrating correct and incorrect method of measuring tumor thickness at the tumor–normal liver interface. (a) shows rumor cells/neoplastic glands as homogenous dark area of the tumor bed. Different stromal components are shown with other symbols. The outer layer of the circle represents the tumor-normal liver interface. (b) Hematoxylin and eosin stained section showing normal liver parenchyma in the left lower corner, tumor normal liver interface highlighted with blue interrupted line. In both (a) and (b) The green arrow shows longest area of tumor cells without admixed stroma, necrosis or inflammation. Red arrow indicated focus with layer of tumor cells interrupted by fibrosis/necrosis.


