

H-NS is a bacterial folding factor that has been implicated in the silencing of horizontally acquired genes. These genes are thought to be toxic by virtue of their A/T content. Here, Singh et al. show that a major, long-overlooked function of H-NS is to prevent widespread initiation of noncoding transcripts within foreign genes. This study provides a molecular rationalization for the toxicity of horizontally acquired DNA and explains how this is counteracted by H-NS.
Keywords: H-NS, nucleoid, pervasive transcription
Abstract
Widespread intragenic transcription initiation has been observed in many species. Here we show that the Escherichia coli ehxCABD operon contains numerous intragenic promoters in both sense and antisense orientations. Transcription from these promoters is silenced by the histone-like nucleoid structuring (H-NS) protein. On a genome-wide scale, we show that 46% of H-NS-suppressed transcripts in E. coli are intragenic in origin. Furthermore, many intergenic promoters repressed by H-NS are for noncoding RNAs (ncRNAs). Thus, a major overlooked function of H-NS is to prevent transcription of spurious RNA. Our data provide a molecular description for the toxicity of horizontally acquired DNA and explain how this is counteracted by H-NS.
Pervasive transcription is a phenomenon ubiquitous across the three domains of life (Dornenburg et al. 2010). It is defined by an undercurrent of noncanonical transcripts within the primary transcriptome (Clark et al. 2011). In bacteria, such transcripts arise from normal promoter elements but are conspicuous because they are noncoding, not delineated by gene boundaries, and sometimes antisense (Peters et al. 2012). Sites of pervasive transcription are poorly conserved. Hence, even between closely related bacteria, patterns of pervasive transcription differ (Raghavan et al. 2012). This has led to speculation that pervasive transcription is a consequence of the evolution of protein-coding genes (Peters et al. 2012; Raghavan et al. 2012). It is likely that pervasive transcription is suppressed, as spurious RNA synthesis is potentially catastrophic. Synthesis, stability, and translation of mRNA may be perturbed (Dornenburg et al. 2010), and formation of R loops (DNA:RNA hybrids) can destabilize genome integrity (Gowrishankar and Harinarayanan 2004).
In Escherichia coli, there are two major sources of pervasive transcription: inefficient termination of RNA synthesis at gene boundaries and spurious transcription initiation in genes (Dornenburg et al. 2010; Peters et al. 2012). Attention has turned to elucidating mechanisms that suppress these phenomena. As a first step, Peters et al. (2012) identified Rho and the cofactor NusG as suppressors of pervasive antisense transcription. In their model, Rho acts via two pathways. First, Rho ensures termination of transcripts at gene boundaries, preventing “leaky” transcription of downstream genes. Second, Rho terminates antisense transcripts arising from promoters in genes. Thus, on a global scale, noncanonical transcripts are targeted for termination. However, since most transcription is regulated at the level of initiation (Browning and Busby 2004), additional mechanisms to suppress pervasive transcription are likely.
The histone-like nucleoid structuring (H-NS) protein is a DNA folding factor. It is abundant in bacteria and influences transcription (Dillon and Dorman 2010). Nucleoprotein containing H-NS is structurally diverse; H-NS can form bridged or filamentous DNA complexes (Dame et al. 2006; Liu et al. 2010). Two mechanisms for transcriptional repression by H-NS have been proposed: (1) exclusion, in which H-NS masks RNA polymerase (RNAP)-binding sites (Lim et al. 2012), and (2) trapping, in which H-NS ensnares initiating RNAP in DNA loops (Dame et al. 2002). H-NS may also slow elongation, leading to increased Rho-dependent termination (Peters et al. 2012). Chromatin immunoprecipitation (ChIP) has been used to map binding of H-NS across bacterial chromosomes (Grainger et al. 2006; Lucchini et al. 2006; Navarre et al. 2006; Oshima et al. 2006; Kahramanoglou et al. 2011). These studies show that H-NS targets A/T-rich DNA, a distinguishing feature of horizontally acquired genes. Consequently, H-NS has been proposed to facilitate genome evolution by silencing transcription of foreign DNA (Navarre et al. 2006). A central tenet of this model is that foreign DNA is toxic. However, a molecular explanation for this toxicity and how H-NS counteracts this is lacking.
Here, we describe widespread suppression of intragenic transcription initiation in bacteria. We show that this is a major function of H-NS. First, we show that H-NS represses transcription from many intragenic promoters within the A/T-rich ehxCABD operon of E. coli O157:H7. Second, we show that most H-NS-repressed promoters genome-wide in E. coli K-12 are for noncoding RNAs (ncRNAs), with many promoters located inside genes. Third, we show that suppression of widespread intragenic transcription is a likely function of H-NS analogs in diverse bacterial species.
Results and Discussion
The enterohemorrhagic E. coli O157:H7 ehxCABD operon contains many intragenic promoters
The ehxCABD operon is a well-characterized H-NS target (Li et al. 2008; Rogers et al. 2009; Iyoda et al. 2011). Our previous analysis of ehxCABD suggested the existence of intragenic promoters (Singh and Grainger 2013). We began here by scanning the operon for sequences that resemble promoter −10 elements. As a control, we applied the same analysis to the E. coli O157:H7 and K-12 genomes. For ehxCABD, our analysis identified 95 putative intragenic −10 elements, an approximately fourfold enrichment over the genome averages for both E. coli strains. To test for function, we cloned the 95 sequences, each on a 62-base-pair (bp) DNA fragment, upstream of lacZ in the reporter plasmid pRW50 (Supplemental Fig. S1). In some cases, predicted −10 elements overlapped. Hence, we were able to clone the 95 sequences on 83 DNA fragments. Twenty of the fragments stimulated β-galactosidase activity twofold or more above background (Fig. 1). We selected five of the 20 active constructs representing sense and antisense promoters with a wide range of activities (labeled a–e in Fig. 1) and examined the effects of disrupting the predicted −10 element. In all cases, this resulted in a significant decrease in β-galactosidase activity (Supplemental Fig. S2).
Figure 1.

The E. coli ehxCABD operon contains many intragenic promoters. β-Galactosidase activity driven by short intragenic ehxCABD promoter fragments in strain JCB387. The top chart shows the activity of promoters that drive sense transcription, and the bottom chart shows the activity of promoters that drive antisense transcription. Each data point is aligned with the corresponding section of the ehxCABD operon. Data points labeled a–e correspond to promoters used in further experiments. The red bar represents the canonical promoter for ehxCABD. Background activity (empty pRW50) is shown by a green line.
Direct repression of intragenic promoters in the ehxCABD operon by H-NS
Transcription of ehxCABD is well characterized as being repressed by H-NS (Li et al. 2008; Rogers et al. 2009; Iyoda et al. 2011). Despite this, H-NS is unable to block transcription from the canonical ehxCABD promoter (Singh and Grainger 2013). We hypothesized that H-NS acts via the intragenic ehxCABD promoters. To test this, we measured β-galactosidase activity in wild-type and Δhns cells containing different sections of ehxCABD fused to lacZ in plasmid pRW50. First, we examined a large, 5429-bp section of ehxCABD lacking the canonical upstream promoter. Transcription initiating in this coding DNA, which is repressed fivefold by H-NS, must be due to intragenic promoters (Fig. 2A, panel i). Sequential removal of upstream sequences reduces repression by H-NS (Fig. 2A, panel ii). Similarly, transcription from promoters a–e was unaffected by H-NS in the context of the 62-bp fragments (Fig. 2A, panel iii). We conclude that H-NS represses transcription from intragenic ehxCABD promoters, but repression requires extensive flanking DNA. Note that the sequence of the flanking DNA is also crucial because, when flanked by plasmid DNA, the 62-bp ehxCABD fragments were not subject to repression by H-NS.
Figure 2.

H-NS suppresses intragenic ehxCABD transcription. (A) H-NS suppresses intragenic ehxCABD transcription in vivo. β-Galactosidase activity stimulated by ehxCABD fragments fused to lacZ in plasmid pRW50. Intragenic promoters a–e are labeled. β-Galactosidase activity was measured in MG1655 and the Δhns derivative. Background β-galactosidase activity, obtained with empty pRW50 vector, was subtracted from the values shown. Experiments were done in triplicate, and the standard deviation was always <10% of the mean. (B) H-NS binds promoters within the ehxCABD operon in vivo. ChIP-PCR was used to measure binding of H-NS at intragenic ehxCABD loci cloned in pRW50. PCR products were generated with primers to detect the five intragenic ehxCABD promoters, a–e. (C) H-NS binds promoters within the ehxCABD operon in vitro. Electrophoretic mobility shift assays with either small (62-bp) or large (5429-bp) fragments of ehxCABD. The different small DNA fragments are labeled a–e. H-NS was added at a concentration of 4 μM or 8 μM. (D) H-NS suppresses intragenic ehxCABD transcription in vitro. A run-off in vitro transcription assay using DNA templates consisting of the whole ehxCABD operon with (7435 bp) and without (6435 bp) the upstream regulatory region. The gel was calibrated with a sequencing reaction (lane 1) and the radiolabeled DNA template (lane 2). RNAP was used at a concentration of 200 nM (lanes 3–16), and H-NS was added at concentrations of 150, 300, 600, 750, 1500, and 3000 nM (lanes 4–9,11–16).
Given that H-NS repressed intragenic ehxCABD promoters only in the context of larger ehxCABD fragments, we predicted that H-NS would bind tightly throughout the operon but weakly to small fragments in pRW50. Consistent with this, H-NS forms bridged and filamentous complexes with DNA that are more stable than isolated H-NS-binding events (Bouffartigues et al. 2007). Hence, we measured binding of H-NS to promoters a–e in the context of the large (5429-bp) and short (62-bp) fragments of ehxCABD cloned in pRW50. ChIP was used to measure binding of H-NS to the different targets in vivo. Figure 2B shows PCR analysis of DNA immunoprecipitated with anti-H-NS. Control experiments analyzing DNA recovered from mock immunoprecipitations are also shown. As predicted, loci a–e bind H-NS in the context of the large ehxCABD fragment (Fig. 2B, top panel). Conversely, H-NS did not bind the same loci when they were isolated from the rest of the operon (Fig. 2B, bottom panel). No enrichment of the control chromosomal yabN locus, which is not bound by H-NS, was detected in any immunoprecipitate (Supplemental Fig. S3). In complementary experiments, we measured binding of H-NS to the same DNA fragments in vitro using electrophoretic mobility shift assays (EMSAs). H-NS bound to the 5429-bp ehxCABD fragment but not the short intragenic promoter fragments (Fig. 2C).
To confirm direct H-NS-mediated repression of intragenic ehxCABD promoters, we recapitulated the phenomenon in vitro. Two DNA fragments were used as templates for in vitro transcription: a 7435-bp DNA fragment containing the entire ehxCABD operon and upstream region (Fig. 2D, lanes 3–9) and a 6435-bp fragment lacking the upstream region and canonical promoter (Fig. 2D, lanes 10–16). RNAP catalyzed the synthesis of multiple transcripts of varying size from each template. Consistent with a previous report (Singh and Grainger 2013), transcription from the canonical ehxCABD promoter was unaffected by the addition of H-NS, even at high concentrations (7312-nucleotides [nt] RNA) (Fig. 2D, lanes 3–9). Conversely, synthesis of shorter transcripts, ranging from <100 nt to thousands of nucleotides in length, was dramatically reduced by increasing concentrations of H-NS (Fig. 2D, lanes 4–9,11–16). The similarity of transcript profiles synthesized from the two templates confirms that the short RNAs arise from internal initiation events and not from stalled transcription from the canonical promoter.
Widespread repression of intragenic promoters by H-NS
To determine whether H-NS suppresses intragenic transcription at other loci, we investigated the effect of H-NS on genome-wide transcription initiation in E. coli K-12. We chose E. coli K-12 because (1) H-NS has been studied most extensively in this strain, (2) H-NS in E. coli K-12 is 100% identical to that in E. coli O157:H7, and (3) high-resolution genome-wide binding data for H-NS, generated using ChIP sequencing (ChIP-seq), are available. As a starting point, we determined association of σ70 with the E. coli K-12 genome in wild-type and Δhns cells using ChIP-seq. Thus, we identified the location of promoter-bound RNAP and the level of occupancy (Supplemental Table S1). In parallel, we identified transcription start sites (TSSs) genome-wide in wild-type and Δhns cells using a modified RNA sequencing (RNA-seq) approach (Singh and Wade 2014). This method also determines the relative abundance of RNAs associated with each TSS (“TSS strength”). Together, these data identify sites of transcription initiation with high confidence and nucleotide resolution. Visual inspection of the data revealed many promoters repressed by H-NS (Fig. 3A). These promoters typically correspond to regions of high H-NS binding (Kahramanoglou et al. 2011). Repression was reflected by increases in both σ70 occupancy and TSS strength in the Δhns mutant. Many of the H-NS-repressed promoters are located in genes.
Figure 3.

H-NS suppresses hundreds of intragenic promoters genome-wide. (A) Examples of promoters repressed by H-NS. Three genomic regions are shown. Data for H-NS occupancy are shown by the brown graph. The dashed line indicates the cutoff separating H-NS “high” and “low” regions. σ70 ChIP-seq data from wild-type cells are shown in green, and data from Δhns cells are shown in purple. TSS scores (sequence read density for a given TSS) from wild-type (green) and Δhns (purple) cells are also shown. The TSS score is shown only for TSSs identified in the Δhns mutant that were collocated with a σ70 ChIP-seq peak. The scale for H-NS ChIP-seq data is the same in all three panels. The scales for σ70 ChIP-seq and TSS data are different in each panel but consistent within each panel. (B) H-NS reduces binding of σ70 at many promoters. Scatter plot showing ChIP-seq σ70 occupancy for wild-type and Δhns cells. Each data point represents a σ70 ChIP-seq peak from the Δhns mutant that was collocated with a TSS. Blue and red data points are for σ70 peaks in low and high H-NS regions, respectively. (C) H-NS reduces transcription from many promoters. Scatter plot showing TSS strength for wild-type and Δhns cells. Each data point represents a TSS from the Δhns mutant that was collocated with a σ70 ChIP-seq peak. Blue and red data points are for TSSs in low and high H-NS regions, respectively. (D) H-NS occludes σ70 from promoters inside genes, especially those that are horizontally acquired or have been described as being repressed by H-NS. Box plot showing the distribution of the ratio of σ70 occupancy in wild-type/Δhns cells, as determined using ChIP-seq, for selected groups of promoters (σ70 ChIP-seq peaks collocated with TSSs). Boxes indicate the 25th–75th percentile. Horizontal lines indicate the median value. The whiskers indicate the 5th–95th percentile. The number of contributing promoters is indicated. Categories of promoters tested were (1) promoters in high H-NS regions, (2) promoters in low H-NS regions, (3) intragenic promoters in high H-NS regions, (4) intergenic promoters in high H-NS regions, (5) promoters in high H-NS regions that are <227 bp from the nearest appropriately orientated annotated gene start (mRNA), (6) promoters in high H-NS regions that are ≥227 bp from the nearest appropriately orientated annotated gene start (ncRNA), (7) promoters in horizontally acquired genes, and (8) promoters in genes described previously as being repressed by H-NS. (E) H-NS represses transcription from promoters inside genes, especially those that are horizontally acquired or have been described as being repressed by H-NS. Box plot showing the distribution of the ratio of TSS strength in wild-type/Δhns cells (TSSs collocated with σ70 ChIP-seq peaks). Boxes indicate the 25th–75th percentile. Horizontal lines indicate the median value. The whiskers indicate the 5th–95th percentile. The number of contributing promoters is indicated. The categories of promoters tested match those for D. (F) Promoters in H-NS regions are often far from gene starts. Cumulative frequency distribution for the distance of TSSs (from ChIP-seq peak/TSS pairs) from the nearest appropriately orientated, annotated gene start for TSSs in low H-NS (blue line) and high H-NS (red line) regions. For a distance, x, on the X-axis, the value on the Y-axis indicates the proportion of TSSs that are ≤x bp from the nearest appropriately orientated, annotated gene start. The dashed line indicates 227 bp. (G) Promoters in H-NS regions are often intragenic and/or drive transcription of ncRNAs. Pie charts showing the distribution of TSS location relative to genes in Δhns cells.
We selected σ70 ChIP-seq peaks that collocated with TSSs in the Δhns mutant. Thus, we identified 668 promoters with associated information for σ70 occupancy, TSS strength, and TSS orientation (Supplemental Table S1). We divided the promoters into “low H-NS” (508 promoters) and “high H-NS” (160 promoters) categories based on the level of H-NS binding. For each promoter, σ70 binding or TSS strength was compared in Δhns and wild-type cells. The result of the comparison is in Figure 3, B (for σ70 binding) and C (for TSS strength). In the scatter plots, each data point represents one of the 668 promoters. Consistent with H-NS-mediated repression, association of σ70 with promoters in high H-NS regions was significantly higher in Δhns cells than in wild-type cells (Mann Whitney U test, normal approximation, P = 1.4 × 10⁻²³) (Fig. 3B). Similarly, for high H-NS regions, TSS strength was significantly higher in Δhns cells (Mann Whitney U test, normal approximation, P = 2.7 × 10⁻¹⁰) (Fig. 3C). In contrast, for low H-NS regions, neither σ70 binding nor TSS strength was significantly different in Δhns and wild-type cells (Mann Whitney U test, normal approximation, P = 0.29 for σ70 occupancy and P = 0.23 for TSS strength) (Fig. 3B,C). Data for all 668 promoters are summarized in Figure 3, D (σ70 binding) and E (TSS strength). As expected, the mean wild-type/Δhns ratio for both σ70 binding and TSS strength is close to 1.0 in low H-NS regions (Fig. 3D,E, blue box). Conversely, the equivalent ratio is 0.2 or 0.3 for high H-NS regions (Figs. 3D,E, first red box). Taken together, our data indicate that high H-NS occupancy reduces the binding of initiating RNAP and represses transcription, consistent with previous studies (Dillon and Dorman 2010).
We next examined the position of the 668 promoters with respect to genes. Promoters in high H-NS regions are far more likely to be inside genes (46% of promoters) than promoters in low H-NS regions (19% of promoters; Fisher's exact test, P = 2.0 × 10⁻¹¹). However, an intragenic or intergenic location for a promoter does not fully describe its genomic context. For example, an intergenic promoter may be orientated opposite to surrounding genes and unable to drive mRNA transcription. Conversely, an intragenic promoter may be close to a correctly orientated gene, as is the case for many known mRNA promoters (Keseler et al. 2013). Hence, we next determined the distance between each of the 668 promoters and the nearest properly orientated gene. These distances represent the length of potential mRNA 5′ untranslated regions (UTRs). Of the 5′ UTRs reported by RegulonDB, 95% are <227 nt in length (Salgado et al. 2013). However, only 41% of potential 5′ UTRs in high H-NS regions are <227 nt in length. This is significantly lower than in low H-NS regions, where 80% of mRNA 5′ UTRs are <227 nt in length (Mann Whitney U test, normal approximation, P = 2.4 × 10⁻²¹) (Fig. 3F). We conclude that most promoters in regions bound by H-NS, including 31% of intergenic promoters (Fig. 3G, dark-green sector of right pie chart), likely drive synthesis of spurious ncRNAs (i.e., ncRNAs lacking function). However, we do not exclude the possibility that a small number of such promoters drive synthesis of an annotated regulatory RNA or mRNA. The genomic context of promoters in high and low H-NS regions is summarized in Figure 3G. Interestingly, while both intragenic and intergenic promoters in high H-NS regions are repressed by H-NS, repression of intragenic promoters is significantly greater (Mann Whitney U test, normal approximation, P = 0.03 for σ70 occupancy and P = 0.01 for TSS strength) (Fig. 3D,E, cf. the first three red data points). Thus, intragenic promoters are more likely to be repressed and are more strongly repressed by H-NS. Importantly, intragenic promoters in H-NS-bound regions are indistinguishable from all other promoters with respect to DNA sequence (Supplemental Fig. S4).
We next compared the position of H-NS-repressed promoters with horizontally acquired genes in the known H-NS regulon. Strikingly, intragenic promoters repressed by H-NS align with both horizontally acquired DNA and genes proposed to be repressed by H-NS (Fig. 3D,E, final two data points; Supplemental Table S1; Garcia-Vallve et al. 2003; Kahramanoglou et al. 2011;). We note that previous studies used microarray-based approaches unable to distinguish canonical mRNAs from ncRNAs. We conclude that many previous observations of repression by H-NS are in fact due to repression of promoters inside genes.
Binding of H-NS analogs coincides with predicted intragenic promoters in diverse bacterial species
MvaT and Lsr2 are functional analogs of H-NS in Pseudomonas spp. and Mycobacterium spp., respectively. For both proteins, ChIP–chip has been used to measure binding across the cognate genome (Castang et al. 2008; Gordon et al. 2010). Fortuitously, promoters for primary σ factors do not vary greatly between these species and E. coli (Potvin et al. 2008; Sachdeva et al. 2010). Hence, we were able to use the same approach used for the E. coli genomes to search for −10 hexamers. We then compared the position of these putative −10 hexamers with binding of MvaT/Lsr2. Putative promoters were enriched approximately fivefold in MvaT-bound (χ2 test, P = 8.9 × 10⁻⁹) and Lsr2-bound (χ2 test, P = 5.5 × 10⁻⁴) regions. Furthermore, most putative promoters in MvaT- and Lsr2-bound regions were located in genes (58% for Pseudomonas aeruginosa and 78% for Mycobacterium tuberculosis). Thus, MvaT and Lsr2 are likely to be suppressors of intragenic transcription.
Conclusions
H-NS has been proposed to facilitate genome evolution by binding horizontally acquired DNA. Previous studies have concluded that H-NS silences such genes solely by repressing canonical transcription (Fig. 4A). In contrast, we show that the primary function of H-NS is to silence spurious transcription of ncRNAs, often inside the genes previously described as being H-NS-repressed (Fig. 4B). Hence, the fitness defect of deleting hns is likely due in part to increased spurious transcription. We suggest that, by suppressing intragenic transcription, H-NS prevents misappropriation of cellular resources, the formation of dangerous nucleic acid structures, and transcription interference. We note that the two models for H-NS function shown in Figure 4 are indistinguishable using DNA microarray-based approaches that cannot resolve canonical mRNAs and spurious ncRNAs. Thus, while we have identified a largely new set of H-NS regulated promoters, these promoters coincide with the existing H-NS regulon. Previous bioinformatic screens predicted that H-NS-bound genes contain promoters (Tutukina et al. 2007). Such genes are often horizontally acquired, are A/T-rich, and have many TpA steps common to both H-NS targets and promoter −10 elements (Bouffartigues et al. 2007; Singh et al. 2011). Hence, these genes are ideal candidates for recognition by H-NS or its functional analogs and for spurious RNAP binding. In such regions, high-affinity canonical promoters and transcription factors likely play a key role, along with H-NS, in facilitating specific transcription.
Figure 4.
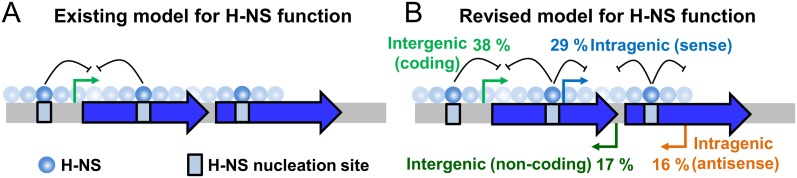
A new model for silencing at horizontally acquired genes by H-NS.
Materials and methods
Strains and plasmids
E. coli JCB387 Δnir Δlac and MG1655 have been described (Page et al. 1990; Keseler et al. 2013). The Δhns MG1655 derivative (Fig. 2) was provided by Ding Jin. Plasmid pRW50 was described by Lodge et al. (1992). The 7435-bp ehxCABD fragment was synthesized by DNA2.0 and contained silent mutations to remove restriction sites to facilitate cloning. The ∼62-bp ehxCABD fragments were generated with oligonucleotides (Supplemental Table S2). A small number of fragments contained more than one putative promoter and were thus larger (up to 80 bp). Mutations in −10 elements were introduced with oligonucleotide derivatives (Supplemental Table S2). Mutations were numbered on the assumption that −10 elements are 7 bp upstream of a TSS. The Δhns∷kanR MG1655 derivative used for ChIP-seq was constructed by P1 transduction of Δhns∷kanR from BW25113 Δhns∷kanR (Baba et al. 2006) into MG1655. Derivatives of BW25113 [Δ(araD-araB)567, ΔlacZ4787(∷rrnB-3), λ-, rph-1, Δ(rhaD-rhaB)568, and hsdR514] were used for TSS mapping. Unmarked BW25113 ΔrppH was constructed by removal of kanR from BW25113 ΔrppH∷kanR using FLP recombinase from plasmid pCP20 (Datsenko and Wanner 2000). BW25113 ΔrppH Δhns∷kanR was constructed by P1 transduction of Δhns∷kanR from BW25113 Δhns∷kanR into the unmarked BW25113 ΔrppH.
Promoter DNA fragments and in vivo gene expression assays
β-Galactosidase assays were done using the protocol of Miller (1972). All assay values are the mean of three independent experiments with a standard deviation >10% of the mean. Cells were grown aerobically at 37°C to mid-log phase in LB medium.
Proteins, EMSA, and in vitro transcription assays
H-NS and RNAP were prepared as described (Grainger et al. 2008). DNA for EMSA was generated by PCR using the oligonucleotides listed in Supplemental Table S1. DNA fragments were cut with HindIII, end-labeled using (γ-32P)-ATP, and used at ∼10 nM concentration. The in vitro transcription assay was done as described by Grainger et al. (2008). DNA templates were generated by PCR with the oligonucleotides listed in Supplemental Table S2. The template (∼16 µg mL−1) was preincubated with purified H-NS in 20 mM Tris (pH 7.9), 5 mM MgCl2, 500 µM DTT, 50 mM KCl, 100 µg mL−1 BSA, 200 µM ATP, 200 µM GTP, 200 µM CTP, and 10 µM UTP with 5 µCi (α-32P)-UTP. The reaction was started with 400 nM E. coli RNAP. Transcripts were analyzed on a denaturing polyacrylamide gel.
Bioinformatic analysis of promoters
We used our alignment of 554 E. coli promoters to determine selection criteria (Singh et al. 2011). Thus, putative −10 elements were chosen if they matched the sequence 5′-TAnAAT-3′, 5′-TATnAT-3′ or 5′-TATAnT-3′. The GenoList database (http://genolist.pasteur.fr) was used to interrogate bacterial genomes and determine the distribution of potential −10 hexamers between genes and noncoding DNA. We used the list of MvaT-bound regions described by Castang et al. (2008). Lsr2-bound regions in M. tuberculosis H37Rv were determined by applying a cutoff of 1.5 to the ChIP–chip data set of Gordon et al. (2010).
ChIP, Chip-seq, and TSS mapping
Targeted ChIP experiments (Fig. 2) were done as described (Singh and Grainger 2013) using ehxCABD fragments cloned in pRW50. For ChIP-seq experiments, cultures were inoculated 1:100 in LB with fresh overnight cultures of MG1655 or MG1655 Δhns∷kanR, and cells were grown at 225 rpm at 30°C to an OD600 of 0.5–0.6. Protocols for ChIP-seq, TSS mapping, and analysis of these data are described in Supplemental Appendix S1.
Acknowledgments
We thank Simon Dove for MvaT ChIP–chip data, and Ding Jin for strains. We thank Randy Morse, Keith Derbyshire, Todd Gray, Doug Browning, and our laboratory members for helpful discussions. We thank the Wadsworth Center Bioinformatics Core Facility and Prateek Sharma for support. Our work was funded by a Wellcome Trust Career Development Fellowship (D.C.G.) and a National Institutes of Health Director's New Innovator Award (1DP2OD007188 to J.T.W.). This material is based on work supported by the National Science Foundation Graduate Research Fellowship under grant number DGE-1060277 (D.M.F.).
Footnotes
Supplemental material is available for this article.
Article published online ahead of print. Article and publication date are online at http://www.genesdev.org/cgi/doi/10.1101/gad.234336.113.
Freely available online through the Genes & Development Open Access option.
References
- Baba T, Ara T, Hasegawa M, Takai Y, Okumura Y, Baba M, Datsenko KA, Tomita M, Wanner BL, Mori H 2006. Construction of Escherichia coli K-12 in-frame, single-gene knockout mutants: The Keio collection. Mol Syst Biol. doi: 10.1038/msb4100050 [DOI] [PMC free article] [PubMed]
- Bouffartigues E, Buckle M, Badaut C, Travers A, Rimsky S 2007. H-NS cooperative binding to high-affinity sites in a regulatory element results in transcriptional silencing. Nat Struct Mol Biol 14: 441–448 [DOI] [PubMed] [Google Scholar]
- Browning DF, Busby SJ 2004. The regulation of bacterial transcription initiation. Nat Rev Microbiol 21: 57–65 [DOI] [PubMed] [Google Scholar]
- Castang S, McManus HR, Turner KH, Dove SL 2008. H-NS family members function coordinately in an opportunistic pathogen. Proc Natl Acad Sci 105: 18947–18952 [DOI] [PMC free article] [PubMed] [Google Scholar]
- Clark MB, Amaral PP, Schlesinger FJ, Dinger ME, Taft RJ, Rinn JL, Ponting CP, Stadler PF, Morris KV, Morillon A, et al. 2011. The reality of pervasive transcription. PLoS Biol 97: e1000625. [DOI] [PMC free article] [PubMed] [Google Scholar]
- Datsenko KA, Wanner BL 2000. One-step inactivation of chromosomal genes in Escherichia coli K-12 using PCR products. Proc Natl Acad Sci 97: 6640–6645 [DOI] [PMC free article] [PubMed] [Google Scholar]
- Dame RT, Wyman C, Wurm R, Wagner R, Goosen N 2002. Structural basis for H-NS-mediated trapping of RNA polymerase in the open initiation complex at the rrnB P1. J Biol Chem 277: 2146–2150 [DOI] [PubMed] [Google Scholar]
- Dame RT, Noom MC, Wuite GJ 2006. Bacterial chromatin organization by H-NS protein unravelled using dual DNA manipulation. Nature 444: 387–390 [DOI] [PubMed] [Google Scholar]
- Dillon SC, Dorman CJ 2010. Bacterial nucleoid-associated proteins, nucleoid structure and gene expression. Nat Rev Microbiol 8: 185–195 [DOI] [PubMed] [Google Scholar]
- Dornenburg JE, Devita AM, Palumbo MJ, Wade JT 2010. Widespread antisense transcription in Escherichia coli. MBio 1: e00024-10. [DOI] [PMC free article] [PubMed] [Google Scholar]
- Garcia-Vallve S, Guzman E, Montero MA, Romeu A 2003. HGT-DB: A database of putative horizontally transferred genes in prokaryotic complete genomes. Nucleic Acids Res 31: 187–189 [DOI] [PMC free article] [PubMed] [Google Scholar]
- Gordon BR, Li Y, Wang L, Sintsova A, van Bakel H, Tian S, Navarre WW, Xia B, Liu J 2010. Lsr2 is a nucleoid-associated protein that targets AT-rich sequences and virulence genes in Mycobacterium tuberculosis. Proc Natl Acad Sci 107: 5154–5159 [DOI] [PMC free article] [PubMed] [Google Scholar]
- Gowrishankar J, Harinarayanan R 2004. Why is transcription coupled to translation in bacteria? Mol Microbiol 54: 598–603 [DOI] [PubMed] [Google Scholar]
- Grainger DC, Hurd D, Goldberg MD, Busby SJ 2006. Association of nucleoid proteins with coding and non-coding segments of the Escherichia coli genome. Nucleic Acids Res 34: 4642–4652 [DOI] [PMC free article] [PubMed] [Google Scholar]
- Grainger DC, Goldberg MD, Lee DJ, Busby SJ 2008. Selective repression by Fis and H-NS at the Escherichia coli dps promoter. Mol Microbiol 68: 1366–1377 [DOI] [PubMed] [Google Scholar]
- Iyoda S, Honda N, Saitoh T, Shimuta K, Terajima J, Watanabe H, Ohnishi M 2011. Coordinate control of the locus of enterocyte effacement and enterohemolysin genes by multiple common virulence regulators in enterohemorrhagic Escherichia coli. Infect Immun. 79: 4628-4637 [DOI] [PMC free article] [PubMed] [Google Scholar]
- Kahramanoglou C, Seshasayee AS, Prieto AI, Ibberson D, Schmidt S, Zimmermann J, Benes V, Fraser GM, Luscombe NM 2011. Direct and indirect effects of H-NS and Fis on global gene expression control in Escherichia coli. Nucleic Acids Res 396: 2073–2091 [DOI] [PMC free article] [PubMed] [Google Scholar]
- Keseler IM, Mackie A, Peralta-Gil M, Santos-Zavaleta A, Gama-Castro S, Bonavides-Martínez C, Fulcher C, Huerta AM, Kothari A, Krummenacker M, et al. 2013. EcoCyc: Fusing model organism databases with systems biology. Nucleic Acids Res 41: D605–D612. [DOI] [PMC free article] [PubMed] [Google Scholar]
- Li H, Granat A, Stewart V, Gillespie JR 2008. RpoS, H-NS, and DsrA influence EHEC hemolysin operon (ehxCABD) transcription in Escherichia coli O157:H7 strain EDL933. FEMS Microbiol Lett 285: 257–262 [DOI] [PubMed] [Google Scholar]
- Lim CJ, Lee SY, Kenney LJ, Yan J 2012. Nucleoprotein filament formation is the structural basis for bacterial protein H-NS gene silencing. Sci Rep 2: 509. [DOI] [PMC free article] [PubMed] [Google Scholar]
- Liu Y, Chen H, Kenney LJ, Yan J 2010. A divalent switch drives H-NS/DNA-binding conformations between stiffening and bridging modes. Genes Dev 244: 339–344 [DOI] [PMC free article] [PubMed] [Google Scholar]
- Lodge J, Fear J, Busby S, Gunasekaran P, Kamini NR 1992. Broad host range plasmids carrying the Escherichia coli lactose and galactose operons. FEMS Microbiol Lett 74: 271–276 [DOI] [PubMed] [Google Scholar]
- Lucchini S, Rowley G, Goldberg MD, Hurd D, Harrison M, Hinton JC 2006. H-NS mediates the silencing of laterally acquired genes in bacteria. PLoS Pathog 28: e81. [DOI] [PMC free article] [PubMed] [Google Scholar]
- Miller J. 1972. Experiments in molecular genetics. Cold Spring Harbor Laboratory, Cold Spring Harbor, NY. [Google Scholar]
- Navarre WW, Porwollik S, Wang Y, McClelland M, Rosen H, Libby SJ, Fang FC 2006. Selective silencing of foreign DNA with low GC content by the H-NS protein in Salmonella. Science 313: 236–238 [DOI] [PubMed] [Google Scholar]
- Oshima T, Ishikawa S, Kurokawa K, Aiba H, Ogasawara N 2006. Escherichia coli histone-like protein H-NS preferentially binds to horizontally acquired DNA in association with RNA polymerase. DNA Res 13: 141–153 [DOI] [PubMed] [Google Scholar]
- Page L, Griffiths L, Cole JA 1990. Different physiological roles of two independent pathways for nitrite reduction to ammonia by enteric bacteria. Arch Microbiol 154: 349–354 [DOI] [PubMed] [Google Scholar]
- Peters JM, Mooney RA, Grass JA, Jessen ED, Tran F, Landick R 2012. Rho and NusG suppress pervasive antisense transcription in Escherichia coli. Genes Dev 26: 2621–2633 [DOI] [PMC free article] [PubMed] [Google Scholar]
- Potvin E, Sanschagrin F, Levesque RC 2008. σ Factors in Pseudomonas aeruginosa. FEMS Microbiol Rev 32: 38–55 [DOI] [PubMed] [Google Scholar]
- Raghavan R, Sloan DB, Ochman H 2012. Antisense transcription is pervasive but rarely conserved in enteric bacteria. MBio 3: e00156-12. [DOI] [PMC free article] [PubMed] [Google Scholar]
- Rogers MT, Zimmerman R, Scott ME 2009. Histone-like nucleoid-structuring protein represses transcription of the ehx operon carried by locus of enterocyte effacement-negative Shiga toxin-expressing Escherichia coli. Microb Pathog 47: 202–211 [DOI] [PubMed] [Google Scholar]
- Sachdeva P, Misra R, Tyagi AK, Singh Y 2010. The σ factors of Mycobacterium tuberculosis: Regulation of the regulators. FEBS J 277: 605–626 [DOI] [PubMed] [Google Scholar]
- Salgado H, Peralta-Gil M, Gama-Castro S, Santos-Zavaleta A, Muñiz-Rascado L, García-Sotelo JS, Weiss V, Solano-Lira H, Martínez-Flores I, Medina-Rivera A, et al. 2013. RegulonDB v8.0: Omics data sets, evolutionary conservation, regulatory phrases, cross-validated gold standards and more. Nucleic Acids Res 41: D203–D213 [DOI] [PMC free article] [PubMed] [Google Scholar]
- Singh SS, Grainger DC 2013. H-NS can facilitate specific DNA-binding by RNA polymerase in AT-rich gene regulatory regions. PLoS Genet 96: e1003589. [DOI] [PMC free article] [PubMed] [Google Scholar]
- Singh N, Wade JT 2014. Identification of regulatory RNA in bacterial genomes by genome-scale mapping of transcription start sites. Methods Mol Biol 1103: 1–10 [DOI] [PubMed] [Google Scholar]
- Singh SS, Typas A, Hengge R, Grainger DC 2011. Escherichia coli σ70 senses sequence and conformation of the promoter spacer region. Nucleic Acids Res 39: 5109–5118 [DOI] [PMC free article] [PubMed] [Google Scholar]
- Tutukina MN, Shavkunov KS, Masulis IS, Ozoline ON 2007. Intragenic promotor-like sites in the genome of Escherichia coli discovery and functional implication. J Bioinform Comput Biol 5: 549–560 [DOI] [PubMed] [Google Scholar]