

Abstract
Microrchidia (MORC) family CW-type zinc finger 2 (MORC2) has been shown to be involved in several nuclear processes, including transcription modulation and DNA damage repair. However, its cytosolic function remains largely unknown. Here, we report an interaction between MORC2 and ATP-citrate lyase (ACLY), an enzyme that catalyzes the formation of acetyl-coA and plays a central role in lipogenesis, cholesterogenesis, and histone acetylation. Furthermore, we demonstrate that MORC2 promotes ACLY activation in the cytosol of lipogenic breast cancer cells and plays an essential role in lipogenesis, adipogenesis and differentiation of 3T3-L1 preadipocytic cells. Consistently, the expression of MORC2 is induced during the process of 3T3-L1 adipogenic differentiation and mouse mammary gland development at a stage of increased lipogenesis. This observation was accompanied by a high ACLY activity. Together, these results demonstrate a cytosolic function of MORC2 in lipogenesis, adipogenic differentiation, and lipid homeostasis by regulating the activity of ACLY.
Keywords: MORC2, ACLY, Protein-protein interaction, Lipogenesis, Adipogenesis
1. INTRODUCTION
Microrchidia (MORC) family CW-type zinc finger 2 (MORC2), also known as ZCWCC1, ZCW3, and KIAA0852, is one of the members of the MORC protein superfamily [1, 2]. The MORC proteins share conserved features, including a GHKL (gyrase, hsp90, histidine kinase, and MutL)-ATPase domain [3–5] at the amino-terminus, which functions in restriction-modification systems [2], a CW-type zinc finger (ZF-CW) domain, a nuclear localization signal (NLS), and coiled-coil domains at the carboxi-terminus [6]. According to their ZF-CW domain architectures, MORC proteins have been classified into two subfamilies; MORC1 and MORC2 are assigned to subfamily I, whereas MORC3 and MORC4 belong to subfamily IX [6]. Current evidence suggests that MORC1 is expressed specifically in male germ cells and regulates male gametogenesis [7]. In contrast, MORC3 is ubiquitously expressed in mammalian cells and induces cellular senescence through regulating p53 activity [8]. MORC4 is highly expressed in a subset of diffuse large B-cell lymphoma patients and in B-cell lymphoma cell lines, thus acting as a potential lymphoma biomarker [9]. Notably, MORC2 is the least characterized member of the family.
The evolutionary, contextual, and gene neighborhood studies on prokaryotic MORC proteins have predicted a role for eukaryotic MORCs in chromatin remodeling [2]. In support of this notion, recent studies pointed out that the members of the MORC protein family are conserved regulators of heterochromatin condensation and gene silencing [10]. Consistently, MORC2 has been shown to transcriptionally repress gene expression [11] and promote chromatin remodeling in response to DNA damage [12]. However, the biochemical and biological roles of MORC2 in mammalian cells remain largely unknown.
To uncover new functions of MORC2, we recently conducted an immunoprecipitation/mass spectrometry (IP/MS) analysis and identified the ATP citrate lyase (ACLY) as one of the MORC2 binding partners. ACLY is a 121-KDa enzyme that catalyzes the formation of acetyl-coenzyme A (CoA) and oxaloacetate from citrate and CoA, with the hydrolysis of ATP to ADP and phosphate [13]. Cytosolic acetyl-coA is the requisite building block for several important biosynthetic pathways, including lipogenesis and cholesterogenesis. Consequently, ACLY is a key player in the conversion of glucose (exported as citrate from the mitochondria) to fatty acids. Acetyl-CoA is also required for acetylation reactions that modify proteins, such as histone acetylation [14]. In addition, ACLY activity is required for growth factor-induced increases in nutrient metabolism to the regulation of nuclear histone acetylation and gene expression [15] and is essential for fetal growth and development [16].
Alterations of ACLY activity and/or expression have been observed in different pathological conditions. In this context, it has been documented that ACLY expression is upregulated in different types of cancers, such as lung, prostate, bladder, breast, liver, stomach and colon cancers [17–23]. Furthermore, ACLY-dependent production of acetyl-CoA for lipogenesis is important for the proliferation of glycolytically converted tumor cells [24, 25] and its inhibition suppresses proliferation of certain types of tumor cells [17, 24, 25]. In addition, there is increasing evidence of the importance of ACLY in many metabolic disorders, such as diabetes [26], pancreatic cell stress and apoptosis [27], obesity [28], hepatic steatosis [29], and hypocitraturia [30].
Given the critical role of ACLY in many critical biological processes, and its implication in myriad human diseases, we examined the biological consequences of the interaction between MORC2-ACLY identified by IP/MS assay. Interestingly, we found that MORC2 interacts with ACLY specifically in the cytosol of lipogenic breast cancer cells and regulates ACLY activity. Changes in MORC2 expression levels were associated with changes in the lipogenic capacity of the cells. Moreover, we demonstrate an essential role of MORC2 in adipocyte differentiation at the levels of lipogenesis and number of adipocytes. These results open an interesting new line of research about the control of ACLY activity as well as lipogenesis, and identify MORC2 as an important component in lipogenesis, adipocyte differentiation and metabolism.
2. MATERIALS AND METHODS
2.1. Cell culture and treatments
MCF-7, ZR-75-1 and 3T3-L1 cells were obtained from American Type Culture Collection (Manassas, VA). MCF-7 and ZR-75 cells were cultured in Dulbecco’s Modified Eagle’s Medium/F-12 (DMEM/F-12) (Atlanta Biologicals Inc, GA), supplemented with 10% fetal bovine serum, and 3T3-L1 cells were cultured in Dulbecco’s Modified Eagles’ Medium (DMEM) supplemented with 10% calf bovine serum. All media were additionally supplemented with 1× antibiotic-antimycotic solution (Life Technologies, Grand Island, NY). All cell cultures were maintained in a humidified 5% CO2 atmosphere at 37°C. For those experiments in which 3T3-L1 cells were treated with the adipogenic differentiation cocktail in the presence of actinomycin D or cycloheximide, cells were first pre-incubated with 10 μg/ml cycloheximide or 0.5 μg/ml actinomycin D. Subsequently, cells were washed with PBS and then placed into a medium containing insulin, 3-isobutyl-1-methylxanthine (IBMX), dexamethasone and either cycloheximide or actinomycin D at the same working concentration for 24 h. After incubation, the cells were collected and lysed for Western blot analysis.
2.2. Antibodies and reagents
Sources of antibodies were as follows: rabbit anti-MORC2 (for detection of human MORC2) and anti-T7 were purchased from Bethyl laboratories (Montgomery, TX); goat anti-MORC2 (for detection of mouse MORC2), rabbit anti-cyclin D1, anti-progesterone receptor (PR) and anti-HDAC2 antibodies were purchased from Santa Cruz Biotechnologies (Santa Cruz, CA); rabbit anti-phospho-ACLY, anti-ACLY, anti-phospho-ACC, anti-ACC, and anti-FAS were obtained from Cell Signaling Technology (Danvers, MA); rabbit anti-AP2 was obtained from Abcam (Cambridge, MA); and mouse anti-α-tubulin, anti-vinculin, anti-actin, and normal rabbit IgG were obtained from Sigma-Aldrich (St. Louis, MO). All primary antibodies were used as according to manufacturer’s instructions. Horseradish peroxidase-conjugated secondary antibodies were from GE Healthcare (Piscataway, NJ), and enhanced chemiluminescence (ECL) reagents were from Amersham Biosciences (Piscataway, NJ). Potassium citrate, ATP, CoA, malate dehydrogenase, nicotinamide adenine dinucleotide (NADH), MgCl2, Tris-HCl, DTT, actinomycin D, cycloheximide, insulin, and IBMX were from Sigma-Aldrich. Dexamethasone was purchased from G Biosciences (St. Louis, MO).
2.3. Expression vectors, recombinant proteins, siRNAs, and transfections
The expression vector encoding ACLY was generously provided by Kathryn E. Wellen (University of Pennsylvania, Philadelphia, PA) and has been previously described [15]. To generate various deletion ACLY expression vectors, the cDNA fragments corresponding to amino acid residues 1–300 (region 1), 300–630 (region 2), 630–850 (region 3), and 850–1092 (region 4) were amplified by PCR using the primers listed in Table 1. Each fragment was ligated into the EcoRI-XbaI sites of pEF6/V5-HIS vector (Invitrogen, Carlsbad, CA). In vitro translation was performed using the TNT® Quick Coupled Transcription/Translation Systems (Promega, Madison, WI). T7-MORC2, glutathione-S-transferase (GST)-MORC2 N-terminal (63–718 amino acid) and C-terminal (718–1032 amino acid) expression plasmids have been previously described [12]. All GST recombinant proteins were expressed in E. coli strain BL21 (DE3) (Stratagene, La Jolla, CA) and subsequently purified using the Glutathione Sepharose 4B batch method (GE Healthcare, Piscataway, NJ). Plasmid transfections were carried out using FuGENE HD Transfection Reagent (Roche Applied Science, Indianapolis, IN) according to manufacturer’s instructions. Specific siRNAs targeting mouse or human MORC2 or control siRNAs were obtained from Thermo Fisher Scientific (Rockville, MD). The transfection of siRNA was performed twice at 24-h intervals with Oligofectamine ™ reagent (Invitrogen) according to the manufacturer’s protocol.
Table 1.
List of primers used for amplification of the ACLY protein regions (R1-R4).
| Primer | Sequence | Regions |
|---|---|---|
| ACLY_F1 | 5′-CGC GAA TTC ATG TCA GCC AAG GCA ATT TCA-3′ | R1 |
| ACLY_R1 | 5′-CGC TCT AGA TCA TTC ATT GAC ACC TCC AAG-3′ | |
| ACLY_F2 | 5′-ACC GAA TTC ATG CTG GCG AAT TAC GGG GAA-3′ | R2 |
| ACLY_R2 | 5′-CGC TCT AGA TCA ACC AGT ATT CCC GAT CTT-3′ | |
| ACLY_F3 | 5′-ACC GAA TTC ATG GGA ATG CTG GAC AAC ATC-3′ | R3 |
| ACLY_R3 | 5′-CGC TCT AGA TCA GGT GAT GGG CAT GCC CGC-3′ | |
| ACLY_F4 | 5′-ACC GAA TTC ATG GAG GTC TTC AAG GAG GAG-3′ | R4 |
| ACLY_R4 | 5′-CGC TCT AGA TTA CAT GCT CAT GTG TTC TGG-3′ |
2.4. Quantitative real time PCR (qPCR)
Total RNA was isolated from cultured cells using TRIzol reagent (Invitrogen) according to the manufacturer’s protocol, and two micrograms of extracted RNA were converted to cDNA using the SuperScriptTM III First-Strand Synthesis System for RT-PCR (Invitrogen). The resultant cDNA was subjected to qPCR by using the iQTM SYBR® Green Supermix (Bio-Rad Laboratories, Hercules, CA) on an iCycler iQ™ Real-Time PCR Detection System (Bio-Rad Laboratories). The values for specific genes were normalized to human or mouse actin housekeeping controls. Mean values are displayed ± standard deviations. The primers used for qPCR are listed in Table 2. All qPCR primers were synthesized in Sigma-Aldrich.
Table 2.
qPCR primers used in this study.
| Primer | Sequence |
|---|---|
| q_hMORC2_F | 5′-CCC AAG CAG ACC TGA AGA AA-3′ |
| q_hMORC2_R | 5′-TTC CTG ATC ACA GCA GGT AAA G-3′ |
| q _hACTIN_F | 5′-TCC CTG GAG AAG AGC TAC GA-3′ |
| q_hACTIN_R | 5′-GTA CTT GCG CTC AGG AGG AG-3′ |
| q_hAP2_F | 5′-ACT GGG CCA GGA ATT TGA CGA AGT-3′ |
| q_hAP2_R | 5′-TCT CGT GGA AGT GAC GCC TTT CAT-3′ |
| q_mMORC2_F | 5′-AGG AGC CAT TTC CTG AGT CAA CCA-3′ |
| q_mMORC2_R | 5′-ACA CCT GCA CAC CCT GAG AAT CTT-3′ |
| q_mACTIN_F | 5′-TCC CTG GAG AAG AGC TAT GA-3′ |
| q_mACTIN_R | 5′-GTA CTT GCG CTC AGG AGG AG-3′ |
| q_mAP2_F | 5′-AGT CAC ATG GTC CAG GGC ATC TT-3′ |
| q_mAP2_R | 5′-AAC CTT CGA GGA GGA GCT GTC T-3′ |
| q_mPPARg_F | 5′-TGA AGC CCA TCG AGG ACA TC-3′ |
| q_mPPARg_R | 5′-TGA CGA TCT GCC TGA GGT CTG-3′ |
| q_mACLY_F | 5′-TGG AGG TGT CAA TGA ACT GGC GAA-3′ |
| q_mACLY_R | 5′-ATC TTG CCT TCT GGG TGC TTC TCT-3′ |
| q_m_FAS_F | 5′-TAT CCT GCT GTC CAA CCT CAG CAA-3′ |
| q_m_FAS_R | 5′-TCA CGA GGT CAT GCT TTA GCA CCT-3′ |
| q_m_ACC1_F | 5′-ATG TTC CAT GTG GCC TGG GTA GAT-3′ |
| q_m_ACC1_R | 5′-TCA CAG TGG ACA GAA TTG AGG GCA-3′ |
| q_mCEBPa_F | 5′-GCT GAG TTG ACC AGT GAC A-3′ |
| q_mCEBPa_R | 5′-AAA CCA TCC TCT GGG TCT CC-3′ |
| q_mCEBPb_F | 5′-TGA TGC AAT CCG GAT CAA ACG TGG-3′ |
| q_mCEBPb_R | 5′-TTT AAG TGA TTA CTC AGG GCC CGG C-3′ |
| q_hHMGCR-F | 5′-TGA AGG GTT CGC AGT GAT AAA-3′ |
| q_hMGCR-R | 5′-CCT GGA CTG GAA ACG GAT ATA AA-3′ |
2.5. Western blot and immunoprecipitation
Protein extracts were prepared by lysing the cells in radio-immunoprecipitation assay (RIPA) buffer containing 50 mM Tris-HCl, pH 7.4, 1% Nonidet P-40, 0.25% sodium deoxycholate, 150 mM NaCl, 1 mM EDTA, 1× protease inhibitor cocktail (Roche Applied Science), and 1× phosphatase inhibitor cocktail I and II (Sigma-Aldrich). Nuclear and cytoplasmic extracts were prepared as described previously [31]. Protein concentrations were determined using Bio-Rad DC Protein Assay reagents (Bio-Rad Laboratories). Cell extracts were then resolved by SDS-PAGE, transferred to nitrocellulose membranes, and incubated with the indicated antibodies. Detections were performed using the ECL reagents. For immunoprecipitation (IP) analysis, total 1 mg of protein materials was incubated with 1 μg of primary antibody overnight at 4°C on a rocket platform, followed by incubation with total 50 μl of protein A/G PLUS-agarose (Santa Cruz Biotechnology) or Trueblot IP beads (eBioscience, San Diego, CA) for 2 h at 4°C. The immunoprecipitates were collected by centrifugation in a microcentrifuge at 6, 000 rpm for 5 min. The supernatant was discarded, whereupon the pellet was washed with Nonidet P-40 (NP40) buffer (50 mM Tris-HCl, pH 8.0, 0.5 % Nonidet P-40, 10 % glycerol, 150 mM NaCl, 2 mM MgCl2, and 1 mM EDTA), with protease inhibitors for three to five times and then dissolved in a sample buffer for SDS-PAGE. The protein bands in the Western blot were quantified using ImageJ software.
2.6. GST pull-down assays
The GST pull-down assays were performed by incubating equal amounts of GST or GST fusion protein immobilized to glutathione-sepharose beads with in-vitro translated 35S-labeled protein in a 400 μl reaction volume. The mixtures were incubated for 2 h at 4°C and washed three to six times with NP40 lysis buffer. Bound proteins were eluted with 2× SDS buffer, separated by SDS-PAGE and visualized by autoradiography. The transferred protein on the blot was visualized using Ponceau S staining.
2.7. ACLY activity enzymatic assays
ACLY enzymatic activity was assayed by the coupled malate dehydrogenase (MDH) method [32], which monitors the decreased in NADH levels by the oxidation of oxaloacetate by MDH. Cytosolic lysates extracted from the different cell samples were subjected to the assay. The standard assay mixture consisted of 50 mM Tris-HCL (pH 8.0), 10 mM MgCl2, 1.9 mM DTT, 0.15 mM NADH, 0.07 mM CoA, 1 mM ATP, 2 mM potassium citrate, and 3.3 units/ml malate dehydrogenase. Assays were conducted at 37°C in a temperature-controlled Synergy H1 Hybrid Microplate Reader (Biotek, Winooski, VT). Change in absorbance in the presence of exogenous ATP was subtracted from change in the absence of ATP and was normalized to protein concentration to determine the specific ACLY activity.
2.8. Adipocyte differentiation and Oil Red O staining
3T3-L1 cells were cultured to confluence in DMEM supplemented with 10% calf bovine serum. At 2 days post-confluence (designated day 0), cells were induced to differentiate with DMEM supplemented with 10% fetal bovine serum, 1 μM dexamethasone (G-Biosciences), 0.5mM isobutylmethylxanthine IBMX (Sigma-Aldrich), and 1 μg/ml insulin (Sigma-Aldrich). After 48 h, the media were replaced with DMEM supplemented with 10% FBS and 1μg/ml insulin. Cells were provided with fresh DMEM 10% FBS plus 1 μg/ml insulin every 48 h. For adipogenic assays of cells treated with siMORC2, cells were transfected with the siRNA two times, and then maintained until reaching confluence, according to the protocol described in 2.3. 3T3-L1 adipocytes were fixed with 3.7% formaldehyde and washed with PBS. Cells were stained with Oil Red O working solution (six parts of saturated Oil Red O-isopropanol solution (Sigma-Aldrich) and four parts of water) for 15 min at room temperature and then exhaustively rinsed with water. Stained or non-stained adipocytes were visualized with an Olympus IX71 microscope. Representative images were acquired with an Olympus DP72 camera using DP2-BSW software. These assays were repeated at least three times.
3. RESULTS
3.1. Identification of ACLY as a MORC2-interacting partner
Our recent immunoprecipitation/mass spectrometry (IP/MS) study identified ACLY as a potential MORC2-interacting protein in HeLa cells (Kumar R., unpublished data). In the light of the functional importance of ACLY in metabolism [13] and acetylation reactions and protein modifications [15], we attempted to further investigate the functional implications of the MORC2-ACLY interaction. To this aim, we next confirmed that endogenous MORC2 associates with the endogenous ACLY in HeLa cells using a sequential IP/Western blot analysis (Figure 1A). Furthermore, we found that in vitro-translated ACLY was able to directly interact with GST-MORC2, preferentially to the amino-terminal half of the GST-MORC2 protein (amino acids 63–718) (Figure 1B). These results demonstrate that ACLY interacts with MORC2 in vitro and in vivo.
Figure 1. MORC2 interacts with ACLY.
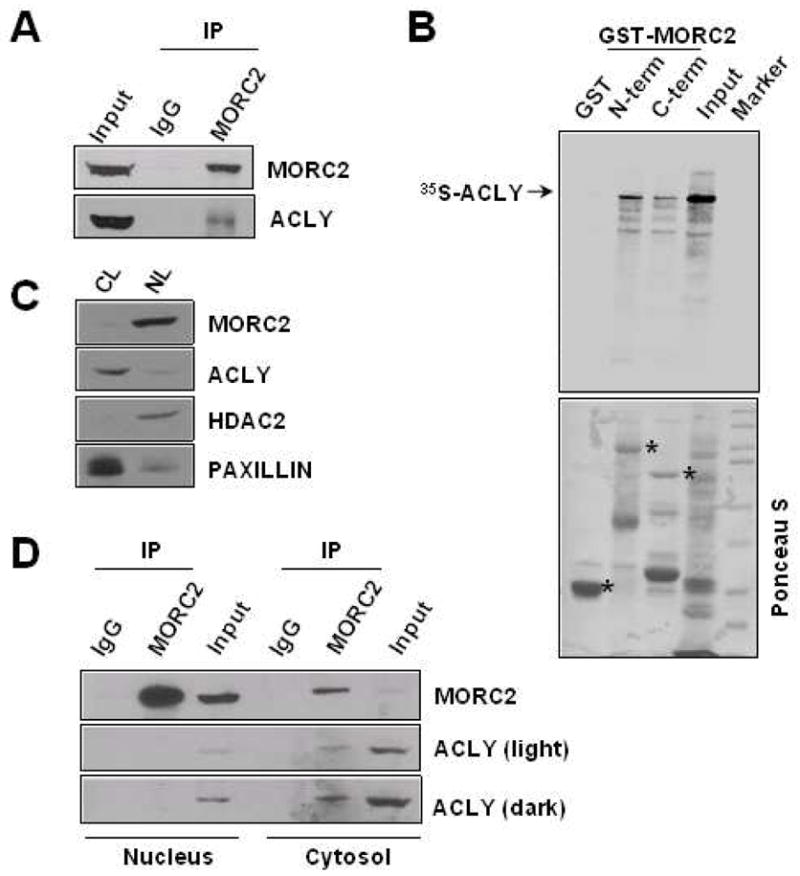
A. Protein extracts from HeLa cells were immunoprecipitated with an anti-MORC2 antibody, followed by Western blotting using the indicated antibodies. B. In vitro transcribed-translated ACLY protein (35S-labeled) was incubated with GST-MORC2 N-terminal or C-terminal truncation constructs. Bound proteins were separated and analyzed by SDS-PAGE and autoradiography. The lower panel shows a Ponceau S-stained blot containing either GST-MORC2 N-terminal or GST-MORC2 C-terminal and GST. The asterisk (*) denotes the presence of the GST, GST-MORC2 N-terminal and GST-MORC2 C-terminal fusion proteins. C. Nuclear (NL) and cytosolic (CL) protein lysates from MCF-7 cells were subjected to Western blot analysis of MORC2 and ACLY. HDAC2 and paxillin protein expression was used as nuclear and cytosolic markers, respectively. D. The same lysates assayed in C were immunoprecipitated using an anti-MORC2 antibody, followed by Western blot analysis using the indicated antibodies. IP: immunoprecipitation.
3.2. ACLY and MORC2 specifically interact in the cytosol of lipogenic breast cancer cells
Because of the low capacity of de novo lipogenesis of HeLa cells [33] and the prominent function of ACLY in lipogenesis [13], we decided to employ MCF-7 cells, an epithelial breast cancer cell line with high lipogenic ability [34], for further functional studies. Emerging evidence suggests that MORC2 is predominantly localized in the nuclear compartment [12] (Figure 1C) and ACLY is mainly a cytosolic enzyme [13] (Figure 1C). We localized the interaction between MORC2 and ACLY by IP of the endogenous MORC2 from both nuclear and cytosolic MCF-7 cell lysates, followed by Western blot analysis for ACLY protein expression. As shown in Figure 1D, ACLY co-immunoprecipitated with the MORC2 out of the MCF-7 cytosolic fraction, but not out of the nuclear fraction. These results suggest that, at least under our experimental conditions, the interaction between MORC2 and ACLY occurs specifically in the cytosol of MCF-7 cells.
3.3. MORC2 specifically binds to a region of ACLY important for its activation
To understand the consequences of the interaction between MORC2 and ACLY, we next mapped the interacting region between both proteins. The ACLY protein contains four structural domains [35], named here as domains I-IV relative to the amino-terminus (Figure 2A). Domain I adopts an ATP-grasp fold [36] and binds nucleotides [37]. Domain II binds CoA, and domains III and IV share similarity to ligase coA and citrate synthase, respectively [35]. Thus, the ACLY full length protein was subdivided into four regions (R1 to R4), each one containing one of the domains described above, for cloning and subsequent in vitro translation. GST pull-down assays were carried out using each one of these in vitro translated peptides and GST-MORC2 proteins (N-terminal and C-terminal halves). As shown in Figure 2B, only the region 2 of ACLY (R2) was able to interact with GST-MORC2. Interestingly, we noticed that, similar to full-length ACLY protein (Figure 1B), this region of ACLY interacted mainly with the amino-terminal half of GST-MORC2. It is worth mentioning that region 2 of ACLY protein (300–630 aa) contains the domain II that binds CoA. Furthermore, region 2 contains several residues that can be phosphorylated and are important for ACLY activation [38–40]. These results show that MORC2 and ACLY interact directly, and this interaction requires the Co-A-binding domain II of ACLY.
Figure 2. MORC2 interacts with a region of ACLY important for its activation.

A. Schematic representation of the ACLY protein, showing the domains of the protein (I-IV) and the different regions (R1-R4), in which the full length protein was subdivided for in vitro translation. I: ATP-grasp fold domain. II: Coenzyme A (CoA)-binding domain. III: ligase coA-like domain. IV: citrate synthase-like domain. B. In vitro transcribed-translated (35S-labeled) ACLY protein regions (R1-R4) or full-length ACLY (FL) were incubated with GST-MORC2 N-terminal or GST-MORC2-C-terminal half constructs, or GST. Bound proteins were separated and analyzed by SDS-PAGE and autoradiography. The lower panels are the Ponceau S-stained blots showing either GST-MORC2 N-terminal or GST-MORC2 C-terminal and GST. The asterisk (*) denotes the presence of the GST, GST-MORC2 N-terminal and GST-MORC2 C-terminal fusion proteins.
3.4. MORC2 expression levels affect ACLY activity
Thr446, Ser450 and Ser454 residues of mouse ACLY were shown to be phosphorylated in vitro [41] and indirectly reflect the activation status of ACLY [42]. This finding, taken together with the results presented above, suggest that MORC2 may affect ACLY activity by selectively binding to a region of ACLY containing several phosphorylatable residues. To test this hypothesis, we examined the effect of MORC2 expression on the levels of ACLY phosphorylation at Ser455 (human homologue residue to mouse Ser454) in two lipogenic breast cancer cell lines: MCF-7 and ZR-75-1. Interestingly, we found that induced expression of MORC2 resulted in a significant increase in the phosphorylation level of ACLY in MCF-7 (Figure 3A) and ZR-75-1 (Figure S1A). In agreement with previous data [17], the increase in ACLY phosphorylation contributed to its protein stabilization, and higher levels of total ACLY were also observed when MORC2 was overexpressed (Figure 3A). In contrast, depletion of the endogenous MORC2 by a specific siRNA in MCF-7 cells resulted in a significant reduction of ACLY phosphorylation (Figure 3B).
Figure 3. Changes in MORC2 expression levels affect ACLY activity.

A. MCF-7 cells were transiently transfected with T7-MORC2 or the empty vector (V), and the expression of T7-MORC2, MORC2, p-ACLY (Ser455), and ACLY was analyzed by Western blot 48 h after transfection. The expression of α-tubulin was used as a loading control. B. MCF-7 cells were transiently transfected with a siRNA designed against MORC2, or a siRNA control. 48 h after transfection, protein lysates were subjected to Western blot analysis using the indicated antibodies. Tubulin was used as a loading control. Figure shows a representative western blot. The graphs below panels A and B correspond to the densitometric analysis and quantification of the signals detected in the corresponding Western blots. Bars represent the ratios of the signals for the proteins of interest to tubulin, and expressed as % of control cells (v or siC, respectively). C and D. Cytosolic lysates from MCF-7 cells transiently transfected with T7-MORC2 or the empty vector (V) (C), and with siMORC2 or siC (D), were assayed for ACLY enzymatic activity, using the malate-dehydrogenase coupled method. AU: absorbance units. * P<0.005, calculated by t-test.
To further confirm these results, we conducted kinetic assays to determine the activation level of cytosolic ACLY under the conditions of overexpression or knockdown of MORC2. For this purpose, the enzymatic activity of ACLY was assayed by the malate-dehydrogenase (MDH) method [43]. This assay monitors the decrease in NADH levels at 340 nm by the MDH oxidation of oxaloacetate (resulting from ACLY activity) [43]. As shown in Figure 3C, following MORC2 overexpression, the activity of ACLY was clearly induced in both MCF-7 (Figure 3C) and ZR-75-1 (Figure S1B) cytosolic lysates. In addition, ACLY activity was dramatically reduced in the cytosol of MCF-7 cells after the specific knockdown of MORC2 by siRNA transfection (Figure 3C). Altogether, these results suggest that MORC2 regulates ACLY activity.
3.5. MORC2 is essential for fatty acid and mevalonate pathways
ACLY is the major source of cytosolic acetyl-CoA for lipogenesis in mammalian cells [13]. Lipogenesis comprises multiple sequential steps governed by several enzymes, including ACLY, acetyl-CoA carboxylase (ACC) and fatty acid synthase (FAS) [31]. ACLY catalyzes the first step, consisting in the conversion of cytosolic citrate into acetyl-CoA and oxaloacetate, and supplying the essential metabolites for the pathway. Next, ACC catalyzes the carboxylation of acetyl-CoA to produce malonyl-CoA, and FAS subsequently condenses acetyl-CoA and malonyl-CoA to generate long chain fatty acids.
Given our findings that MORC2 regulates ACLY activity (Figures 3 and S1), we hypothesized that MORC2 can affect the levels of available acetyl-CoA by controlling ACLY activity and consequently, may be implicated in the regulation of the lipogenic pathway. Indeed, we found that MORC2 depletion in MCF-7 cells was followed by a marked downregulation in the protein expression levels of ACC and FAS (Figure 4A), suggesting that MORC2 is essential for the lipogenic process. In contrast, induced expression of MORC2 increased the phosphorylation and protein levels of ACC, as well as FAS protein levels in both MCF-7 (Figure 4C) and ZR-75-1 cells (Figure S2 A). Furthermore, the level of aP2 protein, a marker of adipocytes [44], was induced in cells overexpressing MORC2 (Figure 4C), but was downregulated following depletion of the endogenous MORC2 by a specific siRNA in MCF-7 cells (Figure 4B). Collectively, these results suggest that MORC2 is required for the optimum lipogenic activity of these enzymes and is involved in intracellular lipid accumulation.
Figure 4. Changes in MORC2 expression levels affect the lipogenic pathway.

A. MCF-7 cells were transiently transfected with a siRNA designed against MORC2, or a siRNA control. After 48 h of transfection, protein lysates were subjected to Western blot analysis using the indicated antibodies. Tubulin was used as a loading control. A representative Western blot is shown. The graph to the right displays the densitometric analysis and quantification of the signals detected by Western blot. Bars represent the ratios of the signals for the proteins of interest to tubulin, and expressed as % of control cells (siC). B. Total mRNA isolated from MCF-7 cells transiently transfected with siMORC2 or siC was analyzed for the expression of Morc2 and aP2 mRNA by qPCR. The relative mRNA expression levels are represented; actin expression was used to normalize the values. Each value represents the mean ± S.E. of three independent experiments. * P<0.005, calculated by t-test. C. MCF-7 cells were transiently transfected with T7-MORC2 or the empty vector (V), and the expression of T7-MORC2, MORC2, p-ACC, ACC, FAS and AP2 was analyzed by Western blot 48 h after transfection. The expression of α-tubulin was used as a loading control. The graph on the right displays the densitometric analysis and quantification of the signals detected by Western blot. Bars represent the ratios of the signals for the proteins of interest to tubulin, and expressed as % of control cells (V). D. Total mRNAs from the same experiment described in panel B were analyzed for the expression of HMGCR mRNA by qPCR. The relative mRNA expression levels are represented; actin expression was used to normalize the values. Each value represents the mean ± S.E. of three independent experiments. * P<0.005, calculated by t-test.
Because the Acetyl CoA resulting from ACLY activity is also an essential substrate for the mevalonate pathway [45], we studied the effect of MORC2 on this pathway. The first and rate-limiting step in the mevalonate pathway is regulated by the enzyme 3-hydroxy-3-methylglutaryl-CoA reductase (HMGCR) [46], which converts the Acetyl coA into mevalonate, which can be later transformed into cholesterol or isoprenoids. As shown in Figure 4D and S2B, we observed that MORC2 expression is essential for the mevalonate pathway, and the depletion of the endogenous MORC2 by a specific siRNA in both MCF-7 (Figure 4D) and ZR-75-1 (Figure S2 B) breast cancer cells was associated with a decrease expression of HMGCR mRNA. Altogether, these data suggest that MORC2, by affecting ACLY activity, regulates the levels of available Acetyl CoA which can be used either for the fatty acid synthesis or the mevalonate pathways.
3.6. MORC2 is induced and essentially required for 3T3-L1 adipogenesis
Lipogenesis is required for the execution of de novo adipogenesis, which includes both lipogenic and adipogenic gene expression. Adipogenesis, also called adipocyte differentiation, is a complex process accompanied by coordinated changes in morphology, hormone sensitivity, and gene expression that take place during the conversion of preadipocytes into fully matured adipocytes, which possess the full complement of enzymes and regulatory proteins required to execute both de novo lipogenesis and lipolysis [47]. Following these observations, we next examined whether MORC2 regulates adipocyte differentiation using 3T3-L1 mouse preadipocytic cells as an experimental model. Under a standard protocol of adipogenic differentiation [32], these cells are able to transform from fibroblast-like preadipocyte cells into fully mature adipocytes. We first analyzed MORC2 mRNA and protein expression levels during 3T3-L1 adipocyte differentiation, and found that the levels of MORC2 mRNA (Figure 5A) as well as protein (Figure 5B) were significantly increased in differentiated 3T3-L1 cells as compared with non-differentiated cells, suggesting that MORC2 may play a role in 3T3-L1 adipogenesis. To confirm these findings, we next selectively knocked down the endogenous MORC2 in 3T3-L1 cells using a specific MORC2 siRNA, and then induced these cells to differentiate. At day 0 of differentiation, just when the adipogenic cocktail was added to the cells, we confirmed the downregulation of MORC2 expression in MORC2 siRNA-3T3-L1 transfected cells (3T3-L1 siMORC2) compared with control siRNA-transfected cells (3T3-L1 siC) (Figure 5D). We found that 3T3-L1 siMORC2 cells also showed decreased expression levels of several adipocyte specific genes (aP2, PPARγ, C/EBPα, C/EBPβ) and various lipogenic genes (such as ACLY, ACC and FAS) (Figure 5D). Furthermore, 6 days after the induction of the adipogenic differentiation, the adipogenic conversion of 3T3-L1 siMORC2 cells was clearly compromised when compared to that of 3T3-L1 siC cells (Figures 5E and F). As shown in Figure 5E, the expression levels of different adipocyte specific genes, such as aP2, PPARγ, C/EBPα, and C/EBPβ (Figure 5E); as well as that for lipogenic genes ACLY, ACC and FAS (Figure 5F) was highly inhibited in differentiated 3T3-L1 siMORC2 cells, compared with differentiated control cells (3T3-L1 siC). In addition, the number of adipocytes stained with Oil Red O was also significantly reduced in the absence of MORC2 (Figure 5G). Taken together, these results suggest that MORC2 is required for the full completion of the adipogenic process at the level of lipogenesis, number of adipocytes and adipocyte specific gene expression
Figure 5. MORC2 is implicated in 3T3-L1 adipocyte differentiation.

A and B. qPCR (A) and Western blot (B) analysis of MORC2 expression during 3T3-L1 differentiation. 3T3-L1 cells were induced (D) or not (ND) to differentiate under a standard protocol of adipogenic differentiation. 4 and 8 days after the addition of the adipogenic cocktail, total mRNA was isolated for qPCR analysis of Morc2 expression (A), or protein lysates were prepared and subjected to Western blot analysis of MORC2 protein expression (B). Actin expression was used to normalize the values in qPCR. Each value represents the mean ± S.E. of three independent experiments. Tubulin expression was used as a loading control in B. C. Oil Red O (ORO) staining of the adipocytes from the same experiment shown in A and B. D. 3T3-L1 cells were transiently transfected with a siRNA designed against MORC2 (siMORC2) or a siRNA control (siC). Forty-eight hours after reaching confluence (day 0), cells were induced (D) or not induced (ND) to differentiate by the addition of an adipogenic cocktail, and total mRNA was isolated for qPCR analysis of Morc2, as well as different adipocyte-specific genes (aP2, PPARγ, C/EBPα, C/EBPβ), or lipogenic genes (ACLY, ACC, FAS). Actin expression was used to normalize the values in qPCR. Each value represents the mean ± S.E. for three independent experiments. * P<0.005; ** P < 0.001, calculated by t-test. E and F. Total mRNA from the same experiment described in D was isolated 6 days after the addition of the adipogenic cocktail, and qPCR was performed for the analysis of several adipocyte-specific (E) (aP2, PPARγ, C/EBPα, C/EBPβ), or lipogenic (F) (ACLY, ACC, FAS) genes. Actin expression was used to normalize the values for qPCR analysis. Each value represents the mean ± S.E. of three independent experiments. * P<0.005; ** P < 0.001, calculated by t-test comparing siC cells differentiated vs. non-differentiated; # P<0.005 calculated by t-test comparing siMORC2 differentiated cells vs. siC differentiated cells. G. Oil Red O (ORO) staining of the adipocytes from the same experiment shown in E and F.
3.7. Differentiation signals induce MORC2 expression
MORC2 appears to regulate adipocyte differentiation (Figure 5) and lipogenesis (Figures 4 and 5) in the cytosol of the cells. However, since MORC2 is mainly localized in the nuclei [12], we next examined whether the adipogenic signal can induce MORC2 cytosolic expression or relocalization. As shown in Figure 6A, we found that the treatment of 3T3-L1 cells for 24 h with the adipogenic cocktail containing insulin, IBMX and dexamethasone was able to induce an increase in MORC2 protein levels in total cell lysates, confirming an overall increase in MORC2 protein after 3T3-L1 differentiation (Figures 5A and 5B). In the fractionated cells, we detected an induction of MORC2 protein levels in cytosolic fraction of 3T3-L1 cells, but expression in nuclear fraction did not change (Figure 6A), suggesting that the signals of adipogenic differentiation promotes an induction of MORC2 cytosolic protein levels, rather than a relocalization from the nucleus to cytosol. To further validate the hypothesis that adipogenic stimulation induces cytosolic expression of MORC2, we next analyzed the localization and protein expression of MORC2 in 3T3-L1 cells after 24 h of treatment with the adipogenic cocktail in the presence of actinomycin D or cycloheximide. As expected, the addition of actinomycin D or cycloheximide to the differentiation cocktail suppressed the induction of MORC2 protein in total lysates and consequently in cytosolic lysates (Figure 6B).
Figure 6. MORC2 expression is induced by differentiation signals.
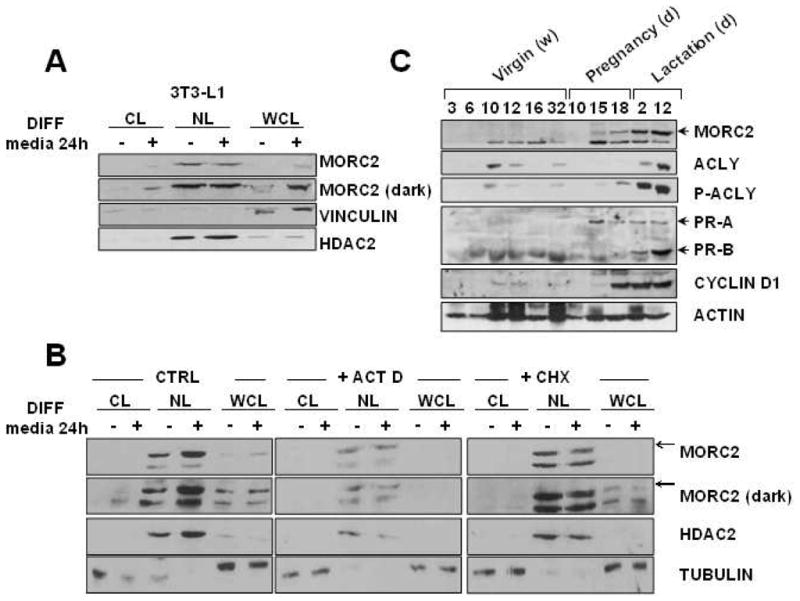
A. Cytosolic (CL), nuclear (NL) and whole cell (WCL) lysates from 3T3-L1 cells 24 h after the addition of the adipogenic cocktail were subjected to Western blot analysis of MORC2 expression. Vinculin expression was used as a loading control and cytosolic marker. HDAC2 expression was used as a loading control and nuclear marker. B. Cytosolic (CL), nuclear (NL) and whole cell (WCL) lysates from 3T3-L1 cells 24 h after the addition of the adipogenic cocktail, and in the presence of actinomycin D or cycloheximide, were subjected to Western blot analysis of MORC2 expression. Tubulin expression was used as a loading control and cytosolic marker. HDAC2 expression was used as a loading control and nuclear marker. C. Western blot analysis of MORC2, P-ACLY (Ser 454), ACLY, progesterone (PR) receptor, and cyclin D1 expression in the mammary gland of virgin, pregnant, and lactating mice. Actin was used as a loading control. w: weeks; d: days.
The mammary gland is an excellent system in which to study differentiation. The lactating mammary gland of many species synthesizes medium-chain fatty acids esterified as milk triglycerides. At late stages of pregnancy (days 15 to 18) mammary gland undergoes intense differentiation [48]. During this period there is increased lipogenesis and the ability to synthesize the medium-chain fatty acids, characteristics of the milk [48]. We analyzed the levels of MORC2 protein in mammary gland from virgin, pregnant and lactating mice, and found an increase in MORC2 protein expression along with differentiation (Figure 6C). Interestingly, the induction of MORC2 was highly correlated to the induction of ACLY activity during pregnancy (day 18) (Figure 6C), demonstrating the role of MORC2 in differentiation and lipogenesis.
4. DISCUSSION
Here, we provide the first evidence that MORC2, a previously recognized nuclear protein, functions in the cytosol through an interaction with ACLY. This interaction is required for lipogenesis and adipogenesis, which uncovers a new cytosolic role for MORC2 in addition to its nuclear functions in gene expression and chromatin remodeling in response to DNA damage signaling [11, 12].
The original implication of MORC2 in lipogenesis was derived from the biology of ACLY and the cytosolic localization of the MORC2-ACLY interaction. Although ACLY is mainly a cytosolic protein, emerging evidence pointed out the localization of ACLY in the nucleus of different mammalian cells, such as human glioblastoma cells, mouse embryonic fibroblasts, murine pro-B-cell lymphoid cells and human colon carcinoma cells [15]. Both nuclear and cytosolic ACLY are implicated in the formation of acetyl-CoA, but this metabolite is employed for different purposes depending on the localization of ACLY. Cytosolic acetyl-CoA is mainly used for lipogenic and/or cholesterogenic pathways [13], while nuclear acetyl-CoA is used for histone acetylation and changes in gene expression associated to metabolism [15]. Interestingly, we found that the interaction of MORC2 with ACLY was naturally and specifically occurring in the cytosol of MCF-7 cells, suggesting that MORC2 may play an important role in fatty acid metabolism in the cytosol of cells.
Indeed, this emerging role of MORC2 in fatty acid metabolism was firmly supported by several lines of evidence. First, we found that MORC2 regulates ACLY phosphorylation and activation. The in vitro interaction between these two proteins was mapped in a region of ACLY from amino acids 300 to 630, which contains a stretch of residues that are good candidates for phosphorylation and are important for ACLY activation [38–40]. Three regulatory phosphorylation sites in mouse ACLY have been identified [39] that are distinct from the catalytic auto phosphorylation site (His 760), including Thr 446 and Ser 450, which are phosphorylated by glycogen synthase kinase-3 (GSK-3) [39, 49], and Ser 454, which is phosphorylated by cAMP-dependent protein kinase (PKA) [38, 50], or by an “insulin-stimulated kinase(s)” [51]. In this study, Western blot analysis and enzymatic activity assays confirmed that MORC2 regulates the phosphorylation levels of ACLY on Ser 454 residue and its activation status [42]. Since the interaction between MORC2 and ACLY occurs in a region of ACLY that is susceptible of phosphorylation, we speculate that MORC2, which lacks any kinase activity, may play a protective role against the dephoshorylation of ACLY protein, which consequently would lead to the observed positive net effect of MORC2 in ACLY phosphorylation and activation. Future studies are needed to explore these and other possibilities including the nature and/or effect of the possible responsible kinase.
Second, our results show that MORC2 regulates the levels of ACC and FAS enzymes. ACLY-mediated cytosolic production of acetyl-coA is required for the subsequent steps of fatty acid biosynthesis, which includes two additional to convert the cytosolic acetyl-coA first into malonyl-coA and later in fatty acids. These two steps are governed by ACC and FAS enzymes. Thus, our results suggest that MORC2 may play an important role in the entire lipogenic pathway. Because ACLY is located upstream of the other lipogenic enzymes (ACC and FAS), the results presented here suggest that targeting the ACLY-MORC2 interaction may provide a potential advantage over therapeutic strategies targeting other lipogenic enzymes. It is known that small changes in the rates of enzymes at the beginning of a biochemical pathway composed of many enzymes may produce significant changes in the rate of production of the end product [42], and we demonstrate an example of such a pathway here. Additional evidence supporting the role of MORC2 in the regulation of ACLY-mediated cytosolic production of acetyl-coA is derived based on the preliminary analysis of HMGCR, the first and rate-limiting enzyme of the mevalonate pathway [46]. Although further experiments need to be conducted, our results suggest that MORC2 may be implicated in this pathway.
Third, we demonstrate in our experimental system that MORC2 is involved in the accumulation of fatty acids. The results show a direct relationship between MORC2 expression and aP2 expression levels. aP2 is a common marker of adipocytes [44], and our results suggest that MORC2 is a positive regulator for its abundance within the cytosol.
Fourth, our findings show that MORC2 is involved in adipocyte differentiation. Like other inducers of adipogenesis, such as C/EBP proteins and PPARγ [52], we found that the expression of MORC2 was induced during 3T3-L1 adipocyte differentiation. Furthermore, we revealed that MORC2 was required for 3T3-L1 adipogenesis involving lipogenesis and the accumulation of Oil Red O-stained lipid droplets, as well as the expression of several adipocyte-specific markers, including aP2, PPARγ, C/EBPα and C/EBPβ. Although further experiments are needed, the data presented here suggest that MORC2 affects ACLY activity and thus controls the lipogenic pathway from an early step in adipocyte differentiation. However, there are additional plausible explanations. For example, there may be an additional role for MORC2 in the transcriptional control of adipogenesis genes. The fact that MORC2 has been highly involved in the regulation of gene transcription [11], and our own results showing that knockdown of MORC2 inhibited the expression of several transcriptional regulators of adipogenesis (PPARγ, C/EBPα, C/EBPβ) support this hypothesis. Therefore, our data do not exclude the possibility that MORC2 affects adipocyte differentiation two ways; first by the control of lipogenesis in the cytosol and second through adipocyte-specific gene expression. These two processes are often undistinguished in adipocyte differentiation. However, it is remarkable to note that, while lipogenesis actively occurs in several tissues, including fat and liver tissues, adipogenesis is restricted to fat cells. Furthermore, adipocyte-specific gene expression is required for fat cell-specific functions, such as the synthesis of adipocytokines. These facts are of high importance, because it is well known that adipocytes and particularly, adipocytokines play an essential role in regulating the whole-body energy metabolism [53]. In this regard, MORC2 is positioned as a key player in energy (lipid) homeostasis and metabolism, implying novel functions for a member of this protein family. In addition, the positive role of MORC2 in lipogenesis was further confirmed in mammary gland development, with its induced expression coincident with the increment of lipogenesis and ACLY activation in late pregnancy, around days 15–18.
Lipogenesis is activated during cell growth and proliferation [54, 55] and one of the most important metabolic hallmarks of cancer is increased de novo lipid synthesis, because of the high proliferation rate and the consequent demand for energy and macromolecules [56]. Furthermore, ACLY appears to be upregulated in lung, prostate, bladder, breast, liver, stomach, and colon tumors [17–23]. Concomitantly, ACLY inhibition may result in growth arrest in tumor cells, both in vitro and in vivo [17, 24]. In the present study, we have observed that MORC2 upregulates ACLY phosphorylation and activity in two different breast cancer cell lines, MCF-7 and ZR-75-1. In this regard, MORC2, or the complex including MORC2 and ACLY, may provide an interesting novel target not only for ACLY-mediated lipogenesis, but also for ACLY-mediated tumorigenesis.
In summary, we report a novel interaction between ACLY and MORC2 and present evidence about the role of MORC2 in the regulation of ACLY activities in lipogenesis and adipocyte differentiation. Our results show MORC2 localized in the cytosol as a key player in lipid metabolism and homeostasis. These novel results suggest that targeting the MORC2-ACLY interaction may represent a new avenue for controlling many important metabolic pathways and their associated human diseases.
Supplementary Material
Figure 7. Schematic representation of the findings presented in this study.
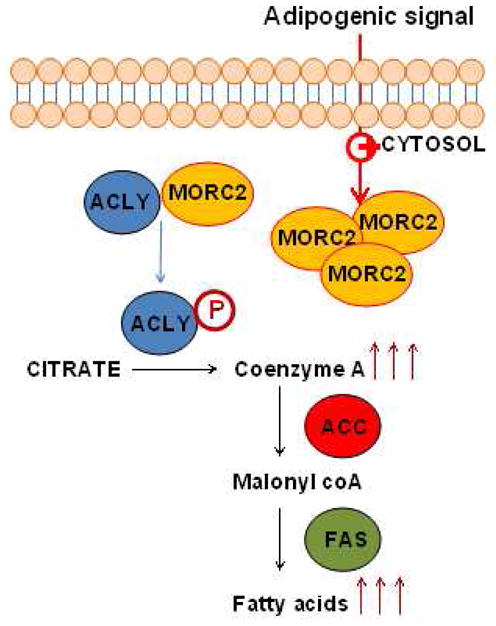
MORC2 and ACLY interact in the cytosol of MCF-7 cells. This interaction results in an induction of ACLY phosphorylation, and therefore, its activation. Because of the higher activity of ACLY, increased levels of Acetyl-CoA are accumulated, and thus available for the activation of the next steps of the fatty acid synthesis pathway, such as the activation of ACC and FAS. This event results ultimately in an increase in fatty acid levels. It has been observed that adipogenic signals (i.e. the adipogenic cocktail stimulator of adipocyte differentiation) increases the expression of MORC2 in the cytosol of the cells.
Highlights.
MORC2 was found to interact with ACLY in the cytosol.
MORC2 regulates ACLY activity and phosphorylation.
MORC2 is essentially involved in lipogenesis and adipogenesis.
We report the first cytosolic function of MORC2, in lipid homeostasis and metabolism.
Acknowledgments
We especially thank Narasimha Kumar Karanam for preparing samples for mass spectroscopy and for technical help in the early part of this project. We thank all the members of the Kumar laboratory for their helpful discussions. This study was supported in part by the National Institutes of Health grant CA139573 (to R.K.).
LIST OF ABBREVIATIONS
- MORC2
Microrchidia family CW-type zinc finger 2
- ZF
zinc finger
- IP
immunoprecipitation
- ACLY
ATP citrate lyase
- IBMX
3-isobutyl-1-methylxanthine
- GST
glutathione-S-transferase
- RIPA
radio-immunoprecipitation assay
- MDH
malate dehydrogenase
- ACC
acetyl-coA carboxylase
- FAS
fatty acid synthase
- HMGCR
3-hydroxyl-3-methylglutaryl- coA reductase
- GSK-3
glycogen synthase kinase-3
- PKA
cAMP-dependent protein kinase
Footnotes
Publisher's Disclaimer: This is a PDF file of an unedited manuscript that has been accepted for publication. As a service to our customers we are providing this early version of the manuscript. The manuscript will undergo copyediting, typesetting, and review of the resulting proof before it is published in its final citable form. Please note that during the production process errors may be discovered which could affect the content, and all legal disclaimers that apply to the journal pertain.
References
- 1.Inoue N, Hess KD, Moreadith RW, Richardson LL, Handel MA, Watson ML, Zinn AR. New gene family defined by MORC, a nuclear protein required for mouse spermatogenesis. Human molecular genetics. 1999;8:1201–1207. doi: 10.1093/hmg/8.7.1201. [DOI] [PubMed] [Google Scholar]
- 2.Iyer LM, Abhiman S, Aravind L. MutL homologs in restriction-modification systems and the origin of eukaryotic MORC ATPases. Biology direct. 2008;3:8. doi: 10.1186/1745-6150-3-8. [DOI] [PMC free article] [PubMed] [Google Scholar]
- 3.Dutta R, Inouye M. GHKL, an emergent ATPase/kinase superfamily. Trends in biochemical sciences. 2000;25:24–28. doi: 10.1016/s0968-0004(99)01503-0. [DOI] [PubMed] [Google Scholar]
- 4.Platani M, Goldberg I, Lamond AI, Swedlow JR. Cajal body dynamics and association with chromatin are ATP-dependent. Nature cell biology. 2002;4:502–508. doi: 10.1038/ncb809. [DOI] [PubMed] [Google Scholar]
- 5.Hu X, Machius M, Yang W. Monovalent cation dependence and preference of GHKL ATPases and kinases. FEBS letters. 2003;544:268–273. doi: 10.1016/s0014-5793(03)00519-2. [DOI] [PubMed] [Google Scholar]
- 6.Perry J, Zhao Y. The CW domain, a structural module shared amongst vertebrates, vertebrate-infecting parasites and higher plants. Trends in biochemical sciences. 2003;28:576–580. doi: 10.1016/j.tibs.2003.09.007. [DOI] [PubMed] [Google Scholar]
- 7.Watson ML, Zinn AR, Inoue N, Hess KD, Cobb J, Handel MA, Halaban R, Duchene CC, Albright GM, Moreadith RW. Identification of morc (microrchidia), a mutation that results in arrest of spermatogenesis at an early meiotic stage in the mouse. Proceedings of the National Academy of Sciences of the United States of America. 1998;95:14361–14366. doi: 10.1073/pnas.95.24.14361. [DOI] [PMC free article] [PubMed] [Google Scholar]
- 8.Takahashi K, Yoshida N, Murakami N, Kawata K, Ishizaki H, Tanaka-Okamoto M, Miyoshi J, Zinn AR, Shime H, Inoue N. Dynamic regulation of p53 subnuclear localization and senescence by MORC3. Molecular biology of the cell. 2007;18:1701–1709. doi: 10.1091/mbc.E06-08-0747. [DOI] [PMC free article] [PubMed] [Google Scholar]
- 9.Liggins AP, Cooper CD, Lawrie CH, Brown PJ, Collins GP, Hatton CS, Pulford K, Banham AH. MORC4, a novel member of the MORC family, is highly expressed in a subset of diffuse large B-cell lymphomas. British journal of haematology. 2007;138:479–486. doi: 10.1111/j.1365-2141.2007.06680.x. [DOI] [PubMed] [Google Scholar]
- 10.Moissiard G, Cokus SJ, Cary J, Feng S, Billi AC, Stroud H, Husmann D, Zhan Y, Lajoie BR, McCord RP, Hale CJ, Feng W, Michaels SD, Frand AR, Pellegrini M, Dekker J, Kim JK, Jacobsen SE. MORC family ATPases required for heterochromatin condensation and gene silencing. Science. 2012;336:1448–1451. doi: 10.1126/science.1221472. [DOI] [PMC free article] [PubMed] [Google Scholar]
- 11.Shao Y, Li Y, Zhang J, Liu D, Liu F, Zhao Y, Shen T, Li F. Involvement of histone deacetylation in MORC2-mediated down-regulation of carbonic anhydrase IX. Nucleic acids research. 2010;38:2813–2824. doi: 10.1093/nar/gkq006. [DOI] [PMC free article] [PubMed] [Google Scholar]
- 12.Li DQ, Nair SS, Ohshiro K, Kumar A, Nair VS, Pakala SB, Reddy SD, Gajula RP, Eswaran J, Aravind L, Kumar R. MORC2 signaling integrates phosphorylation-dependent, ATPase-coupled chromatin remodeling during the DNA damage response. Cell reports. 2012;2:1657–1669. doi: 10.1016/j.celrep.2012.11.018. [DOI] [PMC free article] [PubMed] [Google Scholar]
- 13.Watson JA, Fang M, Lowenstein JM. Tricarballylate and hydroxycitrate: substrate and inhibitor of ATP: citrate oxaloacetate lyase. Archives of biochemistry and biophysics. 1969;135:209–217. doi: 10.1016/0003-9861(69)90532-3. [DOI] [PubMed] [Google Scholar]
- 14.Takahashi H, McCaffery JM, Irizarry RA, Boeke JD. Nucleocytosolic acetyl-coenzyme a synthetase is required for histone acetylation and global transcription. Molecular cell. 2006;23:207–217. doi: 10.1016/j.molcel.2006.05.040. [DOI] [PubMed] [Google Scholar]
- 15.Wellen KE, Hatzivassiliou G, Sachdeva UM, Bui TV, Cross JR, Thompson CB. ATP-citrate lyase links cellular metabolism to histone acetylation. Science. 2009;324:1076–1080. doi: 10.1126/science.1164097. [DOI] [PMC free article] [PubMed] [Google Scholar]
- 16.Beigneux AP, Kosinski C, Gavino B, Horton JD, Skarnes WC, Young SG. ATP-citrate lyase deficiency in the mouse. The Journal of biological chemistry. 2004;279:9557–9564. doi: 10.1074/jbc.M310512200. [DOI] [PMC free article] [PubMed] [Google Scholar]
- 17.Migita T, Narita T, Nomura K, Miyagi E, Inazuka F, Matsuura M, Ushijima M, Mashima T, Seimiya H, Satoh Y, Okumura S, Nakagawa K, Ishikawa Y. ATP citrate lyase: activation and therapeutic implications in non-small cell lung cancer. Cancer research. 2008;68:8547–8554. doi: 10.1158/0008-5472.CAN-08-1235. [DOI] [PubMed] [Google Scholar]
- 18.Yancy HF, Mason JA, Peters S, Thompson CE, 3rd, Littleton GK, Jett M, Day AA. Metastatic progression and gene expression between breast cancer cell lines from African American and Caucasian women. Journal of carcinogenesis. 2007;6:8. doi: 10.1186/1477-3163-6-8. [DOI] [PMC free article] [PubMed] [Google Scholar]
- 19.Yahagi N, Shimano H, Hasegawa K, Ohashi K, Matsuzaka T, Najima Y, Sekiya M, Tomita S, Okazaki H, Tamura Y, Iizuka Y, Nagai R, Ishibashi S, Kadowaki T, Makuuchi M, Ohnishi S, Osuga J, Yamada N. Co-ordinate activation of lipogenic enzymes in hepatocellular carcinoma. Eur J Cancer. 2005;41:1316–1322. doi: 10.1016/j.ejca.2004.12.037. [DOI] [PubMed] [Google Scholar]
- 20.Varis A, Wolf M, Monni O, Vakkari ML, Kokkola A, Moskaluk C, Frierson H, Jr, Powell SM, Knuutila S, Kallioniemi A, El-Rifai W. Targets of gene amplification and overexpression at 17q in gastric cancer. Cancer research. 2002;62:2625–2629. [PubMed] [Google Scholar]
- 21.Turyn J, Schlichtholz B, Dettlaff-Pokora A, Presler M, Goyke E, Matuszewski M, Kmiec Z, Krajka K, Swierczynski J. Increased activity of glycerol 3-phosphate dehydrogenase and other lipogenic enzymes in human bladder cancer. Hormone and metabolic research = Hormon- und Stoffwechselforschung = Hormones et metabolisme. 2003;35:565–569. doi: 10.1055/s-2003-43500. [DOI] [PubMed] [Google Scholar]
- 22.Szutowicz A, Kwiatkowski J, Angielski S. Lipogenetic and glycolytic enzyme activities in carcinoma and nonmalignant diseases of the human breast. British journal of cancer. 1979;39:681–687. doi: 10.1038/bjc.1979.120. [DOI] [PMC free article] [PubMed] [Google Scholar]
- 23.Halliday KR, Fenoglio-Preiser C, Sillerud LO. Differentiation of human tumors from nonmalignant tissue by natural-abundance 13C NMR spectroscopy. Magnetic resonance in medicine: official journal of the Society of Magnetic Resonance in Medicine/Society of Magnetic Resonance in Medicine. 1988;7:384–411. doi: 10.1002/mrm.1910070403. [DOI] [PubMed] [Google Scholar]
- 24.Hatzivassiliou G, Zhao F, Bauer DE, Andreadis C, Shaw AN, Dhanak D, Hingorani SR, Tuveson DA, Thompson CB. ATP citrate lyase inhibition can suppress tumor cell growth. Cancer cell. 2005;8:311–321. doi: 10.1016/j.ccr.2005.09.008. [DOI] [PubMed] [Google Scholar]
- 25.Bauer DE, Hatzivassiliou G, Zhao F, Andreadis C, Thompson CB. ATP citrate lyase is an important component of cell growth and transformation. Oncogene. 2005;24:6314–6322. doi: 10.1038/sj.onc.1208773. [DOI] [PubMed] [Google Scholar]
- 26.MacDonald MJ, Longacre MJ, Langberg EC, Tibell A, Kendrick MA, Fukao T, Ostenson CG. Decreased levels of metabolic enzymes in pancreatic islets of patients with type 2 diabetes. Diabetologia. 2009;52:1087–1091. doi: 10.1007/s00125-009-1319-6. [DOI] [PMC free article] [PubMed] [Google Scholar]
- 27.Chu KY, Lin Y, Hendel A, Kulpa JE, Brownsey RW, Johnson JD. ATP-citrate lyase reduction mediates palmitate-induced apoptosis in pancreatic beta cells. The Journal of biological chemistry. 2010;285:32606–32615. doi: 10.1074/jbc.M110.157172. [DOI] [PMC free article] [PubMed] [Google Scholar]
- 28.Pearce NJ, Yates JW, Berkhout TA, Jackson B, Tew D, Boyd H, Camilleri P, Sweeney P, Gribble AD, Shaw A, Groot PH. The role of ATP citrate-lyase in the metabolic regulation of plasma lipids. Hypolipidaemic effects of SB-204990, a lactone prodrug of the potent ATP citrate-lyase inhibitor SB-201076. The Biochemical journal. 1998;334(Pt 1):113–119. doi: 10.1042/bj3340113. [DOI] [PMC free article] [PubMed] [Google Scholar]
- 29.Wang Q, Jiang L, Wang J, Li S, Yu Y, You J, Zeng R, Gao X, Rui L, Li W, Liu Y. Abrogation of hepatic ATP-citrate lyase protects against fatty liver and ameliorates hyperglycemia in leptin receptor-deficient mice. Hepatology. 2009;49:1166–1175. doi: 10.1002/hep.22774. [DOI] [PubMed] [Google Scholar]
- 30.Melnick JZ, Srere PA, Elshourbagy NA, Moe OW, Preisig PA, Alpern RJ. Adenosine triphosphate citrate lyase mediates hypocitraturia in rats. The Journal of clinical investigation. 1996;98:2381–2387. doi: 10.1172/JCI119051. [DOI] [PMC free article] [PubMed] [Google Scholar]
- 31.Dignam JD, Lebovitz RM, Roeder RG. Accurate transcription initiation by RNA polymerase II in a soluble extract from isolated mammalian nuclei. Nucleic acids research. 1983;11:1475–1489. doi: 10.1093/nar/11.5.1475. [DOI] [PMC free article] [PubMed] [Google Scholar]
- 32.Linn TC, Srere PA. Identification of ATP citrate lyase as a phosphoprotein. The Journal of biological chemistry. 1979;254:1691–1698. [PubMed] [Google Scholar]
- 33.Oskouian B. Overexpression of fatty acid synthase in SKBR3 breast cancer cell line is mediated via a transcriptional mechanism. Cancer letters. 2000;149:43–51. doi: 10.1016/s0304-3835(99)00342-0. [DOI] [PubMed] [Google Scholar]
- 34.Nieva C, Marro M, Santana-Codina N, Rao S, Petrov D, Sierra A. The lipid phenotype of breast cancer cells characterized by Raman microspectroscopy: towards a stratification of malignancy. PloS one. 2012;7:e46456. doi: 10.1371/journal.pone.0046456. [DOI] [PMC free article] [PubMed] [Google Scholar]
- 35.Sun T, Hayakawa K, Bateman KS, Fraser ME. Identification of the citrate-binding site of human ATP-citrate lyase using X-ray crystallography. The Journal of biological chemistry. 2010;285:27418–27428. doi: 10.1074/jbc.M109.078667. [DOI] [PMC free article] [PubMed] [Google Scholar]
- 36.Murzin AG. Structural classification of proteins: new superfamilies. Current opinion in structural biology. 1996;6:386–394. doi: 10.1016/s0959-440x(96)80059-5. [DOI] [PubMed] [Google Scholar]
- 37.Joyce MA, Fraser ME, Brownie ER, James MN, Bridger WA, Wolodko WT. Probing the nucleotide-binding site of Escherichia coli succinyl-CoA synthetase. Biochemistry. 1999;38:7273–7283. doi: 10.1021/bi990527s. [DOI] [PubMed] [Google Scholar]
- 38.Pierce MW, Palmer JL, Keutmann HT, Avruch J. ATP-citrate lyase. Structure of a tryptic peptide containing the phosphorylation site directed by glucagon and the cAMP-dependent protein kinase. The Journal of biological chemistry. 1981;256:8867–8870. [PubMed] [Google Scholar]
- 39.Ramakrishna S, D’Angelo G, Benjamin WB. Sequence of sites on ATP-citrate lyase and phosphatase inhibitor 2 phosphorylated by multifunctional protein kinase (a glycogen synthase kinase 3 like kinase) Biochemistry. 1990;29:7617–7624. doi: 10.1021/bi00485a011. [DOI] [PubMed] [Google Scholar]
- 40.Berwick DC, Hers I, Heesom KJ, Moule SK, Tavare JM. The identification of ATP-citrate lyase as a protein kinase B (Akt) substrate in primary adipocytes. The Journal of biological chemistry. 2002;277:33895–33900. doi: 10.1074/jbc.M204681200. [DOI] [PubMed] [Google Scholar]
- 41.Lord KA, Wang XM, Simmons SJ, Bruckner RC, Loscig J, O’Connor B, Bentley R, Smallwood A, Chadwick CC, Stevis PE, Ciccarelli RB. Variant cDNA sequences of human ATP:citrate lyase: cloning, expression, and purification from baculovirus-infected insect cells. Protein expression and purification. 1997;9:133–141. doi: 10.1006/prep.1996.0668. [DOI] [PubMed] [Google Scholar]
- 42.Potapova IA, El-Maghrabi MR, Doronin SV, Benjamin WB. Phosphorylation of recombinant human ATP:citrate lyase by cAMP-dependent protein kinase abolishes homotropic allosteric regulation of the enzyme by citrate and increases the enzyme activity. Allosteric activation of ATP:citrate lyase by phosphorylated sugars. Biochemistry. 2000;39:1169–1179. doi: 10.1021/bi992159y. [DOI] [PubMed] [Google Scholar]
- 43.Srere PA. The citrate cleavage enzyme. I. Distribution and purification. The Journal of biological chemistry. 1959;234:2544–2547. [PubMed] [Google Scholar]
- 44.Bernlohr DA, Angus CW, Lane MD, Bolanowski MA, Kelly TJ., Jr Expression of specific mRNAs during adipose differentiation: identification of an mRNA encoding a homologue of myelin P2 protein. Proceedings of the National Academy of Sciences of the United States of America. 1984;81:5468–5472. doi: 10.1073/pnas.81.17.5468. [DOI] [PMC free article] [PubMed] [Google Scholar]
- 45.Zaidi N, Swinnen JV, Smans K. ATP-citrate lyase: a key player in cancer metabolism. Cancer research. 2012;72:3709–3714. doi: 10.1158/0008-5472.CAN-11-4112. [DOI] [PubMed] [Google Scholar]
- 46.Davidson MH. Safety profiles for the HMG-CoA reductase inhibitors: treatment and trust. Drugs. 2001;61:197–206. doi: 10.2165/00003495-200161020-00005. [DOI] [PubMed] [Google Scholar]
- 47.Sarjeant K, Stephens JM. Adipogenesis. Cold Spring Harbor perspectives in biology. 2012;4:a008417. doi: 10.1101/cshperspect.a008417. [DOI] [PMC free article] [PubMed] [Google Scholar]
- 48.Anderson SM, Rudolph MC, McManaman JL, Neville MC. Key stages in mammary gland development. Secretory activation in the mammary gland: it’s not just about milk protein synthesis! Breast cancer research: BCR. 2007;9:204. doi: 10.1186/bcr1653. [DOI] [PMC free article] [PubMed] [Google Scholar]
- 49.Hughes K, Ramakrishna S, Benjamin WB, Woodgett JR. Identification of multifunctional ATP-citrate lyase kinase as the alpha-isoform of glycogen synthase kinase-3. The Biochemical journal. 1992;288(Pt 1):309–314. doi: 10.1042/bj2880309. [DOI] [PMC free article] [PubMed] [Google Scholar]
- 50.Pierce MW, Palmer JL, Keutmann HT, Hall TA, Avruch J. The insulin-directed phosphorylation site on ATP-citrate lyase is identical with the site phosphorylated by the cAMP-dependent protein kinase in vitro. The Journal of biological chemistry. 1982;257:10681–10686. [PubMed] [Google Scholar]
- 51.Yu KT, Benjamin WB, Ramakrishna S, Khalaf N, Czech MP. An insulin-sensitive cytosolic protein kinase accounts for the regulation of ATP citrate-lyase phosphorylation. The Biochemical journal. 1990;268:539–545. doi: 10.1042/bj2680539. [DOI] [PMC free article] [PubMed] [Google Scholar]
- 52.Rosen ED, Walkey CJ, Puigserver P, Spiegelman BM. Transcriptional regulation of adipogenesis. Genes & development. 2000;14:1293–1307. [PubMed] [Google Scholar]
- 53.Galic S, Oakhill JS, Steinberg GR. Adipose tissue as an endocrine organ. Molecular and cellular endocrinology. 2010;316:129–139. doi: 10.1016/j.mce.2009.08.018. [DOI] [PubMed] [Google Scholar]
- 54.Porstmann T, Santos CR, Lewis C, Griffiths B, Schulze A. A new player in the orchestra of cell growth: SREBP activity is regulated by mTORC1 and contributes to the regulation of cell and organ size. Biochemical Society transactions. 2009;37:278–283. doi: 10.1042/BST0370278. [DOI] [PubMed] [Google Scholar]
- 55.Demoulin JB, Ericsson J, Kallin A, Rorsman C, Ronnstrand L, Heldin CH. Platelet-derived growth factor stimulates membrane lipid synthesis through activation of phosphatidylinositol 3-kinase and sterol regulatory element-binding proteins. The Journal of biological chemistry. 2004;279:35392–35402. doi: 10.1074/jbc.M405924200. [DOI] [PubMed] [Google Scholar]
- 56.Menendez JA, Lupu R. Fatty acid synthase and the lipogenic phenotype in cancer pathogenesis. Nature reviews Cancer. 2007;7:763–777. doi: 10.1038/nrc2222. [DOI] [PubMed] [Google Scholar]
Associated Data
This section collects any data citations, data availability statements, or supplementary materials included in this article.