

Background: CTRP4 is a conserved member of the C1q family of secreted proteins with poorly defined function.
Results: CTRP4 acts in the hypothalamus to modulate food intake and body weight by regulating the expression of orexigenic neuropeptide expression.
Conclusion: CTRP4 plays a role in food intake regulation.
Significance: This study establishes the first known in vivo function of CTRP4.
Keywords: Energy Metabolism, Hormones, Hypothalamus, Metabolism, Neuropeptide, Obesity
Abstract
CTRP4 is a unique member of the C1q family, possessing two tandem globular C1q domains. Its physiological function is poorly defined. Here, we show that CTRP4 is an evolutionarily conserved, ∼34-kDa secretory protein expressed in the brain. In human, mouse, and zebrafish brain, CTRP4 expression begins early in development and is widespread in the central nervous system. Neurons, but not astrocytes, express and secrete CTRP4, and secreted proteins form higher-order oligomeric complexes. CTRP4 is also produced by peripheral tissues and circulates in blood. Its serum levels are increased in leptin-deficient obese (ob/ob) mice. Functional studies suggest that CTRP4 acts centrally to modulate energy metabolism. Refeeding following an overnight fast induced the expression of CTRP4 in the hypothalamus. Central administration of recombinant protein suppressed food intake and altered the whole-body energy balance in both chow-fed and high-fat diet-fed mice. Suppression of food intake by CTRP4 is correlated with a decreased expression of orexigenic neuropeptide (Npy and Agrp) genes in the hypothalamus. These results establish CTRP4 as a novel nutrient-responsive central regulator of food intake and energy balance.
Introduction
The C1q family of proteins comprises over 30 members encoded by distinct genes in the human and mouse genomes that are defined by the presence of a C-terminal globular C1q domain (1, 2). Included in the C1q family are the founding member, immune complement C1q (A-, B-, and C-chain) (3), along with multimerins (4, 5), emilins (5, 6), adiponectin (7), CTRPs6 (8–14), cerebellins (Cbln) (15), otolin (16), C1qDC1 (also known as EEG1 or caprin 2) (17), and types VIII and X collagen (18–20). With the exception of C1qDC1, which lacks a signal peptide and resides in the cytosol, all members of the C1q family are secreted proteins that oligomerize to form higher-order multimeric complexes. They play diverse roles in animal physiology, ranging from immunity to metabolism (1, 5, 15, 21).
For example, within the CNS, immune complement C1q mediates synapse elimination (22, 23), whereas cerebellin 1 (Cbln1) promotes synapse formation in cerebellar Purkinje cells (24, 25). Although adipose tissue-derived adiponectin does not play a role in CNS development, it is a circulating insulin-sensitizing adipokine that can act in the brain to modulate food intake and energy expenditure (26, 27) as well as influence depressive-like behavior (28). Of the 15 CTRPs described so far, CTRP13 has been shown recently to act in the hypothalamus to suppress food intake (29), whereas other CTRPs act in the peripheral tissues (e.g. liver, adipose, and skeletal muscle) to regulate glucose and lipid metabolism (9–13, 30–34).
When we initially described the CTRP family of secreted proteins (8), CTRP4 was identified but not characterized, and, hence, its physiological function remains unknown. A recent study suggests that CTRP4 may play a role in promoting human cancer cell survival in vitro (35). Here we provide a detailed molecular, biochemical, and functional characterization of CTRP4. It is a unique protein of the C1q family because it is the only member possessing two tandem C1q domains connected by a short linker. Both the sequence and the developmental expression patterns of CTRP4 within the CNS are conserved between humans, mice, and zebrafish. Our functional studies suggest that CTRP4 is a novel secreted protein that acts in the hypothalamus to modulate food intake and peripheral energy expenditure.
EXPERIMENTAL PROCEDURES
Antibodies and Chemicals
Mouse monoclonal anti-FLAG M2 antibody was obtained from Sigma. Horse anti-mouse IgG and goat anti-rabbit IgG antibody conjugated to horseradish peroxidase were obtained from Cell Signaling Technology. Rabbit polyclonal anti-CTRP4 was obtained from Abcam (catalog no. ab36871).
Animals
C57BL/6 male mice (10–12 weeks old) from The Jackson Laboratory were housed in polycarbonate cages on a 12-h light-dark photocycle and had access to water ad libitum throughout the study period. Age-matched mice were fed, ad libitum, a standard chow diet (chow, Lab Diet, 5001, St. Louis, MO) or a high-fat diet (HFD, 60% kcal derived from fat, Research Diets, catalog no. D12492) from weaning. A separate cohort of age-matched male C57BL/6 mice were fed the HFD or an isocalorically matched low-fat diet (10% kcal derived from fat, Research Diets, catalog no. D12450B) for 14 weeks, beginning at weaning. Sixteen-week-old leptin-deficient (ob/ob) mice and their corresponding lean controls (on a C57BL/6 genetic background) were obtained from The Jackson Laboratory. Using the anterior commissure and the oculomotor nerve as neuroanatomical markers, adult mouse hypothalami were dissected in phosphate-buffered saline solution and subjected to RNA isolation. All animal protocols were approved by the Animal Care and Use Committee of The Johns Hopkins University School of Medicine.
Cloning of Ctrp4
The coding region of Ctrp4 cDNA was cloned from a pool of mouse testis-derived cDNAs (Clontech) using the following primers: 5′-CGCCACCAGCCAGGTGCCATGC-3′ (forward) and 5′-GAGCTCTGGGGGCTTGAGGGCCG-3′ (reverse). A 35-cycle PCR reaction was carried out using high-fidelity Pfu polymerase (Thermo Scientific) in the presence of 8% dimethyl sulfoxide because of high guanine-cytosine (GC) content in the cDNA. The PCR product was gel-purified and cloned into the pCRII-TOPO vector (Invitrogen). The sequence information for Ctrp4 was deposited into the NCBI GenBankTM database (accession number DQ002397).
cDNA Constructs
C-terminal FLAG and HA epitope-tagged CTRP4 were generated by PCR. Primers used to generate CTRP4-FLAG were 5′-CGCCACCAGCCAGGTGCCATGC-3′ and 5′-TCATTTATCGTCATCGTCTTTGTAGTCGAGCTCTGGGGGCTTGAGGGCCG-3′. The sequence corresponding to the FLAG peptide (DYKDDDDK) is underlined. Primers used to generate CTRP4-HA were 5′-CGCCACCAGCCAGGTGCCATGC-3′ and 5′-TCAAGCGTAGTCTGGGACGTCGTATGGGTAGAGCTCTGGGGGCTTGAGGGCCG-3′. The sequence corresponding to the HA peptide (YPYDVPDYA) is underlined. All constructs were verified by DNA sequencing.
Quantitative Real-time PCR Analysis
Quantitative real-time PCR was used to quantify the relative expression levels of CTRP4 mRNA in human and mouse multiple-tissue cDNA panels (Clontech). Mouse tissue was pooled from 200–1000 mice, and human tissue was pooled from 3–15 individuals. As a result, the expression of CTRP4 presented for each type of tissue represents an average value from the pooled cDNA. Mouse (MDRT101) and human (HBRT101) brain tissue quantitative PCR panels (Origene) were used to evaluate the expression of the CTRP4 transcript in various regions of the brain during development and in the adult brain. The hypothalami of C57BL/6 male mice fed ad libitum standard chow diet, fasted overnight (16 h), or fasted overnight and refed for 2 h were also profiled for Ctrp4 expression. Primers used to detect Ctrp4 were as follows: mouse Ctrp4, 5′-TTAGCCACGATCACGATGGCT-3′ (forward) and 5′-TGTACTTGCCGTGGTTGCTGT-3′ (reverse); human CTRP4, 5′-CTCAGCCACGACCACGAC-3′ (forward) and 5′-TGTACTTGCCGTGGTTG CTGT-3′ (reverse); mouse 18S rRNA, 5′-GCAATTATTCCCCATGAACG-3′ (forward) and 5′-GGCCTCA CTAAACCATCCAA-3′ (reverse); and human β-actin, 5′-TCACCCACACTGTGCCCATCTACGA-3′ (forward) and 5′-CAGCGGAACCGCTCATTGCCAATG G-3′ (reverse). The default PCR protocol was used on an Applied Biosystems Prism 7000 sequence detection system. Total RNA was extracted using the RNeasy Midi kit (Qiagen, Valencia, CA). cDNA was generated using SuperScript® II reverse transcriptase (Invitrogen) and random primers (Invitrogen) from 1–2 μg of RNA. For quantitative PCR, samples were analyzed in 25-μl reactions according to the standard protocol provided with SYBR® Green PCR Master Mix (Applied Biosystems).
PCR Analysis of CTRP4 Expression in Cultured Primary Rodent Cortical Neurons
Total RNA was isolated from primary cortical and hippocampal neurons harvested from embryos at day 17 and cultured in vitro for various times using a protocol described previously (36). Cells were harvested at various days in vitro using TRIzol reagent (Invitrogen), and RNA was purified according to the instructions of the manufacturer. cDNA was generated by reverse transcription and used to assess the expression of rat Ctrp4 using the real-time PCR primers 5′-CTTAGCCACGATCATGAT-3′ and 5′-GTGAT GTACTTGCCGTGGTTG-3′. Expression was normalized to rat β-actin. The forward and reverse quantitative PCR primers for rat β-actin were 5′-ATCTGGCACCACACCTTC-3′ and 5′-AGCCAGGTCCAGACGCA-3′.
In Situ Hybridization
All zebrafish (Danio rerio) were raised using standard husbandry procedures. Whole-mount in situ hybridization was carried out as described previously (37). Digoxigenin-labeled sense and antisense riboprobes, corresponding to nucleotides 130–1178 of zebrafish ctrp4 cDNA (GenBankTM accession number NM_001017702), were generated using an in vitro transcription kit (Roche).
HEK293T Cell Transfection
The mammalian expression vector pCDNA3.1 encoding a C-terminal FLAG-tagged CTRP4 was used in our transfection study. HEK 293T cells were cultured in DMEM (Invitrogen) containing 10% fetal bovine serum (Invitrogen) supplemented with 2 mm l-glutamine, 100 units/ml penicillin, and 100 μg/ml streptomycin (Invitrogen). Transient transfections were performed in HEK 293T cells using Lipofectamine 2000 reagent according to the instructions of the manufacturer (Invitrogen). Twenty-four hours after transfection, cells were washed and cultured in serum-free Opti-MEM I medium (Invitrogen) for another 24–48 h before the conditioned medium was collected for Western blot analysis.
Gel Filtration Chromatographic Analysis
Supernatant (500 μl) from transfected HEK 293T cells containing CTRP4 was loaded onto an AKTA FPLC and fractionated through a 10/30 Superdex 200 column (GE Healthcare) in PBS, and 0.5-ml fractions were collected. Aliquots of FPLC fractions 10–27 were subjected to immunoblot analysis.
Western Blotting
C57BL/6 mouse tissues were collected and snap-frozen in liquid nitrogen. Homogenized cell lysates were prepared in lysis buffer (20 mm Tris-HCl, 150 mm NaCl, 1 mm EDTA, 0.5% Nonidet P-40, and 10% glycerol) containing protease and phosphatase inhibitor mixtures (Sigma). Protein content was quantified using Coomassie Plus protein reagent (Thermo Scientific). Western blot analyses were carried out using NuPAGE Novex 10% BisTris gels (Invitrogen) as described previously (38). Signals were visualized with ECL (GE Healthcare) on a MultiImage III FluorChem® Q (Alpha Innotech) and quantified using Alphaview Software (Alpha Innotech).
Recombinant Protein Purification
Full-length recombinant mouse CTRP4 with a C-terminal FLAG tag (DYKDDDDK) was expressed in HEK 293 cells (GripTiteTM 293 cell line, Invitrogen). Expression of recombinant protein in mammalian cells was necessary to ensure that all proper posttranslational modifications of CTRP4 and its assembly into a higher-order oligomeric form were preserved. Serum-free conditioned medium (Opti-MEM, Invitrogen) containing the secreted CTRP4 was purified as described previously (33). Purified proteins were dialyzed against 20 mm HEPES buffer (pH 8.0) containing 135 mm NaCl in a 10-kDa cut-off Slide-A-Lyzer (Thermo Fisher Scientific, Waltham, MA). Protein concentration was determined using a Coomassie Plus protein assay reagent (Thermo Fisher Scientific), and samples were stored at −80 °C. Recombinant protein was determined to be >95% purity by Coomassie Blue-stained gel.
Stereotaxic Cannulation
A unilateral cannula for infusion of recombinant protein was implanted into the cerebral lateral ventricle as described previously (29, 39). After recovery from surgery, baseline food intake was measured, and the correct placement of the cannula was verified by intracerebroventricular (i.c.v.) injection of 1 nmol of neuropeptide Y (NPY) (American Peptide Co., Inc.) during the light cycle. Recombinant CTRP4 (2 μl, 166 ng/μl stock) or vehicle buffer (25 mm HEPES (pH 8.0) and 135 mm NaCl) was administered through the cannula. Food intake and body weight were measured over the course of 3 days after i.c.v. injection. The i.c.v. injection was administered just prior to the start of the dark cycle. Spillage of food was accounted for and subtracted from the total food intake.
Kaolin Test
An ad libitum amount of kaolin clay pellets (Research Diets, New Brunswick, NJ) along with ad libitum access to chow was provided for 1 week to acclimatize the cannulated mice to the novelty of kaolin, as described previously (40). Food intake measurements were recorded at the start of the dark cycle. After acclimatization, an i.c.v. injection of vehicle (HEPES buffer) was administered just prior to the start of the dark cycle, and baseline food intake measurements were recorded for both the kaolin and chow diets at 2 and 24 h post-injection, accounting for spillage. Subsequently, recombinant CTRP4 protein (2 μl, 166 ng/μl stock) was delivered via i.c.v. injection, and food intake measurements for both the kaolin and chow diets were recorded at 2 and 24 h, accounting for spillage.
Cerebrospinal Fluid Withdrawal
Male mice fed ad libitum were given an intraperitoneal injection of 0.5 μg/g body weight of recombinant FLAG-tagged CTRP4 or volume-matched saline (control). At 3 and 5 h post-injection, serum was harvested by tail bleed, and cerebrospinal fluid was collected via cisterna magna puncture as described (41). Cerebrospinal fluid and sera were immediately frozen and processed for Western blotting.
Indirect Calorimetry
Mice on a chow diet and diet-induced obese (DIO) mice (n = 5–6) were used for simultaneous assessments of daily body weight, energy intake (corrected for spillage), and whole-body metabolic profile in an open-flow indirect calorimeter (Comprehensive Laboratory Animal Monitoring System, Columbus Instruments). Data were collected for 3 days to confirm acclimation to the calorimetry chambers (stable body weights and food intakes), and data from days 4–6 in the Oxymax were analyzed. Rates of oxygen consumption (VO2, ml/kg/h) and carbon dioxide production (VCO2) were measured for each chamber every 11 min throughout the study. Respiratory exchange ratio (RER = VCO2 / VO2) was calculated by Oxymax software (v. 4.86) to estimate relative oxidation of carbohydrate (RER = 1.0) versus fat (RER approaching 0.7), not accounting for protein oxidation. Energy expenditure was calculated as EE = VO2 × (3.815 + (1.232 × RER) (42) and normalized for body mass (kcal/kg/h). Average metabolic values were calculated per subject and averaged across subjects for statistical analysis by Student's t test, with p ≤ 0.05 indicating significant differences between groups.
Glucose Tolerance Test
Food was removed for a total of 4–5 h prior to and during i.c.v. injection of recombinant CTRP4. Intraperitoneal glucose tolerance test (1 g/kg glucose) was performed shortly after i.c.v. injection. Blood glucose was measured at 0, 15, 30, 60, and 90 min using a glucometer (BD Biosciences).
Statistical Analysis
All value comparisons were made using either a two-tailed Student's t test, one-way analysis of variance or repeated measures analysis of variance (Statistica, v.8.0, Tulsa, OK). Values reported are mean + S.E. p < 0.05 was considered statistically significant.
RESULTS
Analysis of CTRP4 cDNA, Gene, and Protein
Of the more than 30 C1q family members encoded by the human and mouse genomes, CTRP4 is unique in having two tandem globular C1q domains connected by a short, non-conserved, 18-amino acid linker (Fig. 1). There are two highly conserved cysteine residues located at position 69 within the first C1q domain and at position 221 within the second C1q domain. Interestingly, the second C-terminal globular domain also contains an “RGD” (arginine-glycine-aspartate) peptide that can potentially interact with integrins (43). Both human and mouse CTRP4 genes have similar exon/intron structures (Fig. 1B). The mouse Ctrp4 gene is 4.6 kb long, consists of two exons, and is located on chromosome 2E1. The human CTRP4 gene is 4.7 kb long, consists of two exons, and is located on chromosome 11q11. A unique feature of Ctrp4, in contrast to all other genes encoding C1q family members, is that the entire protein is encoded by a single exon. CTRP4 is also highly conserved throughout evolution. Mouse CTRP4 and its corresponding human ortholog share 92, 98, and 93% amino acid identity in their short N-terminal region, N-terminal globular domain, and C-terminal globular domain, respectively. CTRP4 orthologs from the draft genome sequence of dog (Canis familiaris), platypus (Ornithorhynchus anatinus), frog (Xenopus tropicalis), puffer fish (Tetraodon nigroviridis), and zebrafish (D. rerio) also show significant conservation, with amino acid identities of 94, 96, 76, 54, and 50% to the full-length mouse CTRP4, respectively (Fig. 1A). Structure-based alignment between adiponectin, complement C1q, and TNF family members (TNF-α, TNF-β, and CD40L) reveals four highly conserved residues (Gly-159, Tyr-161, Phe-237, and Leu-241 in adiponectin) important in the packing of the hydrophobic core of the protomer (44). These residues are also conserved in CTRP4 (Fig. 1A, arrows). Within the C1q family, CTRP4 is most closely related to C1qDC1/Caprin (17) and shares the highest degree of amino acid identity (44%) with the globular domain of C1qDC1.
FIGURE 1.

Conservation of CTRP4 in vertebrates. A, ClustalW alignment (73) of the tandem globular C1q domain of CTRP4. Protein sequences were extracted from the NCBI RefSeq or the draft genome sequences of mouse (Mus musculus, accession number NP_080437), human (Homo sapiens, accession number AAH35628), dog (C. familiaris, accession no. XP_540740), platypus (O. anatinus, accession no. XP_001513387), frog (X. tropicalis, accession number NP_001011345), puffer fish (T. nigroviridis, accession number CAG03423), and zebrafish (D. rerio, accession no. NP_001038472). Identical amino acids are shaded, with gaps indicated by a dashed line. The conserved Cys residues are indicated by a ball and stick. The red line indicates the globular C1q domain, and the blue line indicates the linker region. Arrows indicate the conserved residues found in all C1q/TNF family members (44). Amino acid numberings are indicated on the left. B, the CTRP4 gene is located on mouse chromosome 2E1, and its human counterpart is located in the syntenic region on human chromosome 11q11. The small gene (∼4.6 kb) consists of two exons and one intron. The sizes of each exon and intron are indicated. Exon 1 encodes the 5′ UTR of the cDNA. The white square on exon 2 encodes the 3′ UTR of the cDNA.
Expression of CTRP4 Transcript and Protein
A survey of 17 adult mouse tissues and tissues from mice at four distinct developmental stages using quantitative real-time PCR showed that the testes, kidney, and brain express the highest levels of Ctrp4 transcript (Fig. 2A). In 16 human tissues and 10 immune cell types surveyed, adipose tissue and brain had the highest expression levels of CTRP4 (Fig. 2B). Protein expression of CTRP4 was consistent with mRNA expression in mouse tissues (Fig. 2C). Within the mouse CNS, Ctrp4 transcripts were widely expressed during development and in the adult brain, with the highest level seen in the frontal cortex (Fig. 3A). Similar to Ctrp4 mRNA, CTRP4 protein was detected in different mouse brain regions, with lower levels seen in the hind brain (Fig. 3, B and C). In humans, CTRP4 was also widely expressed throughout different regions of the brain (Fig. 3D). Predominant and widespread expression of the ctrp4 transcript in the brain, beginning early during development, was an evolutionarily conserved feature seen also in the zebrafish (Fig. 4). Within the CNS, neurons, but not astrocytes, expressed Ctrp4 (Fig. 5, A and B). In accordance with mRNA expression, we detected CTRP4 in cell lysate derived from cultured primary cortical neurons using a CTRP4-specific antibody (Fig. 5C). Endogenous CTRP4 was secreted into the conditioned medium of cultured primary rodent neurons (Fig. 5D). Cortical and hippocampal neurons were used because of the ease of isolating a pure population of cells.
FIGURE 2.

Expression of the CTRP4 transcript in mouse and human tissues. A and B, quantitative real-time PCR analysis of CTRP4 mRNA in mouse (A) and human (B) multiple-tissue cDNA panels (Clontech). The expression level of CTRP4 transcript in each tissue was normalized to its corresponding 18 S rRNA expression level. C, Western blot analysis of CTRP4 in mouse tissues.
FIGURE 3.

Expression of the CTRP4 transcript in mouse and human brain. A, quantitative real-time PCR analysis of CTRP4 mRNA in different mouse brain regions for three developmental stages. B, Western blot analysis of CTRP4 in different mouse brain regions. C, quantification of Western blot analyses (n = 3 mice/group) as shown in B. The protein level was normalized to the corresponding tubulin expression level. D, expression of CTRP4 mRNA in different brain regions in the adult human. The expression level of CTRP4 transcript in each brain region was normalized to its corresponding human β-actin expression level.
FIGURE 4.
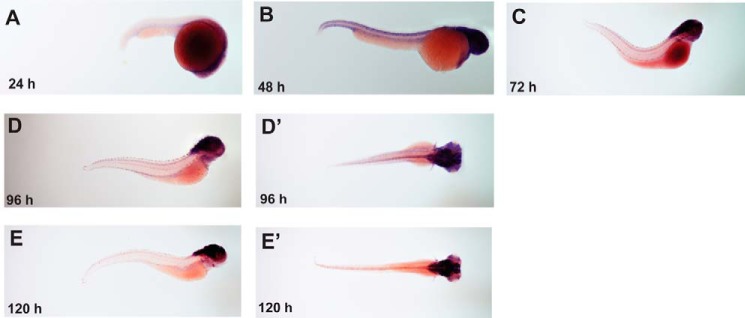
Expression of the ctrp4 transcript in the developing zebrafish. Whole-mount in situ hybridization was conducted to evaluate the expression of ctrp4 in zebrafish embryos at 24 h (A), 48 h (B), 72 h (C), 96 h (D), and 120 h (E) post-fertilization. D' and E' represent the dorsal view of the zebrafish embryo to highlight the prominent expression of ctrp4 in the brain.
FIGURE 5.

CTRP4 is produced and secreted by neurons. A, the Ctrp4 transcript is highly expressed in primary rodent neurons, and the entire coding region of the cDNA can be readily amplified by PCR. B, real-time PCR analysis of Ctrp4 expression in isolated primary rat neurons versus astrocytes. The expression level was normalized to rat β-actin. C, detection of CTRP4 protein in the cell lysate of isolated primary neurons by immunoblot analysis using a CTRP4-specific antibody. D, detection of secreted CTRP4 in the conditioned medium of primary cortical and hippocampal neurons by immunoblot analysis. Medium was harvested on days 2, 7, 10, and 14. DIV, days in vitro. Molecular weight markers are indicated on the left of each immunoblot analysis.
CTRP4 has a predicted signal peptide within residues 1–16. When FLAG-tagged CTRP4 was expressed in heterologous HEK 293T cells, immunoblot analyses of cell supernatants detected an ∼34-kDa protein (Fig. 6A) that matched the predicted 33.3-kDa molecular mass of CTRP4, confirming its secretion. All CTRP family members that have been studied to date form trimers as their basic structural units (9, 10, 12–14, 38). Many of these trimeric proteins are further assembled into higher-order oligomeric complexes consisting of hexamers and high molecular weight oligomers of 12–18 subunits (10, 12–14). On a non-reducing SDS/PAGE immunoblot analysis, the apparent dimeric, trimeric, and hexameric forms of secreted CTRP4 were detected, indicating the presence of intermolecular disulfide bonds (Fig. 6B). Gel filtration (FPLC) analysis independently confirmed that secreted CTRP4 indeed forms higher-order oligomeric complexes that correspond to the presumed trimers, hexamers, and high molecular weight oligomers (Fig. 6C).
FIGURE 6.

Secreted CTRP4 forms higher-order oligomeric complexes. A, HEK 293T cells were transfected with mammalian expression vectors (pCDNA3.1) alone or vectors encoding a C-terminal FLAG-tagged mouse CTRP4. Cell pellets (P) and serum-free supernatant (S) from transfected cells were subjected to immunoblot analysis using an anti-FLAG antibody. B, conditioned medium containing CTRP4 was subjected to immunoblot analysis in the presence or absence of the reducing agent β-mercaptoethanol (β-ME). HMW, high molecular weight. C, supernatant containing CTRP4 was loaded onto a Superdex 200 FPLC column, and 0.5-ml fractions were collected. Fractions 10–36 were analyzed by SDS-PAGE immunoblot analysis using an anti-FLAG antibody. The arrows correspond to the peak elution fractions of molecular standard thyroglobulin, ferritin, catalase, and aldolase with molecular weights of 669, 440, 232, and 158 kDa, respectively. The numbers on the left of each immunoblot analysis indicate the molecular weight marker. D, Western blot quantification of serum CTRP4 in leptin-deficient ob/ob mice (n = 7) and lean controls (n = 7). Each lane represents serum from a different mouse. Only four serum samples from each group are shown. E, Western blot quantification of serum CTRP4 levels in mice fed a low-fat diet (LFD, n = 7) and high-fat diet (n = 7). Each lane represents serum from a different mouse. Only four serum samples from each group are shown. **, p < 0.01. NS, not significant.
Given that CTRP4 is a secreted protein expressed in peripheral tissues, we examined whether it circulates in plasma. Western blotting detected CTRP4 in serum and showed that circulating levels were increased in leptin-deficient ob/ob mice (a genetic model of hyperphagia and morbid obesity) relative to age-matched lean controls (Fig. 6D). No difference in serum levels of CTRP4 were detected between mice fed a low-fat versus high-fat diet for 14 weeks (Fig. 6E).
The Metabolic State Alters Ctrp4 Expression in Central and Peripheral Tissues
The prominent expression of Ctrp4 in the CNS combined with the known metabolic function of other CTRPs (9–13, 30–34) prompted us to examine whether expression of Ctrp4 in the brain, particularly the hypothalamus, modulated food intake and energy metabolism (45). When wild-type C57BL/6 male mice were fasted overnight (16 h) and refed for 3 h, a significant 2-fold increase in hypothalamic Ctrp4 expression was observed relative to mice fasted overnight (Fig. 7A), although no difference in Ctrp4 expression was seen in other brain regions such as the cortex, cerebellum, and hippocampus. However, Western blot analyses revealed no significant difference in CTRP4 in the hypothalami of fasted versus refed mice (Fig. 7B), potentially because of differential kinetics between mRNA and protein expression and/or turnover. These results indicate that acute physiological perturbation of the metabolic state, as in fasting and refeeding, can dynamically alter Ctrp4 expression in the hypothalamus.
FIGURE 7.

Refeeding after fasting induces the expression of Ctrp4 in the hypothalamus. A–C, C57BL/6 male mice (∼8 weeks old, n = 7–8 mice/group) were fasted overnight or fasted overnight followed by 3 h of refeeding. A, different brain regions were harvested, and Ctrp4 expression was quantified by real-time PCR. B, CTRP4 expression was quantified by Western blotting. C, peripheral tissues were also harvested, and Ctrp4 expression was quantified by real-time PCR. D, Western blot quantification of serum CTRP4 levels in mice fasted overnight or fasted overnight followed by 3h of refeeding (n = 7 mice/group). PCR results were normalized to 18 S rRNA. Western blot analysis results were normalized to tubulin. Each lane represents a sample from a different mouse. **, p < 0.01 compared with the fasted group; NS, not significant.
Because CTRP4 is also expressed in peripheral tissues, we measured Ctrp4 expression outside of the CNS. Fasting/refeeding had no effect on Ctrp4 expression in the three major metabolically active tissues: adipose, liver, and skeletal muscle (Fig. 7C). Circulating serum levels of CTRP4 also did not differ between fasted and refed mice (Fig. 7D).
Central Delivery of Recombinant CTRP4 Reduces Food Intake and Body Weight
To address the potential metabolic role of CTRP4, recombinant protein was delivered into the lateral ventricle of cannulated mice. Protein injected into the lateral ventricle rapidly diffuses through the cerebrospinal fluid and gains access to the hypothalamus and other brain regions (46). A single i.c.v. injection of recombinant CTRP4 reduced food intake and body weight in wild-type male mice fed a chow diet relative to vehicle-injected controls (Fig. 8, A and B). This effect was sustained over a two-day period. The effect on food intake was gone 3 days post-injection, likely because of protein washout from normal turnover in the CNS. The CTRP4-mediated suppression of food intake was also observed when a single dose of recombinant protein was delivered centrally into DIO mice fed a high-fat diet from weaning (Fig. 8D), resulting in a modest reduction in body weight of DIO mice (E). Further, the biological activity of CTRP4 requires proper protein folding. Central delivery of heat-denatured CTRP4 had no effect on food intake (supplemental Fig. S1).
FIGURE 8.

Central administration of recombinant CTRP4 alters food intake and body weight in lean and obese mice. Shown are food intake (A), body weight (B), and physical activity (C) of lean chow-fed mice (n = 5) injected centrally with recombinant CTRP4. Also shown are food intake (D), body weight (E), and physical activity (F) of obese HFD-fed mice (n = 6) injected centrally with recombinant CTRP4. Observations were made over the course of 3 days. *, p < 0.05.
In both chow- and high-fat diet-fed mice, central administration of CTRP4 also transiently decreased ambulatory activity levels (Fig. 8, C and F). Reduced food intake and ambulatory activity could have resulted from visceral illness induced by central delivery of the recombinant protein. To rule this out, a kaolin test was performed (47). Under normal circumstances (and even when food-deprived), rodents consume little or no kaolin clay pellets. However, mice that have visceral illness prefer kaolin clay pellets over standard chow pellets (47). Cannulated mice injected with recombinant CTRP4 consistently preferred chow over kaolin pellets (data not shown), indicating that CTRP4 delivery did not result in nonspecific visceral sickness.
Effects of CTRP4 on Whole-body Metabolism
Given the central effects of CTRP4 on food intake, we employed indirect calorimetry to address whether central delivery of recombinant protein alters whole-body energy metabolism. In chow-fed mice, central administration of CTRP4 modestly decreased energy expenditure and led to a lower respiratory quotient relative to vehicle-injected controls 2 days post-injection (Fig. 9, A and B). However, in DIO mice fed a high-fat diet, no differences were observed in energy expenditure when CTRP4 was injected centrally (Fig. 9C). Similar to chow-fed mice, a reduction in the respiratory quotient was also observed in DIO mice injected with CTRP4 (Fig. 9D), indicative of a greater oxidation of lipid substrates. The decreased RER likely reflects a decreased food intake. Next, we tested whether central delivery of recombinant CTRP4 alters peripheral glucose metabolism. Both CTRP4-injected chow-fed and DIO mice showed no significant differences in their ability to handle the glucose challenge relative to vehicle-injected controls (Fig. 10).
FIGURE 9.

Indirect calorimetry of lean chow-fed and obese high-fat diet-fed mice injected centrally with recombinant CTRP4. Shown are energy expenditure (A) and RER (B) of lean chow-fed mice (n = 6) injected centrally with recombinant CTRP4. Also shown are energy expenditure (C) and RER (D) of obese HFD-fed mice injected centrally with recombinant CTRP4 (n = 6). Observations were made over the course of 3 days. *, p < 0.05.
FIGURE 10.
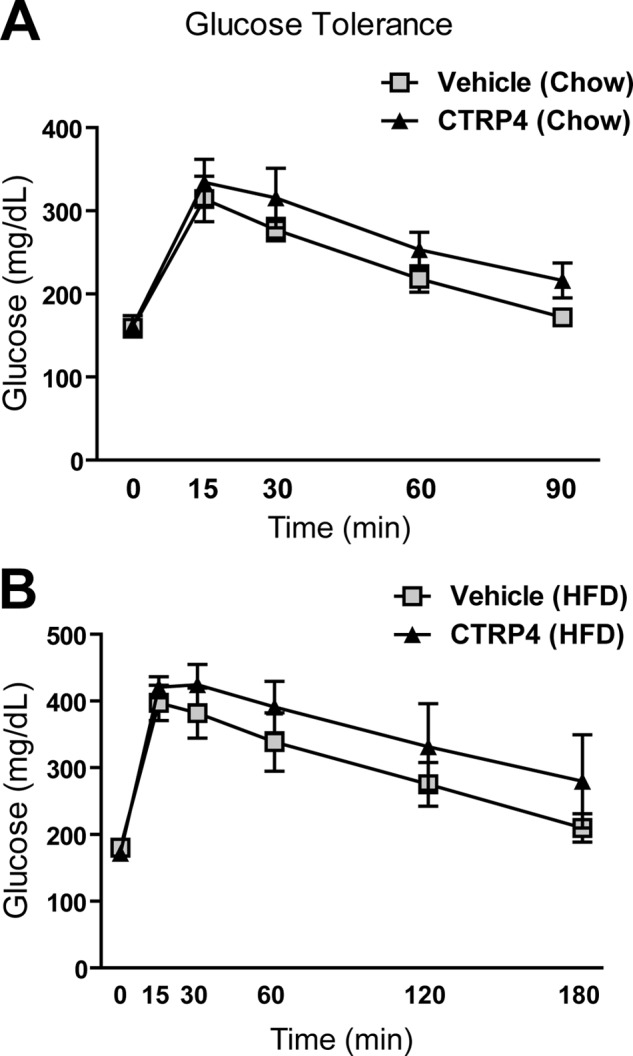
Central administration of recombinant CTRP4 does not alter glucose tolerance in chow- or high-fat diet-fed mice. Shown are average blood glucose levels during glucose tolerance tests of lean chow-fed (A) and obese HFD-fed (B) mice injected centrally with recombinant CTRP4. n = 6 mice/group.
Central Delivery of Recombinant CTRP4 Reduces Hypothalamic Orexigenic Neuropeptide Expression
The expression of neuropeptides is known to play a key role in modulating food intake (45). In a separate cohort of mice, central delivery of recombinant CTRP4 acutely reduced orexigenic neuropeptide gene expression (Npy and Agrp) in the hypothalamus 3 h post-injection (Fig. 11, A and B). This effect was more pronounced in DIO mice. These results are consistent with the reduced food intake observed in CTRP4-injected mice. In contrast, hypothalamic expression of Mc4r was not different between vehicle or CTRP4-injected mice (Fig. 11C).
FIGURE 11.
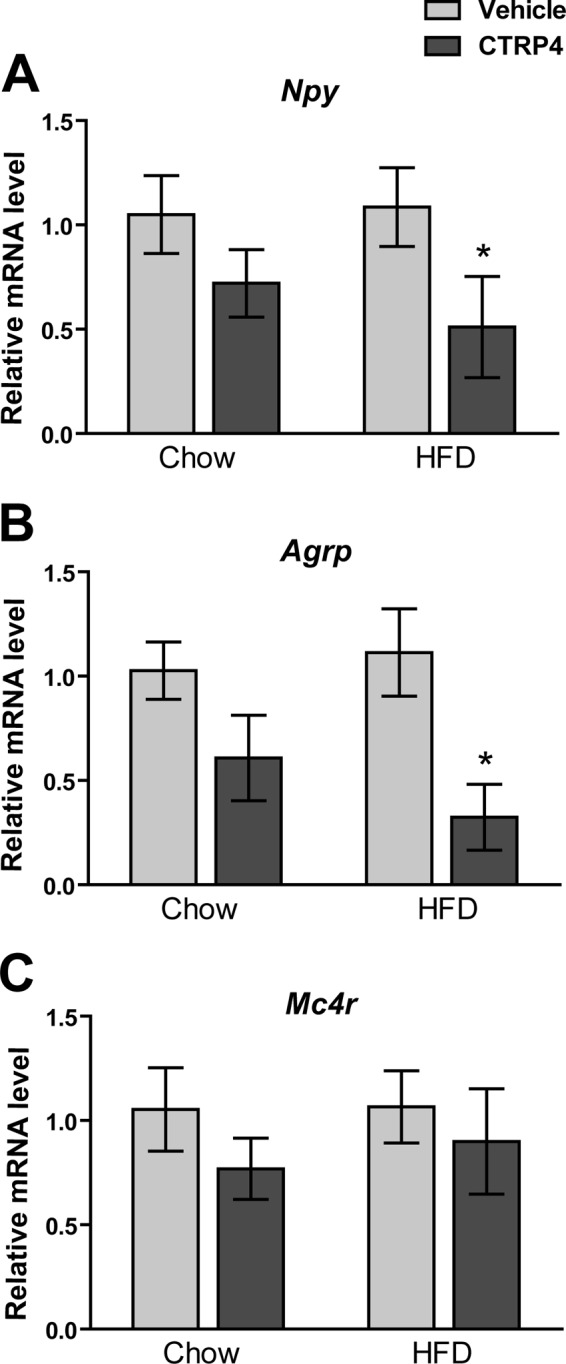
Central administration of recombinant CTRP4 alters hypothalamic orexigenic neuropeptide expression. Shown is the quantitative real-time PCR analysis of Npy (A), Agrp (B), and Mc4r (C) expression in the hypothalamus of chow- or HFD-fed mice (n = 6 mice/group) injected centrally with vehicle control or recombinant CTRP4. Hypothalami were harvested 3 h post-injection. *, p < 0.05.
Peripheral Delivery of Recombinant CTRP4
Because CTRP4 circulates in plasma, we determined whether intraperitoneal injection of FLAG epitope-tagged CTRP4 could access the cerebrospinal fluid that baths the CNS. Qi et al. (26) showed that peripherally delivered adiponectin, a C1q family member, can access the CNS 3 h after delivery, so we examined detection at that time point. At 3 h post-injection, we detected CTRP4-FLAG in serum as well as in the cerebrospinal fluid by immunoblotting with an anti-FLAG or anti-CTRP4 antibody (Fig. 12A). This indicates that CTRP4 can likely cross the blood-brain barrier. However, CTRP4-FLAG could no longer be detected 5 h post-injection (data not shown). When CTRP4 was injected at a dose of 2 μg/g body weight, we observed a trending reduction in food intake relative to vehicle-injected mice after just 1 h (Fig. 12B), although this difference was not significant. Further, no differences between the two groups of mice in food intake, body weight, or blood glucose levels were observed 24 h post-injection (Fig. 12, B–D).
FIGURE 12.

Peripheral administration of recombinant CTRP4. A, Western blot analysis of sera and cerebrospinal fluid from mice injected intraperitoneal with recombinant FLAG epitope-tagged CTRP4 (0.5 μg/g body weight). B, food intake at 1 and 24 h post-intraperitoneal injection of vehicle (n = 10) and recombinant CTRP4 (2 μg/g body weight, n = 4). C, body weight of mice pre- and post-intraperitoneal injection with vehicle (n = 10) and recombinant CTRP4 (n = 4). D, blood glucose of mice pre- and post-intraperitoneal injection of vehicle (n = 10) and recombinant CTRP4 (n = 4).
DISCUSSION
The central control of food intake involves the integration of peripheral and central signals within the CNS, primarily in the hypothalamus (45). These signals could be conveyed by metabolites such as glucose (48) and lipids (49, 50) or by circulating hormones (40, 51, 52). Here we provide evidence that CTRP4 is a novel and conserved secreted protein that acts in the hypothalamus to modulate food intake and body weight. Refeeding following an overnight fast induced the expression of CTRP4 within the hypothalamus. Thus, the acute rise of CTRP4 within the hypothalamus during refeeding may be physiologically linked to its role in modulating food intake. Indeed, central delivery of recombinant CTRP4 acutely suppresses food intake and decreases body weight (Fig. 8). Suppression of food intake by CTRP4 correlates with decreased expression of orexigenic neuropeptide (Npy and Agrp) gene expression in the hypothalamus (Fig. 11). Recently, the hind brain has also been shown to play an important role in the control of ingestive behavior (53–55). It remains to be established whether CTRP4 also acts in the hind brain, in addition to the hypothalamus, to modulate food intake. In contrast to the phenomenon of leptin resistance in DIO mice or obese humans, in whom high circulating levels of leptin fail to suppress food intake (56, 57), DIO mice retain their responsiveness to the anorexigenic effect of CTRP4.
Interestingly, neurons, but not astrocytes, express and secrete CTRP4. Given that the expression of CTRP4 is widespread within the CNS and that its transcript can be detected throughout development in the mouse brain, it is likely that CTRP4 may play a neurotrophic or other, yet to be identified role within the CNS. Its widespread expression within the CNS does not preclude a possible physiological role in regulating ingestive behavior. For example, the orexigenic neuropeptide NPY is widely expressed in the CNS (58), and it also serves as a neuroproliferative signal (59). Other examples include the neurotrophic factors brain-derived neurotrophic factor (BDNF) and ciliary neurotrophic factor (CNTF). Both are highly expressed within the CNS (60, 61), and both act on their respective receptors (TrkB and CNTFR) to maintain growth, survival, and differentiation of neurons (62, 63). In addition, both have been shown to play a role in regulating ingestive behavior by acting on neurons within the hypothalamus (64, 65) or the hind brain (66). Indeed, central delivery of BDNF or CNTF acutely suppresses food intake in mice (64–66), and conditional loss of function of BDNF in the brain of postnatal mice results in obesity (67).
Along with expression in the CNS, CTRP4 is expressed in multiple peripheral tissues. In mice, we detected relatively high expression levels of Ctrp4 transcripts in the kidney and, especially, testes. The role of CTRP4 in these tissues is unclear. Intriguingly, and in striking contrast to the mouse, human adipose tissue appears to express high levels of the CTRP4 transcript. The reason for this discrepancy is unclear and may reflect intrinsic differences between the two species. Leptin-deficient ob/ob mice, the genetic model of hyperphagia and morbid obesity, have 2-fold increased circulating CTRP4 levels. Intriguingly, in a DIO model where mice are chronically fed a high-fat diet, serum CTRP4 levels do not differ from control mice fed a low-fat diet. These contrasting results between the genetic and DIO models suggest that leptin may regulate the expression of CTRP4. Alternatively, increased serum CTRP4 levels could represent a compensatory response to uncontrolled feeding (hyperphagia) in ob/ob mice that is not observed in DIO mice.
In contrast to the hypothalamus, fasting and refeeding in mice does not alter Ctrp4 transcript levels in the three major metabolic tissues (adipose, liver, and skeletal muscle). Interestingly, circulating CTRP4 produced by the peripheral tissues can access the cerebrospinal fluid, and intraperitoneal injection of recombinant CTRP4 transiently and modestly decreases food intake. It is likely that hypothalamic neurons may be exposed to a higher concentration of CTRP4 produced locally within the CNS, which may explain the biological potency of recombinant CTRP4 delivered centrally via i.c.v. injection. Future studies are needed to clarify the physiological role of CTRP4 in the peripheral tissues.
In both humans and mice, the brain expressed the second-highest levels of CTRP4 transcript. In the developing zebrafish, the brain is also the primary and predominant tissue that expresses ctrp4 mRNA. Thus, high expression of CTRP4 in the neurons of the CNS is likely conserved among vertebrates. A potential ortholog of CTRP4, with shared tandem C1q domains, was also identified in the draft genome of Ciona intestinalis (Ensembl transcript accession number ENSCINT00000037156) (68) on the basis of sequence homology (∼43% amino acid identity between human and C. intestinalis). This suggests the presence of a putative functional CTRP4 in the urochordate, the most basal chordate group related to vertebrates (68). The evolutionary conservation of CTRP4 suggests a highly conserved function regulated by this secreted protein, which is likely related to ingestive behavior.
Unlike any of the CTRPs described to date (8–14), CTRP4 does not possess a collagen-like domain with the characteristic Gly-X-Y repeat. Its simple modular structure consists of a signal peptide for protein secretion, followed by two tandem globular C1q domains. This unique feature is not shared by any of the C1q family members (1). However, one common feature that is shared with all C1q family members is the formation of a higher-order oligomeric structure with a trimeric complex as the basic structural unit (44, 69–72). Most CTRPs also form higher-order structures greater than a trimer (9, 10, 12–14). From size exclusion chromatographic analysis, it appears that CTRP4 predominantly exists as a hexamer of ∼210 kDa. The functional significance of CTRP oligomers remains largely undefined, with the exception of CTRP12 (38).
In summary, this study describes the first known in vivo physiological function of CTRP4. Future studies using CTRP4 loss-of-function mice will likely uncover other functions of this well conserved protein in the central and peripheral tissues.
This work was supported, in whole or in part, by National Institutes of Health Grant DK084171 (to G. W. W.). This work was also supported by American Heart Association Grant SDG2260721 (to G. W. W.).

This article contains supplemental Fig. S1.
- CTRP
- C1q/TNF-related protein
- NPY
- neuropeptide Y
- HFD
- high-fat diet
- i.c.v.
- intracerebroventricular
- DIO
- diet-induced obese
- VO2
- oxygen consumption
- VCO2
- carbon dioxide production
- RER
- respiratory exchange ratio.
REFERENCES
- 1. Kishore U., Gaboriaud C., Waters P., Shrive A. K., Greenhough T. J., Reid K. B., Sim R. B., Arlaud G. J. (2004) C1q and tumor necrosis factor superfamily. Modularity and versatility. Trends Immunol. 25, 551–561 [DOI] [PubMed] [Google Scholar]
- 2. Tom Tang Y., Hu T., Arterburn M., Boyle B., Bright J. M., Palencia S., Emtage P. C., Funk W. D. (2005) The complete complement of C1q-domain-containing proteins in Homo sapiens. Genomics 86, 100–111 [DOI] [PubMed] [Google Scholar]
- 3. Kishore U., Reid K. B. (2000) C1q. Structure, function, and receptors. Immunopharmacology 49, 159–170 [DOI] [PubMed] [Google Scholar]
- 4. Jeimy S. B., Tasneem S., Cramer E. M., Hayward C. P. (2008) Multimerin 1. Platelets 19, 83–95 [DOI] [PubMed] [Google Scholar]
- 5. Colombatti A., Spessotto P., Doliana R., Mongiat M., Bressan G. M., Esposito G. (2011) The EMILIN/Multimerin family. Front. Immunol. 2, 93. [DOI] [PMC free article] [PubMed] [Google Scholar]
- 6. Colombatti A., Doliana R., Bot S., Canton A., Mongiat M., Mungiguerra G., Paron-Cilli S., Spessotto P. (2000) The EMILIN protein family. Matrix Biol. 19, 289–301 [DOI] [PubMed] [Google Scholar]
- 7. Scherer P. E., Williams S., Fogliano M., Baldini G., Lodish H. F. (1995) A novel serum protein similar to C1q, produced exclusively in adipocytes. J. Biol. Chem. 270, 26746–26749 [DOI] [PubMed] [Google Scholar]
- 8. Wong G. W., Wang J., Hug C., Tsao T. S., Lodish H. F. (2004) A family of Acrp30/adiponectin structural and functional paralogs. Proc. Natl. Acad. Sci. U.S.A. 101, 10302–10307 [DOI] [PMC free article] [PubMed] [Google Scholar]
- 9. Wong G. W., Krawczyk S. A., Kitidis-Mitrokostas C., Ge G., Spooner E., Hug C., Gimeno R., Lodish H. F. (2009) Identification and characterization of CTRP9, a novel secreted glycoprotein, from adipose tissue that reduces serum glucose in mice and forms heterotrimers with adiponectin. FASEB J. 23, 241–258 [DOI] [PMC free article] [PubMed] [Google Scholar]
- 10. Wong G. W., Krawczyk S. A., Kitidis-Mitrokostas C., Revett T., Gimeno R., Lodish H. F. (2008) Molecular, biochemical and functional characterizations of C1q/TNF family members. Adipose-tissue-selective expression patterns, regulation by PPAR-γ agonist, cysteine-mediated oligomerizations, combinatorial associations and metabolic functions. Biochem. J. 416, 161–177 [DOI] [PMC free article] [PubMed] [Google Scholar]
- 11. Wei Z., Peterson J. M., Lei X., Cebotaru L., Wolfgang M. J., Baldeviano G. C., Wong G. W. (2012) C1q/TNF-related protein-12 (CTRP12), a novel adipokine that improves insulin sensitivity and glycemic control in mouse models of obesity and diabetes. J. Biol. Chem. 287, 10301–10315 [DOI] [PMC free article] [PubMed] [Google Scholar]
- 12. Wei Z., Peterson J. M., Wong G. W. (2011) Metabolic regulation by C1q/TNF-related protein-13 (CTRP13). Activation OF AMP-activated protein kinase and suppression of fatty acid-induced JNK signaling. J. Biol. Chem. 286, 15652–15665 [DOI] [PMC free article] [PubMed] [Google Scholar]
- 13. Seldin M. M., Peterson J. M., Byerly M. S., Wei Z., Wong G. W. (2012) Myonectin (CTRP15), a novel myokine that links skeletal muscle to systemic lipid homeostasis. J. Biol. Chem. 287, 11968–11980 [DOI] [PMC free article] [PubMed] [Google Scholar]
- 14. Wei Z., Seldin M. M., Natarajan N., Djemal D. C., Peterson J. M., Wong G. W. (2013) C1q/tumor necrosis factor-related protein 11 (CTRP11), a novel adipose stroma-derived regulator of adipogenesis. J. Biol. Chem. 288, 10214–10229 [DOI] [PMC free article] [PubMed] [Google Scholar]
- 15. Yuzaki M. (2008) Cbln and C1q family proteins. New transneuronal cytokines. Cell Mol. Life Sci. 65, 1698–1705 [DOI] [PMC free article] [PubMed] [Google Scholar]
- 16. Deans M. R., Peterson J. M., Wong G. W. (2010) Mammalian Otolin. A multimeric glycoprotein specific to the inner ear that interacts with otoconial matrix protein Otoconin-90 and Cerebellin-1. PLoS ONE 5, e12765. [DOI] [PMC free article] [PubMed] [Google Scholar]
- 17. Aerbajinai W., Lee Y. T., Wojda U., Barr V. A., Miller J. L. (2004) Cloning and characterization of a gene expressed during terminal differentiation that encodes a novel inhibitor of growth. J. Biol. Chem. 279, 1916–1921 [DOI] [PubMed] [Google Scholar]
- 18. Yamaguchi N., Benya P. D., van der Rest M., Ninomiya Y. (1989) The cloning and sequencing of α 1(VIII) collagen cDNAs demonstrate that type VIII collagen is a short chain collagen and contains triple-helical and carboxyl-terminal non-triple-helical domains similar to those of type X collagen. J. Biol. Chem. 264, 16022–16029 [PubMed] [Google Scholar]
- 19. Muragaki Y., Jacenko O., Apte S., Mattei M. G., Ninomiya Y., Olsen B. R. (1991) The α 2(VIII) collagen gene. A novel member of the short chain collagen family located on the human chromosome 1. J. Biol. Chem. 266, 7721–7727 [PubMed] [Google Scholar]
- 20. Thomas J. T., Cresswell C. J., Rash B., Nicolai H., Jones T., Solomon E., Grant M. E., Boot-Handford R. P. (1991) The human collagen X gene. Complete primary translated sequence and chromosomal localization. Biochem. J. 280, 617–623 [DOI] [PMC free article] [PubMed] [Google Scholar]
- 21. Schäffler A., Buechler C. (2012) CTRP family. Linking immunity to metabolism. Trends Endocrinol. Metab. 23, 194–204 [DOI] [PubMed] [Google Scholar]
- 22. Stevens B., Allen N. J., Vazquez L. E., Howell G. R., Christopherson K. S., Nouri N., Micheva K. D., Mehalow A. K., Huberman A. D., Stafford B., Sher A., Litke A. M., Lambris J. D., Smith S. J., John S. W., Barres B. A. (2007) The classical complement cascade mediates CNS synapse elimination. Cell 131, 1164–1178 [DOI] [PubMed] [Google Scholar]
- 23. Chu Y., Jin X., Parada I., Pesic A., Stevens B., Barres B., Prince D. A. (2010) Enhanced synaptic connectivity and epilepsy in C1q knockout mice. Proc. Natl. Acad. Sci. U.S.A. 107, 7975–7980 [DOI] [PMC free article] [PubMed] [Google Scholar]
- 24. Hirai H., Pang Z., Bao D., Miyazaki T., Li L., Miura E., Parris J., Rong Y., Watanabe M., Yuzaki M., Morgan J. I. (2005) Cbln1 is essential for synaptic integrity and plasticity in the cerebellum. Nat. Neurosci. 8, 1534–1541 [DOI] [PubMed] [Google Scholar]
- 25. Ito-Ishida A., Miura E., Emi K., Matsuda K., Iijima T., Kondo T., Kohda K., Watanabe M., Yuzaki M. (2008) Cbln1 regulates rapid formation and maintenance of excitatory synapses in mature cerebellar Purkinje cells in vitro and in vivo. J. Neurosci. 28, 5920–5930 [DOI] [PMC free article] [PubMed] [Google Scholar]
- 26. Qi Y., Takahashi N., Hileman S. M., Patel H. R., Berg A. H., Pajvani U. B., Scherer P. E., Ahima R. S. (2004) Adiponectin acts in the brain to decrease body weight. Nat. Med. 10, 524–529 [DOI] [PubMed] [Google Scholar]
- 27. Kubota N., Yano W., Kubota T., Yamauchi T., Itoh S., Kumagai H., Kozono H., Takamoto I., Okamoto S., Shiuchi T., Suzuki R., Satoh H., Tsuchida A., Moroi M., Sugi K., Noda T., Ebinuma H., Ueta Y., Kondo T., Araki E., Ezaki O., Nagai R., Tobe K., Terauchi Y., Ueki K., Minokoshi Y., Kadowaki T. (2007) Adiponectin stimulates AMP-activated protein kinase in the hypothalamus and increases food intake. Cell Metab. 6, 55–68 [DOI] [PubMed] [Google Scholar]
- 28. Liu J., Guo M., Zhang D., Cheng S. Y., Liu M., Ding J., Scherer P. E., Liu F., Lu X. Y. (2012) Adiponectin is critical in determining susceptibility to depressive behaviors and has antidepressant-like activity. Proc. Natl. Acad. Sci. U.S.A. 109, 12248–12253 [DOI] [PMC free article] [PubMed] [Google Scholar]
- 29. Byerly M. S., Swanson R., Wei Z., Seldin M. M., McCulloh P. S., Wong G. W. (2013) A central role for C1q/TNF-related protein 13 (CTRP13) in modulating food intake and body weight. PLoS ONE 8, e62862. [DOI] [PMC free article] [PubMed] [Google Scholar]
- 30. Peterson J. M., Aja S., Wei Z., Wong G. W. (2012) C1q/TNF-related protein-1 (CTRP1) enhances fatty acid oxidation via AMPK activation and ACC inhibition. J. Biol. Chem. 287, 1576–1587 [DOI] [PMC free article] [PubMed] [Google Scholar]
- 31. Peterson J. M., Seldin M. M., Wei Z., Aja S., Wong G. W. (2013) CTRP3 attenuates diet-induced hepatic steatosis by regulating triglyceride metabolism. Am. J. Physiol. Gastrointest. Liver Physiol. 305, G214–224 [DOI] [PMC free article] [PubMed] [Google Scholar]
- 32. Peterson J. M., Wei Z., Seldin M. M., Byerly M. S., Aja S., Wong G. W. (2013) CTRP9 transgenic mice are protected from diet-induced obesity and metabolic dysfunction. Am. J. Physiol. Regul. Integr. Comp. Physiol. 305, R522–533 [DOI] [PMC free article] [PubMed] [Google Scholar]
- 33. Peterson J. M., Wei Z., Wong G. W. (2010) C1q/TNF-related protein-3 (CTRP3), a novel adipokine that regulates hepatic glucose output. J. Biol. Chem. 285, 39691–39701 [DOI] [PMC free article] [PubMed] [Google Scholar]
- 34. Seldin M. M., Lei X., Tan S. Y., Stanson K. P., Wei Z., Wong G. W. (2013) Skeletal muscle-derived myonectin activates the mTOR pathway to suppress autophagy in liver. J. Biol. Chem. 288, 36073–36082 [DOI] [PMC free article] [PubMed] [Google Scholar]
- 35. Li Q., Wang L., Tan W., Peng Z., Luo Y., Zhang Y., Zhang G., Na D., Jin P., Shi T., Ma D. (2011) Identification of C1qTNF-related protein 4 as a potential cytokine that stimulates the STAT3 and NF-κB pathways and promotes cell survival in human cancer cells. Cancer Lett. 308, 203–214 [DOI] [PubMed] [Google Scholar]
- 36. Zhu J., Aja S., Kim E. K., Park M. J., Ramamurthy S., Jia J., Hu X., Geng P., Ronnett G. V. (2012) Physiological oxygen level is critical for modeling neuronal metabolism in vitro. J. Neurosci. Res. 90, 422–434 [DOI] [PubMed] [Google Scholar]
- 37. Lin J. W., Biankin A. V., Horb M. E., Ghosh B., Prasad N. B., Yee N. S., Pack M. A., Leach S. D. (2004) Differential requirement for ptf1a in endocrine and exocrine lineages of developing zebrafish pancreas. Dev. Biol. 274, 491–503 [DOI] [PubMed] [Google Scholar]
- 38. Wei Z., Lei X., Seldin M. M., Wong G. W. (2012) Endopeptidase cleavage generates a functionally distinct isoform of C1q/tumor necrosis factor-related protein-12 (CTRP12) with an altered oligomeric state and signaling specificity. J. Biol. Chem. 287, 35804–35814 [DOI] [PMC free article] [PubMed] [Google Scholar]
- 39. Byerly M. S., Al Salayta M., Swanson R. D., Kwon K., Peterson J. M., Wei Z., Aja S., Moran T. H., Blackshaw S., Wong G. W. (2013) Estrogen-related receptor β deletion modulates whole-body energy balance via estrogen-related receptor γ and attenuates neuropeptide Y gene expression. Eur. J. Neurosci. 37, 1033–1047 [DOI] [PMC free article] [PubMed] [Google Scholar]
- 40. Byerly M. S., Swanson R. D., Semsarzadeh N. N., McCulloh P. S., Kwon K., Aja S., Moran T. H., Wong G. W., Blackshaw S. (2013) Identification of hypothalamic neuron-derived neurotrophic factor as a novel factor modulating appetite. Am. J. Physiol. Regul. Integr. Comp. Physiol. 304, R1085–R1095 [DOI] [PMC free article] [PubMed] [Google Scholar]
- 41. Liu L., Duff K. (2008) A technique for serial collection of cerebrospinal fluid from the cisterna magna in mouse. J. Vis. Exp. 21, 960. [DOI] [PMC free article] [PubMed] [Google Scholar]
- 42. Lusk G. (1928) The Elements of the Science of Nutrition, W. B. Saunders Co., Philadelphia [Google Scholar]
- 43. Ruoslahti E. (1996) RGD and other recognition sequences for integrins. Annu. Rev. Cell Dev. Biol. 12, 697–715 [DOI] [PubMed] [Google Scholar]
- 44. Shapiro L., Scherer P. E. (1998) The crystal structure of a complement-1q family protein suggests an evolutionary link to tumor necrosis factor. Curr. Biol. 8, 335–338 [DOI] [PubMed] [Google Scholar]
- 45. Schwartz M. W., Woods S. C., Porte D., Jr., Seeley R. J., Baskin D. G. (2000) Central nervous system control of food intake. Nature 404, 661–671 [DOI] [PubMed] [Google Scholar]
- 46. Passini M. A., Wolfe J. H. (2001) Widespread gene delivery and structure-specific patterns of expression in the brain after intraventricular injections of neonatal mice with an adeno-associated virus vector. J. Virol. 75, 12382–12392 [DOI] [PMC free article] [PubMed] [Google Scholar]
- 47. De Jonghe B. C., Lawler M. P., Horn C. C., Tordoff M. G. (2009) Pica as an adaptive response. Kaolin consumption helps rats recover from chemotherapy-induced illness. Physiol. Behav. 97, 87–90 [DOI] [PMC free article] [PubMed] [Google Scholar]
- 48. Lam T. K., Gutierrez-Juarez R., Pocai A., Rossetti L. (2005) Regulation of blood glucose by hypothalamic pyruvate metabolism. Science 309, 943–947 [DOI] [PubMed] [Google Scholar]
- 49. Obici S., Feng Z., Morgan K., Stein D., Karkanias G., Rossetti L. (2002) Central administration of oleic acid inhibits glucose production and food intake. Diabetes 51, 271–275 [DOI] [PubMed] [Google Scholar]
- 50. Lam T. K., Pocai A., Gutierrez-Juarez R., Obici S., Bryan J., Aguilar-Bryan L., Schwartz G. J., Rossetti L. (2005) Hypothalamic sensing of circulating fatty acids is required for glucose homeostasis. Nat. Med. 11, 320–327 [DOI] [PubMed] [Google Scholar]
- 51. Coll A. P., Farooqi I. S., O'Rahilly S. (2007) The hormonal control of food intake. Cell 129, 251–262 [DOI] [PMC free article] [PubMed] [Google Scholar]
- 52. Friedman J. M., Halaas J. L. (1998) Leptin and the regulation of body weight in mammals. Nature 395, 763–770 [DOI] [PubMed] [Google Scholar]
- 53. Grill H. J., Hayes M. R. (2009) The nucleus tractus solitarius. A portal for visceral afferent signal processing, energy status assessment and integration of their combined effects on food intake. Int. J. Obes. 33, Suppl. 1, S11–S15 [DOI] [PubMed] [Google Scholar]
- 54. Hayes M. R., Leichner T. M., Zhao S., Lee G. S., Chowansky A., Zimmer D., De Jonghe B. C., Kanoski S. E., Grill H. J., Bence K. K. (2011) Intracellular signals mediating the food intake-suppressive effects of hindbrain glucagon-like peptide-1 receptor activation. Cell Metab. 13, 320–330 [DOI] [PMC free article] [PubMed] [Google Scholar]
- 55. Scott M. M., Williams K. W., Rossi J., Lee C. E., Elmquist J. K. (2011) Leptin receptor expression in hindbrain Glp-1 neurons regulates food intake and energy balance in mice. J. Clin. Invest. 121, 2413–2421 [DOI] [PMC free article] [PubMed] [Google Scholar]
- 56. Bjørbaek C., Elmquist J. K., Frantz J. D., Shoelson S. E., Flier J. S. (1998) Identification of SOCS-3 as a potential mediator of central leptin resistance. Mol. Cell 1, 619–625 [DOI] [PubMed] [Google Scholar]
- 57. Myers M. G., Cowley M. A., Münzberg H. (2008) Mechanisms of leptin action and leptin resistance. Annu. Rev. Physiol. 70, 537–556 [DOI] [PubMed] [Google Scholar]
- 58. Decressac M., Barker R. A. (2012) Neuropeptide Y and its role in CNS disease and repair. Exp. Neurol. 238, 265–272 [DOI] [PubMed] [Google Scholar]
- 59. Hansel D. E., Eipper B. A., Ronnett G. V. (2001) Neuropeptide Y functions as a neuroproliferative factor. Nature 410, 940–944 [DOI] [PubMed] [Google Scholar]
- 60. Hofer M., Pagliusi S. R., Hohn A., Leibrock J., Barde Y. A. (1990) Regional distribution of brain-derived neurotrophic factor mRNA in the adult mouse brain. EMBO J. 9, 2459–2464 [DOI] [PMC free article] [PubMed] [Google Scholar]
- 61. Stöckli K. A., Lottspeich F., Sendtner M., Masiakowski P., Carroll P., Götz R., Lindholm D., Thoenen H. (1989) Molecular cloning, expression and regional distribution of rat ciliary neurotrophic factor. Nature 342, 920–923 [DOI] [PubMed] [Google Scholar]
- 62. Huang E. J., Reichardt L. F. (2003) Trk receptors. Roles in neuronal signal transduction. Annu. Rev. Biochem. 72, 609–642 [DOI] [PubMed] [Google Scholar]
- 63. Ip N. Y., Yancopoulos G. D. (1996) The neurotrophins and CNTF. Two families of collaborative neurotrophic factors. Annu. Rev. Neurosci. 19, 491–515 [DOI] [PubMed] [Google Scholar]
- 64. Xu B., Goulding E. H., Zang K., Cepoi D., Cone R. D., Jones K. R., Tecott L. H., Reichardt L. F. (2003) Brain-derived neurotrophic factor regulates energy balance downstream of melanocortin-4 receptor. Nat. Neurosci. 6, 736–742 [DOI] [PMC free article] [PubMed] [Google Scholar]
- 65. Lambert P. D., Anderson K. D., Sleeman M. W., Wong V., Tan J., Hijarunguru A., Corcoran T. L., Murray J. D., Thabet K. E., Yancopoulos G. D., Wiegand S. J. (2001) Ciliary neurotrophic factor activates leptin-like pathways and reduces body fat, without cachexia or rebound weight gain, even in leptin-resistant obesity. Proc. Natl. Acad. Sci. U.S.A. 98, 4652–4657 [DOI] [PMC free article] [PubMed] [Google Scholar]
- 66. Bariohay B., Lebrun B., Moyse E., Jean A. (2005) Brain-derived neurotrophic factor plays a role as an anorexigenic factor in the dorsal vagal complex. Endocrinology 146, 5612–5620 [DOI] [PubMed] [Google Scholar]
- 67. Rios M., Fan G., Fekete C., Kelly J., Bates B., Kuehn R., Lechan R. M., Jaenisch R. (2001) Conditional deletion of brain-derived neurotrophic factor in the postnatal brain leads to obesity and hyperactivity. Mol. Endocrinol. 15, 1748–1757 [DOI] [PubMed] [Google Scholar]
- 68. Dehal P., Satou Y., Campbell R. K., Chapman J., Degnan B., De Tomaso A., Davidson B., Di Gregorio A., Gelpke M., Goodstein D. M., Harafuji N., Hastings K. E., Ho I., Hotta K., Huang W., Kawashima T., Lemaire P., Martinez D., Meinertzhagen I. A., Necula S., Nonaka M., Putnam N., Rash S., Saiga H., Satake M., Terry A., Yamada L., Wang H. G., Awazu S., Azumi K., Boore J., Branno M., Chin-Bow S., DeSantis R., Doyle S., Francino P., Keys D. N., Haga S., Hayashi H., Hino K., Imai K. S., Inaba K., Kano S., Kobayashi K., Kobayashi M., Lee B. I., Makabe K. W., Manohar C., Matassi G., Medina M., Mochizuki Y., Mount S., Morishita T., Miura S., Nakayama A., Nishizaka S., Nomoto H., Ohta F., Oishi K., Rigoutsos I., Sano M., Sasaki A., Sasakura Y., Shoguchi E., Shin-i T., Spagnuolo A., Stainier D., Suzuki M. M., Tassy O., Takatori N., Tokuoka M., Yagi K., Yoshizaki F., Wada S., Zhang C., Hyatt P. D., Larimer F., Detter C., Doggett N., Glavina T., Hawkins T., Richardson P., Lucas S., Kohara Y., Levine M., Satoh N., Rokhsar D. S. (2002) The draft genome of Ciona intestinalis. Insights into chordate and vertebrate origins. Science 298, 2157–2167 [DOI] [PubMed] [Google Scholar]
- 69. Bogin O., Kvansakul M., Rom E., Singer J., Yayon A., Hohenester E. (2002) Insight into Schmid metaphyseal chondrodysplasia from the crystal structure of the collagen X NC1 domain trimer. Structure 10, 165–173 [DOI] [PubMed] [Google Scholar]
- 70. Gaboriaud C., Juanhuix J., Gruez A., Lacroix M., Darnault C., Pignol D., Verger D., Fontecilla-Camps J. C., Arlaud G. J. (2003) The crystal structure of the globular head of complement protein C1q provides a basis for its versatile recognition properties. J. Biol. Chem. 278, 46974–46982 [DOI] [PubMed] [Google Scholar]
- 71. Kvansakul M., Bogin O., Hohenester E., Yayon A. (2003) Crystal structure of the collagen α1(VIII) NC1 trimer. Matrix Biol. 22, 145–152 [DOI] [PubMed] [Google Scholar]
- 72. Tu X., Palczewski K. (2012) Crystal structure of the globular domain of C1QTNF5. Implications for late-onset retinal macular degeneration. J. Struct. Biol. 180, 439–446 [DOI] [PMC free article] [PubMed] [Google Scholar]
- 73. Larkin M. A., Blackshields G., Brown N. P., Chenna R., McGettigan P. A., McWilliam H., Valentin F., Wallace I. M., Wilm A., Lopez R., Thompson J. D., Gibson T. J., Higgins D. G. (2007) Clustal W and Clustal X version 2.0. Bioinformatics 23, 2947–2948 [DOI] [PubMed] [Google Scholar]