

Background: The serotonin transporter (SERT) terminates synaptic signaling by reuptake of the neurotransmitter serotonin.
Results: Interaction kinetics and number of subunits are elucidated by single molecule brightness analysis of SERT complexes.
Conclusion: The oligomeric state of SERT complexes is stably determined before being integrated into the plasma membrane.
Significance: The results reveal the first evidence for kinetic trapping of preformed neurotransmitter transporter oligomers.
Keywords: Membrane Proteins, Protein Dynamics, Protein-Protein Interactions, Serotonin Transporters, Single Molecule Biophysics, Oligomerization
Abstract
The human serotonin transporter (hSERT) is responsible for the termination of synaptic serotonergic signaling. Although there is solid evidence that SERT forms oligomeric complexes, the exact stoichiometry of the complexes and the fractions of different coexisting oligomeric states still remain enigmatic. Here we used single molecule fluorescence microscopy to obtain the oligomerization state of the SERT via brightness analysis of single diffraction-limited fluorescent spots. Heterologously expressed SERT was labeled either with the fluorescent inhibitor JHC 1-64 or via fusion to monomeric GFP. We found a variety of oligomerization states of membrane-associated transporters, revealing molecular associations larger than dimers and demonstrating the coexistence of different degrees of oligomerization in a single cell; the data are in agreement with a linear aggregation model. Furthermore, oligomerization was found to be independent of SERT surface density, and oligomers remained stable over several minutes in the live cell plasma membrane. Together, the results indicate kinetic trapping of preformed SERT oligomers at the plasma membrane.
Introduction
The human serotonin transporter (SERT)3 is an integral membrane protein endogenously expressed in serotonergic neurons of the raphe nuclei in the human brain. SERT mediates rapid clearance of the neurotransmitter serotonin (5-HT) from the synaptic cleft. Thereby, SERT terminates the chemical signal transduction in serotonergic neurons and replenishes the internal 5-HT levels for the next signaling event (1). SERT belongs to the closely related neurotransmitter:sodium symporter (NSS) or solute carrier 6 (SLC6) family (2); other members of the family include transporters of monoamines like norepinephrine and dopamine (DAT) or amino acids like γ-amino acid (GAT1–4) or glycine (GLYT1–2), as well as transporters of osmolytes and other unknown substances (3).
An increasing body of evidence shows that neurotransmitter transporters form higher oligomeric structures in the cell membrane (4). The homoassociation of more than one transporter molecule of the NSS family has been shown by biochemical approaches such as co-immunoprecipitation of differently epitope-tagged SERT and DAT constructs (5), oxidative cross-linking of SERT (6) and DAT (7, 8) and also by optical measurements like Förster resonance energy transfer (FRET) for DAT (9, 10), GAT1 and SERT (11–13), and GLYT (14).
Uptake experiments on oligomerization-deficient GAT1 mutants revealed monomers as the functional units (15). Uncoupling of transport activity and quaternary structure has further been proven for various other transporter proteins being present as oligomers, like lactose permease (16), members of the Na+/H+-exchanger family (17), or the Na+/Pi− co-transporter (18). However, functionally important cooperativity between subunits within SERT oligomers has been observed by Kilic and Rudnick (5), indicating a functional relevance of SERT oligomerization.
Interestingly, Scholze et al. (15) found that mutational exchange of a leucine motif, which was previously suggested to support oligomer formation in GAT1, leads to incapability of oligomerization as well as retention in the endoplasmic reticulum. This finding indicates the involvement of oligomerization to pass the rigid control of the endoplasmic reticulum, suggesting a possible function of oligomerization. The actual composition of the complexes and the mechanisms mediating the interaction, however, are not understood.
Most of the currently available information was obtained by in vitro bulk experiments. Although the mentioned studies have provided an important contribution to obtain a deeper understanding of the oligomerization of NSSs, these methods cannot determine the exact stoichiometry of the complexes, the distribution of different oligomeric states, and its interaction kinetics. Here we used a single molecule approach based on brightness analysis of diffraction-limited spots (19–22) to unravel the subunit stoichiometry of fluorescently labeled SERT in the native plasma membrane of living HEK 293 cells. The method was already successfully applied to the analysis of various membrane proteins including lipid-anchored GFP (21), the calcium channel Orai1 (19), and the Src family kinase Lck (23). In this study, we observed higher oligomeric structures of SERT in the plasma membrane, exhibiting a variety of configurations ranging from monomers to at least pentamers that coexist in the same cell. The data are in agreement with a linear aggregation model of membrane proteins. Furthermore, using a novel photobleaching protocol, we found that the formed complexes are stable on the minute time scale, indicating kinetic trapping of preformed oligomers.
EXPERIMENTAL PROCEDURES
SERT Constructs
Mutagenesis of Enhanced GFP to mGFP (24) was performed by the mutation A206K using the QuikChange Mutagenesis kit (Stratagene) in a peGFP-C1 vector (Clontech) with the forward primer 5′-TAC CTG AGC ACC CAG TCC AAA CTG AGC AAA GAC CCC AAC-3′ and the reverse primer 5′-GTT GGG GTC TTT GCT CAG TTT GGA CTG GGT GCT CAG GTA-3′. A HindIII/XbaI fragment of SERT cDNA was ligated into HindIII/XbaI-digested mGFP-C1 to produce SERT-mGFP-C1 (11). For inducible expression of wild-type SERT, SERT cDNA was cloned into the pcDNA4-TO (T-REx; Invitrogen) vector, and stably transfected cell lines (hS4TO) were established as described by Hilber et al. (25).
Cell Culture
For transient transfections with mGFP-SERT we used HEK 293 cells. Cells were cultured at 37 °C and 5% CO2 in Dulbecco's modified Eagle's medium (DMEM; PAA Laboratories) supplemented with 10% FBS (Invitrogen) and penicillin/streptomycin. Functional expression of the mGFP-SERT was tested by uptake experiments essentially performed as described (26). In brief, for the determination of nonspecific uptake by mGFP-SERT, we used 10 μm paroxetine (preincubation time 5 min), and [3H]5-HT (0.15 μm; PerkinElmer Life Sciences) was added for 1 min. Prior to the experiment, the cells were washed once in uptake buffer (containing 25 mm HEPES, 120 mm NaCl, 5 mm KCl, 1.2 mm CaCl2, and 1.2 mm MgSO4 supplemented with 5 mm d-glucose) and equilibrated in uptake buffer for 30 min before starting the assay. For assays determining concentration-dependent uptake, the specific activity of the substrate [3H]5-HT was diluted to cover a concentration range of 0.15 μm (specific activity ≈50 cpm/fmol) to 30 μm (≈250 cpm/pmol). After incubation for 1 min at room temperature in 0.1 ml, cells were washed in ice-cold uptake buffer and the remaining radioactivity determined by liquid scintillation counting. The resulting uptake values were 238 ± 81 pmol/min/106 cells (mGFP-SERT; n = 4) versus 244 ± 23 pmol/min/106 cells (wild-type SERT; n = 4; no statistical significant difference as revealed by Student's t test). Thus, these results provide evidence that the tagging with mGFP of the N-terminal domain of the SERT did not hamper its functional properties, similar to the tagging with cyan fluorescent protein and YFP (11).
In addition, we used a HEK 293 cell line stably transfected with the inducible expression system T-REx carrying wild-type SERT in the expression vector (Invitrogen); the cells are termed hS4TO and were kindly provided by Marion Holy. The hS4TO cells were cultured at 37 °C and 5% CO2 in DMEM (PAA Laboratories) supplemented with 10% FBS (Sigma-Aldrich), penicillin/streptomycin (PAA Laboratories), blasticidin (6 μg/ml) (Invitrogen), and zeocin (300 μg/ml) (Invitrogen) according to the manufacturers' protocols.
Sample Preparation
For imaging, the cells were transferred to 30-mm, 1# thickness glass coverslips (Thermo Scientific) in 35-mm dishes 2 days before the experiments and grown to 50–80% confluence. To ensure sufficient attachment of the cells, glass slides were precoated with fibronectin (Invitrogen) as follows: slides were cleaned in 70% ethanol supplemented with 2% hydrochloric acid for 15 min and washed three times for 5 min in dH2O. 90 μl of fibronectin (50 μg/ml in 1×PBS) was uniformly distributed on the glass and dried at 50 °C. The coated glass slides were then washed three times with 1×PBS (PAA Laboratories) prior to use.
For JHC 1-64 labeling, expression of SERT in hS4TO cells was induced with tetracycline according to the manufacturer's instructions. 4–6 h after induction of expression the glass slides were transferred to customized mounting chambers. SERT was labeled using 20 nm JHC 1-64 in 1×PBS with an incubation time of 20 min at room temperature; incubation with 100 nm JHC 1-64 yielded similar results, indicating that the applied concentration was sufficient to saturate the binding. After five wash steps with prewarmed PBS, Hanks' buffered salt solution (PAA Laboratories) supplemented with 2% FCS was used as imaging buffer.
For imaging of mGFP-SERT, HEK 293 cells were transiently transfected with the FuGENE 6 transfection kit (Promega) according to the manufacturer's instructions using 1 μg of DNA/35-mm dish. For experiments which required a low expression level the expression vector containing mGFP-SERT was diluted 1:100 with pBluescript SK− (Agilent Technologies) for subsequent transfection, and live cell imaging was performed after 12–20 h.
Cholesterol Depletion
To disturb the lipid environment in the plasma membrane, the cells were incubated with 2 units/ml cholesterol oxidase (Invitrogen) in Hanks' buffered salt solution for 30 min at 37 °C.
Microscopy
A 488 nm (SAPPHIRE HP, Coherent Inc.) and a 532-nm laser (Millennia X; Spectra Physics) were used for excitation of mGFP constructs and JHC 1-64, respectively. Both laser lines were mode-cleaned using a pinhole. Intensity modulation and timing for the 488 nm and 532 nm was controlled with an acousto-optical modulator (model 1205; Isomet) via a custom-written software (Labview; National Instruments, Austin, TX). The beam was then focused onto the back-focal plane of a total internal reflection (TIR) fluorescence objective (NA 1.46, 100× α Plan APOCHROMAT; Zeiss) mounted on an inverted Zeiss Axiovert 200 microscope. Emission light was filtered using appropriate filter sets for GFP and Cy3 (for JHC 1-64 labeling). The emission light was imaged with a back-illuminated EM-CCD camera (IXON DU 897-DV; Andor). An adjustable slit aperture (Zeiss) was used as field stop to confine the illumination and photobleaching area.
The microscope was equipped with a temperature control system (POCmini; Zeiss) and an objective heater (Objective Heater System; Bioptech Inc.). All single molecule fluorescence experiments were performed at 37 °C. For imaging, samples were illuminated in objective-type TIR configuration at an excitation power of 0.8 kW/cm2. Illumination times for image acquisition were 5 ms for JHC 1-64 imaging and 10 ms for mGFP imaging.
Thinning out clusters while conserving stoichiometry of labeling (TOCCSL) (27) was performed as follows (see Fig. 2, A and B). First, a prebleach image was recorded in TIR configuration using the respective illumination time for the used fluorophore (ii in Fig. 2B); next, a distinct region of the cell membrane was photobleached for 600–800 ms in epiconfiguration (1); to check for sufficient bleaching, a postbleach image was recorded in TIR configuration 40 ms after the bleach pulse (iii); finally, the TOCCSL image was recorded in TIR configuration after a recovery time of 1500–3000 ms (iv), which was used for single fluorescent spot analysis. Samples were excited at low power for imaging (0.8 kW/cm2) and at high power for photobleaching (5 kW/cm2; excitation intensities are specified for epiconfiguration). The illumination mode was rapidly switched between TIR and epi by shifting a mirror via a piezo stage (M-663; Physik Instrumente GmbH).
FIGURE 2.

Experimental strategy. A and B principle of the TOCCSL method. Ai, overlay of a white light image and the fluorescence image of a HEK 293 cell expressing mGFP-SERT. Using a field stop in the laser beam pathway, a region of interest (indicated by the dashed square) is chosen for the subsequent TOCCSL sequence. B, corresponding illumination protocol. Imaging was performed at low excitation power (∼0.8 kW/cm2) with an illumination time of 10 ms (for mGFP-SERT) or 5 ms (for JHC 1-64), whereas the bleach pulses 1 and 3 were performed at high excitation power (∼5 kW/cm2). After a prebleach image (ii) the region of interest was completely photobleached (laser pulse 1) at high excitation power for 800 ms. Sufficient bleaching was controlled by an image (iii) recorded immediately after laser pulse 1. During the recovery phase 2 (1500–3000 ms) unbleached SERT complexes enter the photobleached area by Brownian motion. In the image recorded after the recovery period (iv), single fluorescent complexes can now be distinguished as well separated diffraction-limited spots. To obtain the brightness of a single fluorophore, the complexes were bleached (bleach pulse 3, 100 ms) at high laser power followed by recording of an image. The shorter bleach pulse resulted in only partial bleaching of the complexes so that only single fluorescent dyes were left in each complex. C, obtained brightness distribution of the oligomeric fractions recorded in image iv plotted as probability density function (black line). The fit is shown as a dashed red line, the N-mer contributions as blue lines. D, normalized distribution of oligomeric states αN (black bars). The gray bars show the distribution after correcting for nonfluorescent mGFP-SERT, assuming a fluorescent fraction of 90%. The error bars indicate the values estimated for 80 and 100% active mGFP-molecules.
Single Molecule Analysis
Camera pixel counts were converted to photons by subtracting the constant offset and multiplying with the inverse gain according to the camera specifications. The raw data were processed by smoothing, nonmaximum suppression, and thresholding to determine the locations of bright spots. Selected regions of interest were fitted by a pixelized Gaussian function and a homogeneous background with a maximum likelihood estimator for Poisson distributed data using a freely available, fast GPU fitting routine (28) on a GeForce GT 550 Ti (Nvidia).
Single molecule localizations were linked by minimizing the total displacement between successive frames as described by Gao et al. (29). The diffusion coefficient was determined by fitting the first two points of the mean square displacement versus time lag plot (30) (Fig. 1B). All analysis was done using custom-written scripts in Matlab (MathWorks).
FIGURE 1.
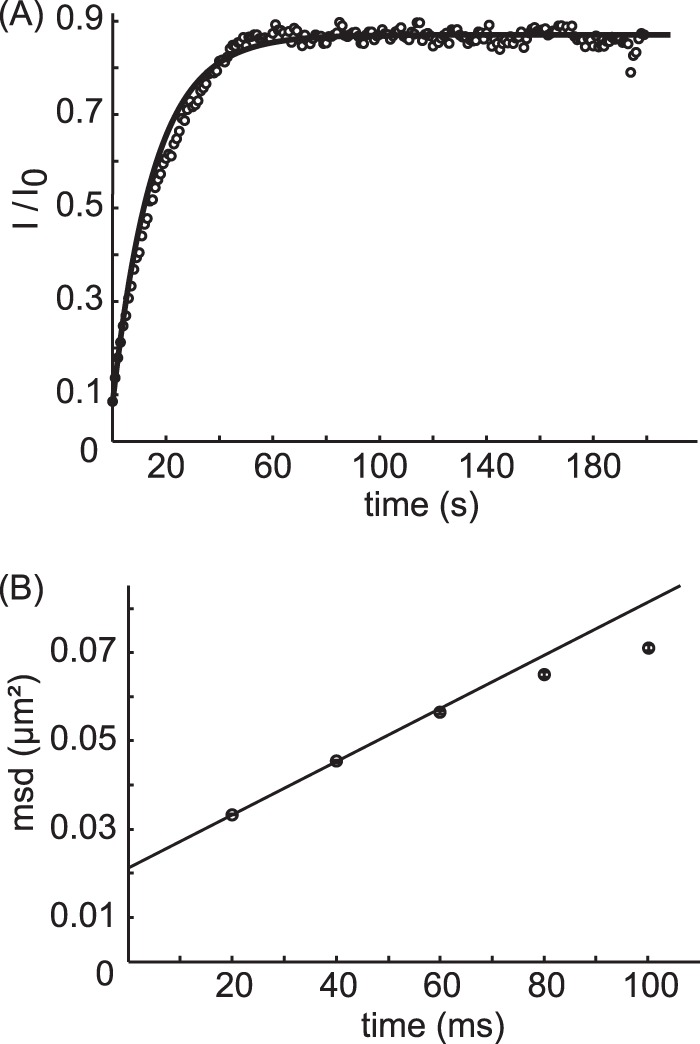
Mobility of SERT. A, to determine the mobile fraction of SERT, a fluorescence recovery after photobleaching experiment was performed on cells expressing mGFP-SERT. The integrated intensity of the bleached area (I) was normalized to the fluorescence intensity before bleaching (I0) and plotted over time (gray circles, showing a representative recovery curve). The fit yielded a mean mobile fraction of m = 82 ± 8% (n = 7). B, using single molecule tracking, the diffusion coefficient D was determined. Mean square displacements were calculated for a range of time lags (t lag), and D was determined from the first two points in the mean square displacement (msd) plot according to MSD = 4Dtlag + offset, yielding D = 0.151 ± 0.003 μm2/s.
The localization algorithms also yielded values for the single spot brightness B, which we used to determine the oligomeric state of the observed membrane protein, as described previously (21, 22, 27). Briefly, the observed single spot brightness was plotted as a probability density function ρ(B). Partial bleaching of the SERT complexes after the actual experiments was performed to determine the brightness distribution of SERT carrying a single active label (“monomers”) ρ1(B); to lower the probability of taking more than one active fluorophore per spot into account, only images were chosen where single complexes were entirely bleached in the next frame, indicating a single fluorophore bleaching event of the complex. By convolution, the monomer brightness distribution was used to calculate the expected brightness distributions for dimers ρ2(B), trimers ρ3(B), etc. Finally, the overall single spot brightness distribution was fitted by a linear combination of the N-mer contributions,
 |
yielding the fractions αN of different oligomeric states of SERT in the cell membrane, with N the number of subunits.
Stepwise Photobleaching
A stepwise bleaching approach was performed (31, 32) on hS4TO cells showing a low expression level of SERT. After labeling with 20 nm JHC 1-64 the cells were fixed with 4% paraformaldehyde (Electron Microscopy Sciences) for 10 min at 37 °C. 50 mm ammonium chloride (Roth) was used to stop fixation and suppress autofluorescence. A reducing oxidizing system buffer was used to maximize fluorescence and reduce photoblinking (33, 34). Movies of 1000 frames with an illumination time of 30 ms were acquired. The data were fitted using custom-written software in Labview. Smoothing, nonmaximum suppression, and thresholding identified the locations of bright spots. A 9 × 9-pixel region around each peak was averaged, and the averaged 2-pixel-wide outside frame was subtracted to correct for background throughout the measurement. Intensity versus time was plotted, and bleaching steps were identified manually (31, 35).
Fluorescence Recovery after Photobleaching
An ∼8 × 8-μm2 area of the bottom cell membrane densely covered with mGFP-SERT was irreversibly photobleached, and the fluorescence recovery over time was monitored. Photobleaching and readout were performed in TIR configuration. The data were analyzed using in-house algorithms implemented in Matlab. For analysis of the mobile fraction, the central part of the bleached region was evaluated by integrating all counts and normalizing to the prebleach image. The curve was fitted with
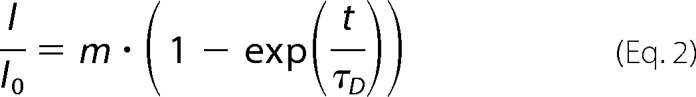 |
yielding the mobile fraction α of SERT (Fig. 1A).
Aggregation Model
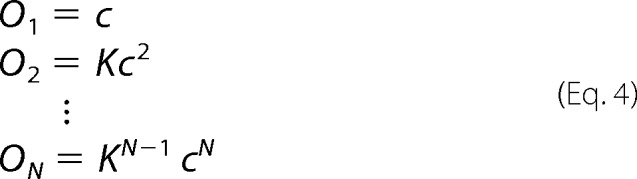
We modeled the observed SERT distributions by a linear aggregation model, in which the addition of every new subunit follows identical binding kinetics.
ON denotes the surface density of oligomers consisting of N monomers, and c denotes the surface density of monomers. In this model, each binding equilibrium is characterized by the same binding constant K = ON+1/(ON · c), yielding
 |
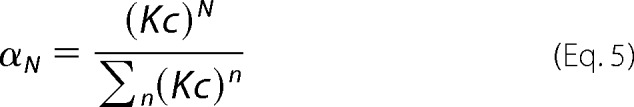
The oligomer distribution is then given by
 |
RESULTS
We first evaluated the subunit stoichiometry of an mGFP-SERT fusion construct heterologously expressed in HEK 293 cells. The protein showed considerable mobility in the plasma membrane: fluorescence recovery after photobleaching yielded a mobile fraction of 82 ± 8%, and single molecule tracking a lateral mobility of D = 0.151 ± 0.003 μm2/s (Fig. 1). High expression levels of mGFP-SERT, however, precluded direct single molecule brightness analysis of the transporter due to strongly overlapping signals. We hence applied a photobleaching protocol termed TOCCSL (27) to virtually dilute the number of fluorescently labeled complexes co-diffusing in a given membrane area. The idea is sketched in Fig. 2A and B: a part of a given cell was irreversibly photobleached with high laser power; subsequently, an image was recorded at the onset of the fluorescence recovery process, where the first complexes can be observed to enter the photobleached region as well separated diffraction-limited spots. The use of a rather short laser pulse and a field stop for bleaching ensured that complexes are either switched off or remain fluorescent, so that the brightness of the observed spots correctly encodes the corresponding oligomeric state.
Fig. 2C shows the brightness distribution obtained in the TOCCSL images. A pronounced tail toward higher brightness values compared with the monomer distribution clearly indicates the presence of oligomeric SERT complexes co-diffusing in the membrane. The fit yields higher oligomeric structures at least up to pentamers (Fig. 2D). It has been reported, however, that only ∼90% of the GFP molecules in a cell are fluorescent (19, 31). To account for this inactive form of mGFP we corrected the obtained contributions αN using a binomial distribution assuming the fluorescent fraction of mGFP to range between 80 and 100%. The gray bars in Fig. 2D show the distribution for 90% mGFP maturation; the error bars indicate the values for 80 and 100%, respectively.
For control, we also analyzed SERT labeled with the external high affinity label JHC 1-64, a rhodamine red-conjugated cocaine analog (36). JHC 1-64 has proven to be a potent label for SERT: it shows a very slow off-rate of <0.01/min (26) and cannot pass the lipid bilayer of living cells (37). Even more importantly for single molecule analysis, it is sufficiently bright for imaging at a good signal-to-noise-ratio, and it contains exactly one dye molecule. Hence, the stoichiometry of the SERT complexes can again be deduced from the number of co-localized fluorophores by brightness analysis. We performed TOCCSL experiments on HEK 293 cells stably transfected with wild-type SERT (hS4TO cells), yielding a similar distribution compared with mGFP-SERT (Fig. 3A). Together, both labeling strategies reveal higher oligomeric structures at least up to pentamers, and different degrees of oligomerization coexist in the same cell. The data further show that application of the cocaine derivate JHC 1-64 has no influence on the oligomeric state of SERT. In agreement with our results, Schmid et al. have previously observed that various substrates and blockers (including cocaine and 5-HT) did not alter FRET ratios of YFP- and cyan fluorescent protein-tagged SERT simultaneously expressed in HEK 293 cells, hence, did not change the oligomeric state (11).
FIGURE 3.
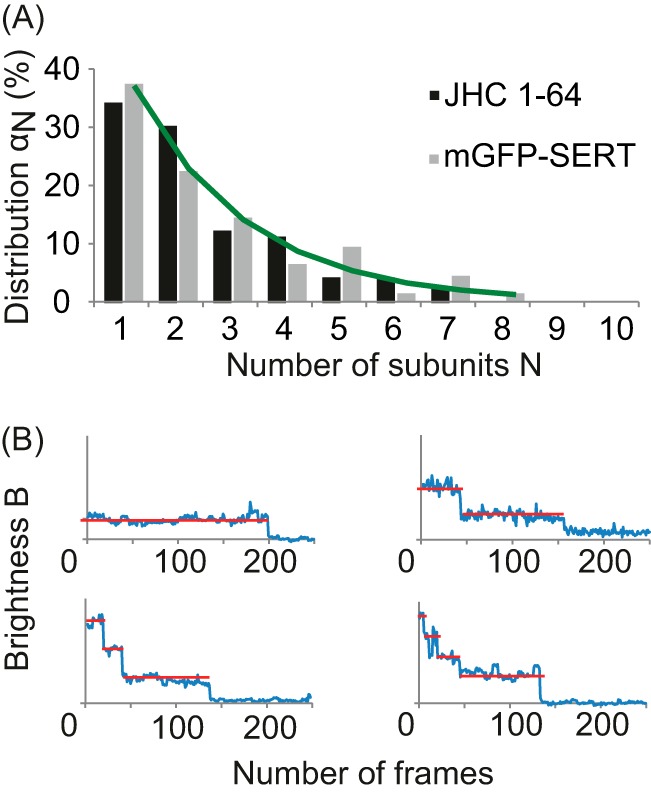
The fluorescent cocaine analog JHC 1-64 was used as an external label for SERT-expressing hS4TO cells. The brightness distribution of the labeled complexes was evaluated as described for mGFP-SERT. A, comparison of oligomeric states of SERT labeled with JHC 1-64 (black bars) and mGFP-SERT (gray bar) is shown. No substantial difference was found using the two labeling methods. Data were fitted with a linear aggregation model (green line), yielding Kc = 0.62. B, to further confirm the presence of higher oligomeric structures a stepwise bleaching approach was performed on JHC 1-64-labeled SERT fixed with paraformaldehyde. Exemplary bleach traces are shown for a monomer (top left), dimer (top right), trimer (bottom left), and tetramer (bottom right). The red lines indicate the photobleaching plateaus.
To further confirm the presence of higher oligomeric structures obtained by brightness analysis, a stepwise bleaching approach of JHC 1-64-labeled SERT in paraformaldehyde-fixed hS4TO cells was performed. Due to the quantal nature of the fluorescence emission of a single dye the bleaching of a molecule occurs in a stepwise manner. Each distinct step in the fluorescence intensity trace of a single transporter complex represents one photobleaching event of a single dye molecule. This approach, however, can only be applied to immobilized molecules (31); we therefore fixed the cells before imaging. The bleach traces clearly indicated the coexistence of different degrees of SERT oligomerization (Fig. 3B).
Magnani et al. have found that plasma membrane cholesterol is necessary for proper uptake activity of SERT (38). Because the presence of cholesterol has also been found to be important for the oligomerization of various membrane proteins (39, 40), we wondered whether cholesterol also has an effect on the distribution of oligomeric states of SERT. Upon depletion of plasma membrane cholesterol via cholesterol oxidase, however, the distribution of the complexes was not altered (Fig. 4A).
FIGURE 4.
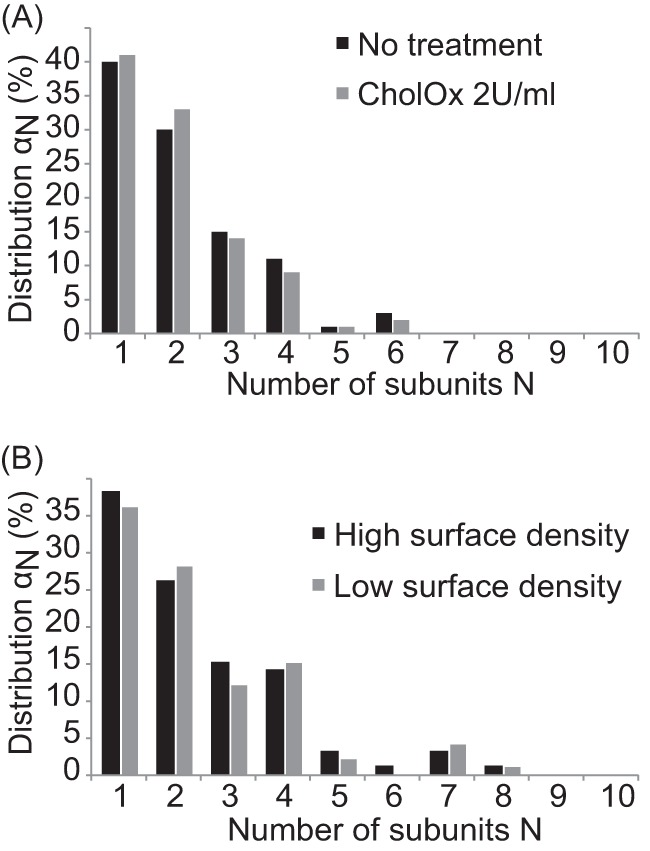
A, comparison of the oligomeric SERT distributions in the unaltered lipid environment of the plasma membrane (black bars) and after cholesterol depletion with cholesterol oxidase (2 units/ml for 30 min) is shown. No apparent influence of the cholesterol content is observable. B, surface density has no effect on the oligomeric state of SERT. The comparison of the two populations, high (black) and low surface density (gray) shows no difference in oligomerization. The mean density of SERT was evaluated by dividing the integrated fluorescent intensity of the cell membrane by the mean intensity of a monomer, yielding a mean density of ∼29 mGFP-SERT/μm2 for low surface density and ∼840 mGFP-SERT/μm2 for high surface density.
In contrast to many ion channels (19, 31), the obtained oligomer distribution of SERT shows no characteristic peak and thus no preference for a particular cluster size. It is reminiscent, however, of complexes of G protein-coupled receptors, which show a dynamic equilibrium between different oligomeric states in the plasma membrane (20). We analyzed our data with a linear aggregation model, in which the addition of every new SERT subunit to an existing complex follows identical binding kinetics. Indeed, the model fits very well to the recorded distribution (Fig. 3A, green line), with αN+1/αN = Kc = 0.62. In other words, equilibria are adjusted such that the dissociation of a monomer from a complex is preferential compared with the association of a new monomer.
Next, we were interested whether the process of oligomer formation is equilibrated at the plasma membrane, as observed recently for the oligomerization of G protein-coupled receptors at the cell surface (20). In this case, higher surface density of SERT would drive the equilibrium toward higher oligomeric structures and vice versa. Here, we directly compared HEK 293 cells showing a low surface density of mGFP-SERT at the plasma membrane with cells exhibiting a 29-fold higher surface density. Interestingly, we found identical distributions of oligomeric states (Fig. 4B). This means that SERT oligomer formation and dissociation are not a continuous process at the membrane.
Two scenarios may rationalize the independence of the SERT oligomeric state on the surface density: (i) Regulation of the oligomer distribution via cytosolic recycling pathways; in that case, a steady state at the membrane would be maintained by local equilibration together with the uptake/delivery of specific oligomeric states. (ii) Kinetic trapping of SERT oligomers at the plasma membrane: in that case, equilibration would be accomplished in cytosolic compartments. Upon reaching the plasma membrane SERT oligomers would remain stably associated. The two models can be experimentally discriminated by measuring the interaction kinetics. In the first model, monomers would rapidly exchange, whereas in the second model, no such exchange ought to be seen. We set out to analyze the interaction kinetics within a SERT oligomer by designing a special bleaching protocol in conjunction with brightness analysis (Fig. 5A). We performed one TOCCSL experiment/min over 10 min on the same cell and monitored the distribution of oligomeric states over time; this illumination sequence reduced the average fluorescence intensity of the cells finally to ∼50%. An exchange of subunits between different complexes would lead to a shift toward smaller structures due to mixing of bleached and nonbleached subunits. We estimated the effect of rapid exchange kinetics with a complete rearrangement of bleached and unbleached subunits after 10 min. Compared with the initial situation (black bars), a substantial shift of the oligomer distribution αN toward monomers would be expected (white bars). In contrast, we did not observe any change in the distribution (gray bars). Our findings thus reveal that there is no exchange of subunits between different complexes over the measured time scales. We conclude that the interaction of the transporters is stable at least for the duration of 10 min.
FIGURE 5.
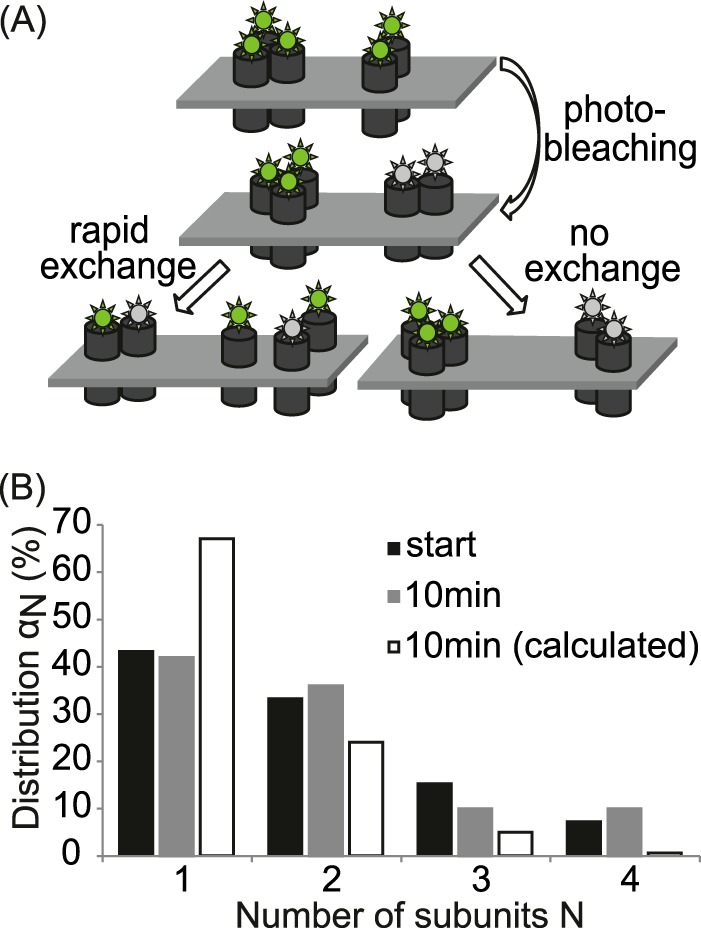
To evaluate the stability of the SERT complexes, 50% of the transporter complexes in a cell were stoichiometrically photobleached using a sequence of 10 TOCCSL experiments, then, the oligomeric distribution was monitored over 10 min. A, sketch showing the behavior of oligomeric structures after stoichiometric photobleaching. A transient interaction of SERT would lead to a rearrangement after photobleaching, resulting in a mixed population of bleached (gray) and unbleached (green) molecules per oligomer; in this case, the number of unbleached dyes per oligomer would be reduced (left). In contrast, stable interaction produces either completely bleached or unbleached oligomers, without effect on the distribution (right). B, oligomer distribution αN at the start of the experiment (black bars) and after 10 consecutive TOCCSL experiments performed every minute (gray bars). No change in the oligomeric distribution was observed. The white bars show the expected binomial distribution if the interaction kinetics of the subunits would be fast compared with the time of our experiment.
DISCUSSION
Using single molecule brightness analysis, we have unraveled the oligomeric state of SERT in the plasma membrane of living HEK 293 cells. We have shown that SERT forms higher oligomeric structures at least up to pentamers, and we quantified different degrees of oligomerization coexisting in the plasma membrane.
The observed distribution can be rationalized by a linear aggregation model, in which the addition of every new subunit follows identical binding kinetics. A consequence of equilibration, however, would be a strong dependence of the oligomer distribution on the surface density of proteins: higher concentrations would shift the distribution toward higher oligomeric structures. Interestingly, this is what we did not observe. Even more so, we did not observe any subunit exchange of the oligomers at the plasma membrane. Apparently, SERT oligomers remain stably associated and are thus kinetically trapped in a thermodynamically not-equilibrated state.
The principle that underlies the interaction of the subunits remains enigmatic to date. A dependence of the uptake activity on the presence of cholesterol has been shown by Magnani et al. (38). It may well be that the oligomerization is not directly based on protein-protein interaction but rather on an indirect clustering due to the local lipid environment, as was shown for glycosylphosphatidylinositol-anchored proteins (21, 40). Although we cannot rule out an influence of other lipid components in the plasma membrane, our results show that disturbance of lipid rafts by cholesterol depletion has no impact on the oligomeric state of SERT.
The data suggest a rather unexpected regulation mechanism for oligomerization. It has previously been shown that the NSS already oligomerizes in the endoplasmic reticulum (9, 15) and has a crucial effect on the trafficking of SERT; the ability of NSSs for oligomerization is necessary to pass the rigid control system of the endoplasmic reticulum to be transported to the plasma membrane (41), in the case of SERT specifically by allowing interaction with components of the Sec24C family (42). This would suggest that only complexes being present at least as dimers can be trafficked to the plasma membrane. In contrast, we found a large fraction of the transporters present as monomers in the membrane. However, in our opinion this is not in conflict with the work of Farhan et al. (41) and Sucic et al. (42); only a subfraction of higher oligomeric states is necessary to induce budding of the vesicles. Monomeric transporters could then still be integrated into the budding vesicle as hitch-hikers if they happen to be in close proximity to the oligomeric complexes.
Our results agree with the recent literature, which shows oligomerization for essentially all NSSs. Upon gel filtration in detergent solution and emission fluorescence spectroscopy of cell extracts containing fluorescently labeled SERT, Schmid et al. have previously shown complexation of SERT corresponding to oligomeric structures higher than dimers (11). Interestingly, in this study no monomeric fraction was observed. It has to be noted, however, that the interaction of transporter subunits was measured in solution here, thereby not taking the influence of the native membrane environment into account. This could result in clustering of monomers to a quaternary structure that is more stable in the detergent solution. Moreover, our finding of oligomeric states is consistent with the results obtained by Hastrup et al. using chemical cross-linking for the very closely related DAT (8).
The interface that mediates the oligomerization of NSS has repeatedly been discussed in the past. Several motifs have been suggested, e.g. a leucine repeat that was found in DAT (43) and GAT1 (15) or a GXXXG motif found in various NSSs (4). However, the leucine motif is incomplete in SERT (44). Additionally, for SERT there seems to be another interaction site between transmembranes 11 and 12 present (13).
The bacterial NSS homolog LeuTAa has been crystallized as a dimer (45). In addition, the glutamate transporter was unraveled as a trimer, both the bacterial homolog GltPh (46) and the mammalian EAAT3 (47, 48). The most recently published crystal structure of the Drosophila DAT, however, has been shown to be exclusively monomeric (49). Importantly, the authors mentioned the potential impact of the membrane environment that might be crucial for the oligomerization. Furthermore, no NSS of any insect origin has so far been examined regarding oligomerization, especially in its natural habitat. Our findings implicate that the size of a given complex is defined before it actually reaches the plasma membrane. It may well be that the distribution of oligomeric states is defined by an unknown mechanism in the ER or the Golgi apparatus, where the membrane environment, both lipids and proteins, differs substantially from the plasma membrane and may thus very well lead to different binding conditions (50).
Despite the observed stability of the complexes expressed in artificial cell lines, there may well be other components of a regulatory machinery present in neurons that give the cells an opportunity to actively regulate the composition of SERT complexes integrated in the membrane. Therefore, further examination of the herein determined factors on endogenously expressed SERT will be of obvious importance.
Acknowledgments
We thank Martin Fölser for assistance in computational analysis, Marion Holy for constructs and cell lines, Elena Parkinson for cell culture assistance, and Mu-Fa Zou for synthesizing JHC 1-064.
This work was supported by the Austrian Science Fund/FWF Projects F3506-B20 (to H. H. S.) and F3519-B20 (to G. J. S.) and by the National Institute on Drug Abuse-Intramural Research Program (to A. H. N.).
- SERT
- serotonin transporter
- DAT
- dopamine transporter
- GAT
- γ-aminobutyric acid transporter
- GLYT
- glycine transporter
- 5-HT
- 5-hydroxytryptamine (serotonin)
- mGFP
- monomeric GFP
- NSS
- neurotransmitter:sodium symporter
- TIR
- total internal reflection
- TOCCSL
- thinning out clusters while conserving stoichiometry of labeling.
REFERENCES
- 1. Amara S. G., Kuhar M. J. (1993) Neurotransmitter transporters: recent progress. Annu. Rev. Neurosci. 16, 73–93 [DOI] [PubMed] [Google Scholar]
- 2. Saier M. H., Jr., Tran C. V., Barabote R. D. (2006) TCDB: the Transporter Classification Database for membrane transport protein analyses and information. Nucleic Acids Res. 34, D181–186 [DOI] [PMC free article] [PubMed] [Google Scholar]
- 3. Masson J., Sagné C., Hamon M., El Mestikawy S. (1999) Neurotransmitter transporters in the central nervous system. Pharmacol. Rev. 51, 439–464 [PubMed] [Google Scholar]
- 4. Sitte H. H., Farhan H., Javitch J. A. (2004) Sodium-dependent neurotransmitter transporters: oligomerization as a determinant of transporter function and trafficking. Mol. Interv. 4, 38–47 [DOI] [PubMed] [Google Scholar]
- 5. Kilic F., Rudnick G. (2000) Oligomerization of serotonin transporter and its functional consequences. Proc. Natl. Acad. Sci. U.S.A. 97, 3106–3111 [DOI] [PMC free article] [PubMed] [Google Scholar]
- 6. Jess U., Betz H., Schloss P. (1996) The membrane-bound rat serotonin transporter, SERT1, is an oligomeric protein. FEBS Lett. 394, 44–46 [DOI] [PubMed] [Google Scholar]
- 7. Hastrup H., Karlin A., Javitch J. A. (2001) Symmetrical dimer of the human dopamine transporter revealed by cross-linking Cys-306 at the extracellular end of the sixth transmembrane segment. Proc. Natl. Acad. Sci. U.S.A. 98, 10055–10060 [DOI] [PMC free article] [PubMed] [Google Scholar]
- 8. Hastrup H., Sen N., Javitch J. A. (2003) The human dopamine transporter forms a tetramer in the plasma membrane: cross-linking of a cysteine in the fourth transmembrane segment is sensitive to cocaine analogs. J. Biol. Chem. 278, 45045–45048 [DOI] [PubMed] [Google Scholar]
- 9. Sorkina T., Doolen S., Galperin E., Zahniser N. R., Sorkin A. (2003) Oligomerization of dopamine transporters visualized in living cells by fluorescence resonance energy transfer microscopy. J. Biol. Chem. 278, 28274–28283 [DOI] [PubMed] [Google Scholar]
- 10. Egaña L. A., Cuevas R. A., Baust T. B., Parra L. A., Leak R. K., Hochendoner S., Peña K., Quiroz M., Hong W. C., Dorostkar M. M., Janz R., Sitte H. H., Torres G. E. (2009) Physical and functional interaction between the dopamine transporter and the synaptic vesicle protein synaptogyrin-3. J. Neurosci. 29, 4592–4604 [DOI] [PMC free article] [PubMed] [Google Scholar]
- 11. Schmid J. A., Scholze P., Kudlacek O., Freissmuth M., Singer E. A., Sitte H. H. (2001) Oligomerization of the human serotonin transporter and of the rat GABA transporter 1 visualized by fluorescence resonance energy transfer microscopy in living cells. J. Biol. Chem. 276, 3805–3810 [DOI] [PubMed] [Google Scholar]
- 12. Fjorback A. W., Pla P., Müller H. K., Wiborg O., Saudou F., Nyengaard J. R. (2009) Serotonin transporter oligomerization documented in RN46A cells and neurons by sensitized acceptor emission FRET and fluorescence lifetime imaging microscopy. Biochem. Biophys. Res. Commun. 380, 724–728 [DOI] [PubMed] [Google Scholar]
- 13. Just H., Sitte H. H., Schmid J. A., Freissmuth M., Kudlacek O. (2004) Identification of an additional interaction domain in transmembrane domains 11 and 12 that supports oligomer formation in the human serotonin transporter. J. Biol. Chem. 279, 6650–6657 [DOI] [PubMed] [Google Scholar]
- 14. Bartholomäus I., Milan-Lobo L., Nicke A., Dutertre S., Hastrup H., Jha A., Gether U., Sitte H. H., Betz H., Eulenburg V. (2008) Glycine transporter dimers: evidence for occurrence in the plasma membrane. J. Biol. Chem. 283, 10978–10991 [DOI] [PMC free article] [PubMed] [Google Scholar]
- 15. Scholze P., Freissmuth M., Sitte H. H. (2002) Mutations within an intramembrane leucine heptad repeat disrupt oligomer formation of the rat GABA transporter 1. J. Biol. Chem. 277, 43682–43690 [DOI] [PubMed] [Google Scholar]
- 16. Sahin-Tóth M., Lawrence M. C., Kaback H. R. (1994) Properties of permease dimer, a fusion protein containing two lactose permease molecules from Escherichia coli. Proc. Natl. Acad. Sci. U.S.A. 91, 5421–5425 [DOI] [PMC free article] [PubMed] [Google Scholar]
- 17. Fafournoux P., Noël J., Pouysségur J. (1994) Evidence that Na+/H+ exchanger isoforms NHE1 and NHE3 exist as stable dimers in membranes with a high degree of specificity for homodimers. J. Biol. Chem. 269, 2589–2596 [PubMed] [Google Scholar]
- 18. Köhler K., Forster I. C., Lambert G., Biber J., Murer H. (2000) The functional unit of the renal type IIa Na+/Pi cotransporter is a monomer. J. Biol. Chem. 275, 26113–26120 [DOI] [PubMed] [Google Scholar]
- 19. Madl J., Weghuber J., Fritsch R., Derler I., Fahrner M., Frischauf I., Lackner B., Romanin C., Schütz G. J. (2010) Resting state Orai1 diffuses as homotetramer in the plasma membrane of live mammalian cells. J. Biol. Chem. 285, 41135–41142 [DOI] [PMC free article] [PubMed] [Google Scholar]
- 20. Calebiro D., Rieken F., Wagner J., Sungkaworn T., Zabel U., Borzi A., Cocucci E., Zürn A., Lohse M. J. (2013) Single-molecule analysis of fluorescently labeled G-protein-coupled receptors reveals complexes with distinct dynamics and organization. Proc. Natl. Acad. Sci. U.S.A. 110, 743–748 [DOI] [PMC free article] [PubMed] [Google Scholar]
- 21. Brameshuber M., Weghuber J., Ruprecht V., Gombos I., Horváth I., Vigh L., Eckerstorfer P., Kiss E., Stockinger H., Schütz G. J. (2010) Imaging of mobile long-lived nanoplatforms in the live cell plasma membrane. J. Biol. Chem. 285, 41765–41771 [DOI] [PMC free article] [PubMed] [Google Scholar]
- 22. Schmidt T., Schütz G. J., Gruber H. J., Schindler H. (1996) Local stoichiometries determined by counting individual molecules. Anal. Chem. 68, 4397–4401 [Google Scholar]
- 23. Schwarzenbacher M., Kaltenbrunner M., Brameshuber M., Hesch C., Paster W., Weghuber J., Heise B., Sonnleitner A., Stockinger H., Schütz G. J. (2008) Micropatterning for quantitative analysis of protein-protein interactions in living cells. Nat. Methods 5, 1053–1060 [DOI] [PubMed] [Google Scholar]
- 24. Zacharias D. A., Violin J. D., Newton A. C., Tsien R. Y. (2002) Partitioning of lipid-modified monomeric GFPs into membrane microdomains of live cells. Science 296, 913–916 [DOI] [PubMed] [Google Scholar]
- 25. Hilber B., Scholze P., Dorostkar M. M., Sandtner W., Holy M., Boehm S., Singer E. A., Sitte H. H. (2005) Serotonin-transporter mediated efflux: a pharmacological analysis of amphetamines and nonamphetamines. Neuropharmacology 49, 811–819 [DOI] [PubMed] [Google Scholar]
- 26. Sucic S., Dallinger S., Zdrazil B., Weissensteiner R., Jørgensen T. N., Holy M., Kudlacek O., Seidel S., Cha J. H., Gether U., Newman A. H., Ecker G. F., Freissmuth M., Sitte H. H. (2010) The N terminus of monoamine transporters is a lever required for the action of amphetamines. J. Biol. Chem. 285, 10924–10938 [DOI] [PMC free article] [PubMed] [Google Scholar]
- 27. Moertelmaier M., Brameshuber M., Linimeier M., Schutz G. J., Stockinger H. (2005) Thinning out clusters while conserving stoichiometry of labeling. Applied Physics Lett. 87, 263903 [Google Scholar]
- 28. Smith C. S., Joseph N., Rieger B., Lidke K. A. (2010) Fast, single-molecule localization that achieves theoretically minimum uncertainty. Nat. Methods 7, 373–375 [DOI] [PMC free article] [PubMed] [Google Scholar]
- 29. Gao Y., Kilfoil M. L. (2009) Accurate detection and complete tracking of large populations of features in three dimensions. Optics Express 17, 4685–4704 [DOI] [PubMed] [Google Scholar]
- 30. Wieser S., Schütz G. J. (2008) Tracking single molecules in the live cell plasma membrane: do's and don't's. Methods 46, 131–140 [DOI] [PubMed] [Google Scholar]
- 31. Ulbrich M. H., Isacoff E. Y. (2007) Subunit counting in membrane-bound proteins. Nat. Methods 4, 319–321 [DOI] [PMC free article] [PubMed] [Google Scholar]
- 32. Leake M. C., Chandler J. H., Wadhams G. H., Bai F., Berry R. M., Armitage J. P. (2006) Stoichiometry and turnover in single, functioning membrane protein complexes. Nature 443, 355–358 [DOI] [PubMed] [Google Scholar]
- 33. Vogelsang J., Steinhauer C., Forthmann C., Stein I. H., Person-Skegro B., Cordes T., Tinnefeld P. (2010) Make them blink: probes for super-resolution microscopy. Chem. Phys. Chem. 11, 2475–2490 [DOI] [PubMed] [Google Scholar]
- 34. Schoen I., Ries J., Klotzsch E., Ewers H., Vogel V. (2011) Binding-activated localization microscopy of DNA structures. Nano Lett. 11, 4008–4011 [DOI] [PubMed] [Google Scholar]
- 35. Ulbrich M. (2011) Counting Molecules: Toward Quantitative Imaging (Tinnefeld P., Eggeling C., Hell S. W., eds), pp. 1–29, Springer, Berlin [Google Scholar]
- 36. Cha J. H., Zou M. F., Adkins E. M., Rasmussen S. G., Loland C. J., Schoenenberger B., Gether U., Newman A. H. (2005) Rhodamine-labeled 2β-carbomethoxy-3β-(3,4-dichlorophenyl)tropane analogues as high-affinity fluorescent probes for the dopamine transporter. J. Med. Chem. 48, 7513–7516 [DOI] [PubMed] [Google Scholar]
- 37. Eriksen J., Rasmussen S. G., Rasmussen T. N., Vaegter C. B., Cha J. H., Zou M. F., Newman A. H., Gether U. (2009) Visualization of dopamine transporter trafficking in live neurons by use of fluorescent cocaine analogs. J. Neurosci. 29, 6794–6808 [DOI] [PMC free article] [PubMed] [Google Scholar]
- 38. Magnani F., Tate C. G., Wynne S., Williams C., Haase J. (2004) Partitioning of the serotonin transporter into lipid microdomains modulates transport of serotonin. J. Biol. Chem. 279, 38770–38778 [DOI] [PubMed] [Google Scholar]
- 39. Molnár E., Swamy M., Holzer M., Beck-García K., Worch R., Thiele C., Guigas G., Boye K., Luescher I. F., Schwille P., Schubert R., Schamel W. W. (2012) Cholesterol and sphingomyelin drive ligand-independent T-cell antigen receptor nanoclustering. J. Biol. Chem. 287, 42664–42674 [DOI] [PMC free article] [PubMed] [Google Scholar]
- 40. Suzuki K. G., Kasai R. S., Hirosawa K. M., Nemoto Y. L., Ishibashi M., Miwa Y., Fujiwara T. K., Kusumi A. (2012) Transient GPI-anchored protein homodimers are units for raft organization and function. Nat. Chem. Biol. 8, 774–783 [DOI] [PubMed] [Google Scholar]
- 41. Farhan H., Freissmuth M., Sitte H. H. (2006) Oligomerization of neurotransmitter transporters: a ticket from the endoplasmic reticulum to the plasma membrane. Handb. Exp. Pharmacol. 175, 233–249 [DOI] [PubMed] [Google Scholar]
- 42. Sucic S., Koban F., El-Kasaby A., Kudlacek O., Stockner T., Sitte H. H., Freissmuth M. (2013) Switching the clientele: a lysine residing in the C terminus of the serotonin transporter specifies its preference for the coat protein complex II component SEC24C. J. Biol. Chem. 288, 5330–5341 [DOI] [PMC free article] [PubMed] [Google Scholar]
- 43. Torres G. E., Carneiro A., Seamans K., Fiorentini C., Sweeney A., Yao W. D., Caron M. G. (2003) Oligomerization and trafficking of the human dopamine transporter: mutational analysis identifies critical domains important for the functional expression of the transporter. J. Biol. Chem. 278, 2731–2739 [DOI] [PubMed] [Google Scholar]
- 44. Sitte H. H., Freissmuth M. (2003) Oligomer formation by Na+-Cl−-coupled neurotransmitter transporters. Eur. J. Pharmacol. 479, 229–236 [DOI] [PubMed] [Google Scholar]
- 45. Yamashita A., Singh S. K., Kawate T., Jin Y., Gouaux E. (2005) Crystal structure of a bacterial homologue of Na+/Cl−-dependent neurotransmitter transporters. Nature 437, 215–223 [DOI] [PubMed] [Google Scholar]
- 46. Yernool D., Boudker O., Jin Y., Gouaux E. (2004) Structure of a glutamate transporter homologue from Pyrococcus horikoshii. Nature 431, 811–818 [DOI] [PubMed] [Google Scholar]
- 47. Jiang J., Shrivastava I. H., Watts S. D., Bahar I., Amara S. G. (2011) Large collective motions regulate the functional properties of glutamate transporter trimers. Proc. Natl. Acad. Sci. U.S.A. 108, 15141–15146 [DOI] [PMC free article] [PubMed] [Google Scholar]
- 48. Koch H. P., Larsson H. P. (2005) Small-scale molecular motions accomplish glutamate uptake in human glutamate transporters. J. Neurosci. 25, 1730–1736 [DOI] [PMC free article] [PubMed] [Google Scholar]
- 49. Penmatsa A., Wang K. H., Gouaux E. (2013) X-ray structure of dopamine transporter elucidates antidepressant mechanism. Nature 503, 85–90 [DOI] [PMC free article] [PubMed] [Google Scholar]
- 50. van Meer G. (2005) Cellular lipidomics. EMBO J. 24, 3159–3165 [DOI] [PMC free article] [PubMed] [Google Scholar]