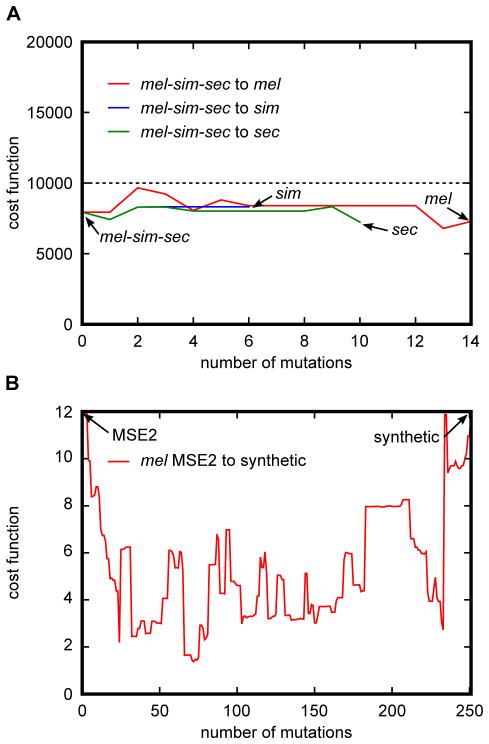
Figure 5. Applications of the Neutral Enhancer Evolutionary Algorithm (NEEA).
(A) Method for finding functionally accessible evolutionary paths between ancestral and extant enhancer sequences. The ancestral mel-sim-sec eve stripe 2 enhancer sequence was predicted using Bayesian inference. Functionally accessible evolutionary paths between the ancestral stripe 2 sequence and the corresponding sequence in sim, sec, and mel were generated using the NEEA algorithm. Dashed line corresponds to the viability threshold wherein sequences with a calculated cost function above the line are non-viable. Paths were generated such that at all points the calculated cost function E were below the viability threshold. In addition, a penalty of 0.01 was used in Eq. 2 in order to minimize the variance of E along the path. Vertical axis shows the value of E at that each point along the path. Horizontal axis depicts the number of mutations separating the D. mel stripe 2 enhancer from the current point along the path. (B) Method for creating a collection of functionally equivalent enhancers with decreasing homology. First, simulated annealing was used to generate a synthetic DNA sequence expressing in a D. mel MSE2 pattern. To maximize the probability of generating a functional enhancer, the sum of the squared differences between the predicted and the reference pattern of seven separate models were added together. A functionally accessible path was generated between the wild type mel MSE2 sequence and the synthetic enhancer using the NEEA algorithm. In this case the objective was to give greater weight to the shape of the pattern then to the amplitude. For this purpose both the predicted and observed expression patterns were normalized on a scale of 0 to 1. Cost functions were calculated as the sum of the squared differences between the normalized patterns. To prevent under-expression, the value of E was multiplied by the fold under-expression between the reference and observed patterns prior to normalization. Fold under-expression was calculated as the ratio between the maxima of the reference and predicted patterns. As in the case of simulated annealing, the cost function evaluations of seven separate models were added together to provide a new cost function used in the NEEA optimization algorithm. The vertical axis shows the total added score of seven models while the horizontal depicts the number of mutations separating the wild type MSE2 from the synthetic sequence. A total added score of 12 was used as the viability threshold in the optimization.

