Abstract
There is a lack of studies that examine dynamics of heat-induced shrinkage of organ tissues. Clinical procedures such as radiofrequency ablation, microwave ablation or high-intensity focused ultrasound, use heat to treat diseases such as cancer and cardiac arrhythmia. When heat is applied to tissues, shrinkage occurs due to protein denaturation, dehydration, and contraction of collagen at temperatures greater 50ºC. This is particularly relevant for image-guided procedures such as tumor ablation, where pre- and post-treatment images are compared and any changes in dimensions must be considered to avoid misinterpretations of the treatment outcome. We present data from ex vivo, isothermal shrinkage tests in porcine liver tissue, where axial changes in tissue length were recorded during 15 minutes of heating to temperatures between 60 and 95ºC. A mathematical model was developed to accurately describe the time and temperature-dependent shrinkage behavior. Shrinkage dynamics had same characteristics independent of temperature; the estimated relative shrinkage, adjusted for time since death, after 15 min heating to temperatures of 60, 65, 75, 85 and 95ºC, was 12.3, 13.8, 16.6, 19.2, and 21.7%, respectively. Our results demonstrate shrinkage dynamics of organ tissues, and suggest the importance of considering tissue shrinkage for thermal ablative treatments.
Keywords: Shrinkage, thermal damage, organ tissue, ablation
1 Introduction
Heat mediated treatments for cancer, cardiac arrhythmias, Parkinson’s disease, joint laxity, hyperopia and hyperplasia use heat to destroy or tighten inadvertent tissue [1–7]. Regardless of the treatment, contraction (shrinkage) occurs if tissue is exposed to temperatures greater than 50ºC as a result of protein denaturation, dehydration, and contraction of collagen [8–11]. This tissue contraction is clinically significant particularly for image-guided therapies such as Radiofrequency (RF) ablation, Microwave (MW) ablation and high-intensity focused ultrasound (HIFU) where any changes in tissue dimensions would have to be considered when planning and assessing the treatment. That means that, visual or computer aided comparison of pre-interventional images with post-interventional images showing the ablation zone underestimate the actual dimensions of the destroyed tissue region if contraction is not considered [8]. Thus a mathematical model accounting for thermally induced contraction for ablation treatments would aid in prediction and assessment of the ablation zone dimensions more accurately.
Predictive models of the biothermomechanical response of collagenous tissue have been presented in literature, typically based on low order kinetics and the Arrhenius formulation [12–14], statistical methods, or phenomenological based kinetic models [15]. Prior studies have described shrinkage dynamics of collagenous tissues such as pericardium, tendons, and arteries [12, 15, 16], but there are no published mathematical models of shrinkage dynamics for any organ tissues, such as the liver. In this study, we performed ex vivo, isothermal shrinkage experiments with porcine liver tissue for temperatures between 60 and 95ºC, and a longitudinal linear regression model with fitted parameters was used to model the dynamic and temperature-dependent contraction of liver tissue.
2 Methodology
Iso-thermal experiments were performed on liver tissue and the shrinkage was recorded via digital video camera, while temperature was measured via digital thermometer. Subsequently, the videos were analyzed, and the relative shrinkage was determined for each experiment. Based on the experimental shrinkage data and the recorded temperature a longitudinal linear regression model was fitted to describe shrinkage dynamics.
2.1 Iso-thermal Experiments
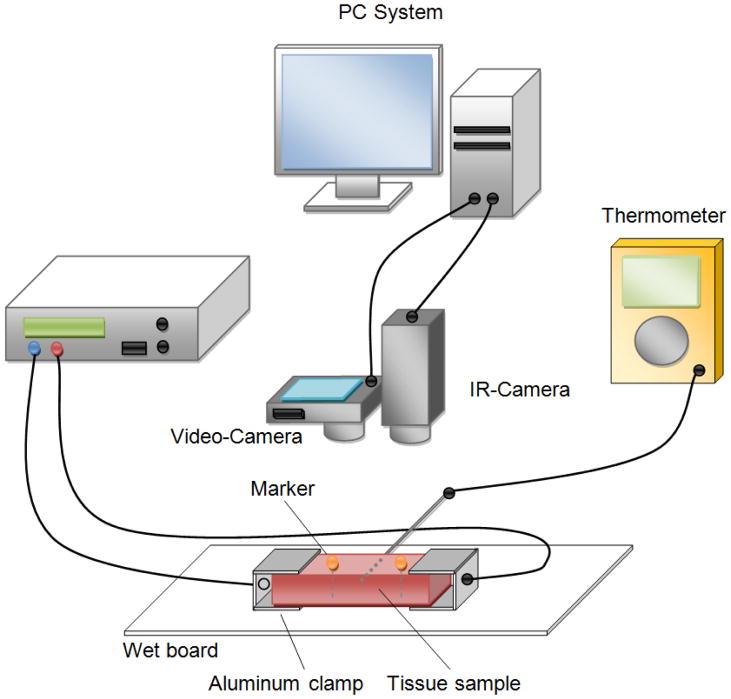
Two fresh slaughtered porcine livers were obtained from a local slaughterhouse and transported at room temperature (~20ºC) in a cooling box to the laboratory. The livers were stored in a refrigerator at approximately 4°C and used within 62 hours after slaughtering. The liver was cut into smaller pieces (approximately 10 × 30 × 50 mm) and the liver capsule was completely removed from each sample. The samples were immersed in 0.9% NaCl solution at ~20ºC and used within 3–4 hours after cutting. Figure 1 shows the experimental setup. A bipolar radiofrequency system (Advanced Energy, PDX 500) with two aluminum clamp electrodes was used to uniformly heat the samples for 15 minutes. No external tension was applied to the tissue samples. Metal pins (diameter head 4mm, diameter shaft 0.8 mm, length 45 mm) where the metallic shaft was isolated with a thin layer of epoxy resin (Loctite) were used as markers. Two markers were inserted parallel in the center of the sample (penetrated through the entire tissue sample) separated by approximately 15 mm. The aluminum clamps (20 × 25 × 0.8 mm) were attached on each end of the sample and connected to the RF generator. Each sample was placed on a wet plastic board to reduce friction, and a digital video camera (resolution: 1080 × 720, 30 fps) was positioned approximately 20 centimeters directly above the sample. Additionally, a thermocouple was placed in the middle of the sample to monitor the center temperature.
Figure 1.
Experimental setup schematics. A digital and an infra-red camera were placed perpendicular above the sample piece. A RF-Generator was used to heat the tissue sample. Marker motion during heating procedure was recorded via digital video camera. The surface temperature was recorded with an infrared camera to verify the heating uniformity.
Liver samples were heated for 15 minutes to five target temperatures between 60 and 95ºC (n=7 for each temperature), to perform the isothermal experiments. During the heating phase, power of 40 Watts was applied until the target temperature was obtained; power was then reduced and controlled manually in order to keep the tissue temperature constant (± 0.9ºC variability around target temperature). The marker motion during heating was recorded using the digital video camera. The infrared camera (resolution: 320 × 420, 30 fps) was used to record the surface temperature of the tissue in order to determine the heat uniformity of the sample. All experiments were performed with tissue at room temperature. After the heating, samples were cooled off for approximately 15 minutes at room temperature until 38ºC was reached and marker position was recorded. The difference of the marker position in the finial heating phase (~after 1000 seconds of heating) and at 38ºC was measured to identify potential tissue recovery.
Preliminary experiments with porcine liver were performed to optimize the experimental setup, including sample dimensions and marker design to ensure a uniform heating of the entire tissue. Figure 2 depicts the temperature distribution of two different samples recorded with the final measurement setup from top and from the side at tissue temperature of approximately 50ºC.
Figure 2.
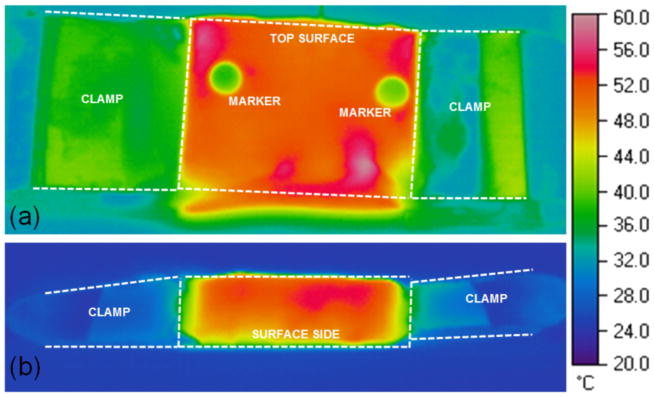
Temperature distribution in tissue sample recorded from top (a) and from the side (b).
Note that temperatures below 95ºC were selected for all experiments since excessive heating caused explosive evaporation and combustion of the tissue samples complicated the maintenance of constant temperature as well as the recording of the tracking markers.
2.2 Shrinkage Analysis
To measure the relative shrinkage of the liver tissue, we generated a tracking algorithm in MATLAB (MathWorks, Natick, MA). The algorithm analyzed the motion of the markers automatically after the user selected the initial marker position. Markers were identified on every thirtieth frame (= 1 second), and the marker positions (centers) as well as the distance between the two markers were stored.
The algorithm identified pixels that belong to the tracking marker based on a threshold criteria derived from the initial position of the markers. Then the processed frame was converted to a binary image (marker pixels = 1, non-marker pixels = 0), marker centers (x) and marker distance (L) were calculated, respectively (see Figure 3). In the last step, the shrinkage relative to the initial marker distance was calculated.
Figure 3.
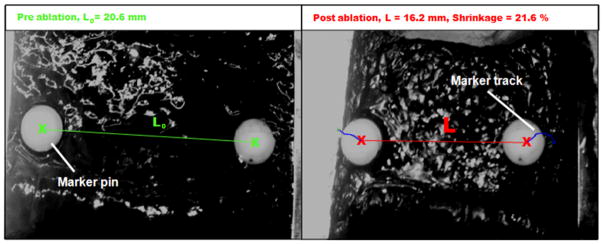
Analysis of marker motion at 85ºC target temperature. Left: initial distance (L0) between the centers of the two tracking markers at room temperature (20ºC); Right: Reduced distance (L) due to shrinkage at the end of a 15 min exposure at 85ºC. Note: Both images were taken from the same angle; the camera was mounted on a rigid construction directly above the tissue sample. The clamps were attached to the tissue sample and followed the oblique position of the sample edges during and after the experiment. The edges of the clamps in the right image are non-parallel due to non-uniform tissue contraction.
The relative shrinkage in percent was estimated with:
| (1) |
where L (mm) is the current distance between the markers, and L0 (mm) is the initial distance between the markers.
2.3 Mathematical Shrinkage Model
We applied a novel longitudinal linear regression model based on the rules of mixture model presented by Chen et al. [15] to describe the temperature-dependent shrinkage of the liver tissue. The original model by Chen implies that the shrinkage during heating consists of an initial linear (or pre-transition) regime, a long-term linear (or post-transition) regime, and a nonlinear transition that occurs between the initial and the long-term regime. The relative shrinkage ξ, which is the alternation of length in percentage relative to the initial length, was modeled by following equation:
| (2) |
where A0, A1, a0, a1, are dimensionless material constants and v is a factor that accounts for interaction of time and temperature. It is given as
| (3) |
where t(s) is the heating time and τ2 (s) is a temperature characteristic time which is different for each temperature between 60ºC and 95ºC. The shrinkage characteristic within the transition regime is described by f ∈ [0,1], which is a distribution fraction for describing thermal damage, where f ≡ 0, if there is no thermal damage.
As presented in by Chen [11], ln (τ2) is a linear function of , thus Equation (3) may be written as
| (4) |
where a2 is a factor that can be determined from linear regression and T (K) is the temperature.
With our experimental setup it was not possible to achieve uniform tissue heating within the initial regime (heating time < 150 seconds). Thus we did not include the initial regime, and only modeled the shrinkage for heating times greater 200 seconds based on the long-term regime term of Equation (2), i.e. considering f=1. We expanded the model as a longitudinal linear regression model that incorporates all of the data of the experiments for heating times greater 200 seconds and accounts for repeated measures over time, adjusts for time since sacrifice and includes random effects for repeated measures per experiment [17–21]. The random effects linear regression can be written as:
| (5) |
where ξij is the shrinkage for the jth observation of experiment i, a0, a1 and a2 are material parameters, β3 and β4 are included to adjust for time since sacrifice, bi is a factor to account for the experiment level effect for experiment i, and εij is the residual, I(days=k) is an indicator taking a value of 1 if it was k days since sacrifice for the liver in experiment i. The model was fit using the function lme (linear mixed effect) in the nlme package of the statistical software R [19]. The model is based on a combination of empirical Bayes and maximum likelihood estimation of model parameters [22]]. The model is estimated using the expectation-maximization (EM) algorithm [19].
We also evaluated the change in shrinkage at the end of the constant heating period (at approximately 1000 seconds) and at 15 minutes later to determine if the shrinkage changes after a cooling period. For each temperature, the difference in shrinkage was calculated and the mean and 95% confidence interval estimated based on a normal approximation.
3 Results
3.1 Experiments
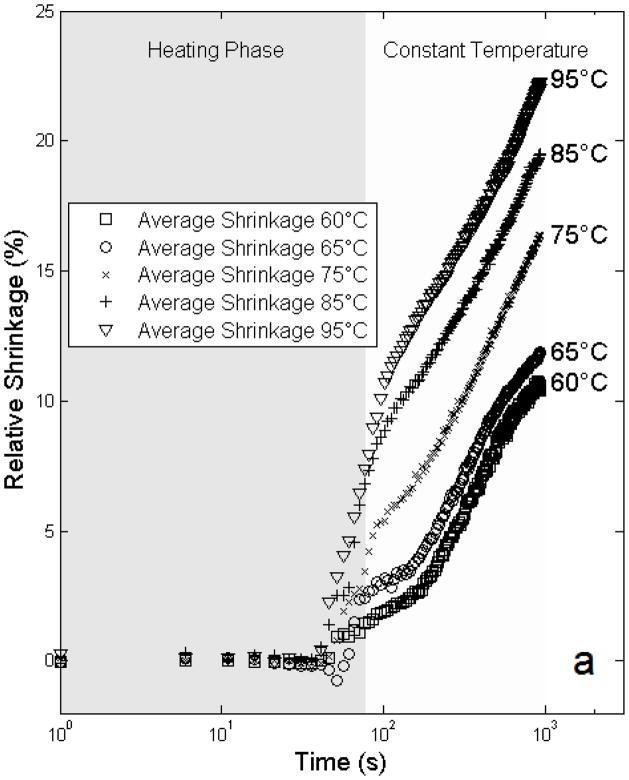
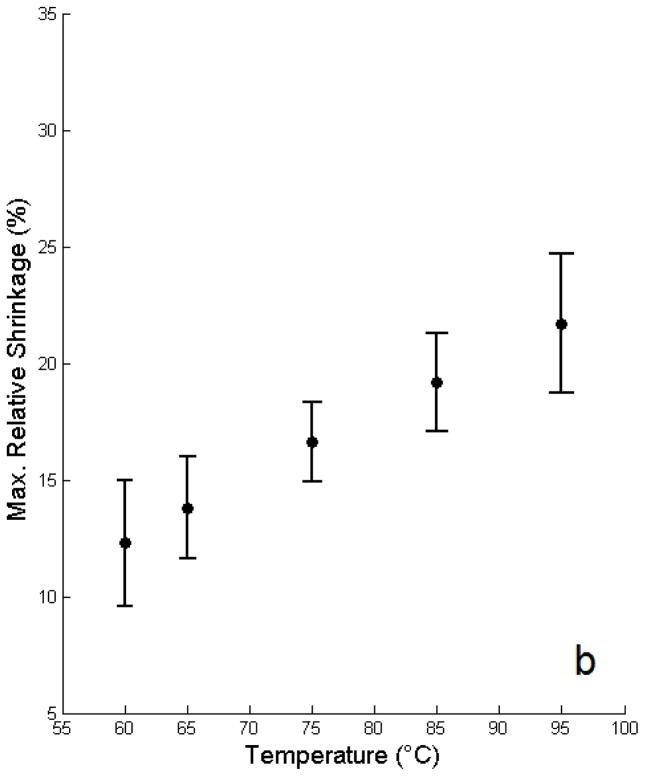
The mean free shrinkage responses for the different temperatures between 60 and 95ºC are shown in Figure 4 as a function of time. Average time (heating phase) to reach target temperature was 77 ± 18 seconds; after reaching the target temperature the data demonstrates an exponential relationship between ξ and time. Figure 5 shows the model estimates of the maximal relative shrinkage vs. target temperature plus 95% confidence intervals; shrinkage increased progressively with temperature, with relative shrinkages of 12.3% at 60ºC, and 21.7% at 95ºC.
Figure 4.
Average isothermal shrinkage of liver tissue versus time from experimental data. Heating phase, and duration of constant temperature are indicated at top of image.
Figure 5.
Model estimates of final relative shrinkage vs. target temperature including model based 95% confidence intervals for shrinkage per temperature adjusting for days since sacrifice are plotted.
The mean and standard deviation of heating time to reach target temperature (heating phase) as well as the maximal relative shrinkage after 15 minutes of heating measured in ex vivo porcine liver, is reported in Table 1. Contraction increases with temperature, which is consistent with results presented in [12]. The regression model shows a statistically significant association between temperature and shrinkage (p = 0003) (Table 2, a2). In addition, we tested for differences in shrinkage between each temperature and the other temperatures at 1000 seconds: For all comparisons, the estimated mean shrinkage values (Figure 5) were statistically significantly different (p < 0.01). The range of the random effects is −10.0 to 11.1 with a standard deviation of 4.76.
Table 1.
Summary of ex vivo shrinkage experiments and model estimates for final relative shrinkage corrected for day since sacrifice.
| Target Temperature | Heating Time to Tagret Temp. | Temp. Deviation after reaching Target Temp. | Temp. Difference Sensor - IR Camera | Final Relative Shrinkage; Model Estimates |
|---|---|---|---|---|
| (°C) | MEAN ± SD (s) | ± SD (°C) | MEAN (°C) | MEAN (%) [95 %CI] |
| 60 | 55.6 ± 5.9 | ± 0.6 | 2.5 | 12.3 [9.6, 15.0] |
| 65 | 65.4 ± 7.0 | ± 0.5 | 4.1 | 13.8 [11.6, 16.0] |
| 75 | 70.7 ± 7.2 | ± 0.6 | 7.8 | 16.6 [14.9, 18.2] |
| 85 | 82.4 ± 10.5 | ± 0.8 | 10.5 | 19.2 [17.1, 21.2] |
| 95 | 94.3 ± 35.4 | ± 0.9 | 13.0 | 21.7 [18.7, 24.6] |
Note: 7 samples were measured for each target temperature which gives a total of 35 experiments; the heating time for each experiment was 1000 seconds
Table 2.
Summary of the material parameters and characteristic time τ2 estimated based on mixed effects regression model shown in equation 5.
| Parameters | Model Coefficient | Std. Error | p-value |
|---|---|---|---|
| a0 | 75.1 | 23.41 | 0.001 |
| a1 | 5.1 | 0.01 | <0.0001 |
| a2 | −32806 | 8145 | 0.0003 |
| β3 | −3.86 | 2.10 | 0.076 |
| β4 | 4.86 | 2.14 | 0.030 |
The analysis of surface temperature data recorded via infra-red camera revealed uniform temperature profiles with a slight temperature drop at the free sample edges. The averaged surface temperature variability was ± 4.0ºC for temperatures below 85ºC, ± 6.0ºC for 85ºC, and ± 7.9ºC for 95ºC. Larger deviations between sensor temperature and IR camera temperature were measured for higher temperatures, presumably due to increasing convection at the top surface of the tissue sample.
The mean (95% CI) of the change of the final shrinkage 15 minutes after heating was −0.66% (−1.2, −0.13), −0.16% (−0.61, 0.28), 0.84% (0.51, 1.18), 1.85% (1.44, 2.26), 2.86% (2.26, 3.46) for 60, 65, 75, 85 and 95ºC respectively. Note: A negative mean value indicates that the final shrinkage decreased during the cooling phase indicating possible tissue recovery. The additional shrinkage at high temperatures is likely due tissue temperature being elevated for longer duration at those high temperatures after heating was discontinued.
3.2 Model Fit
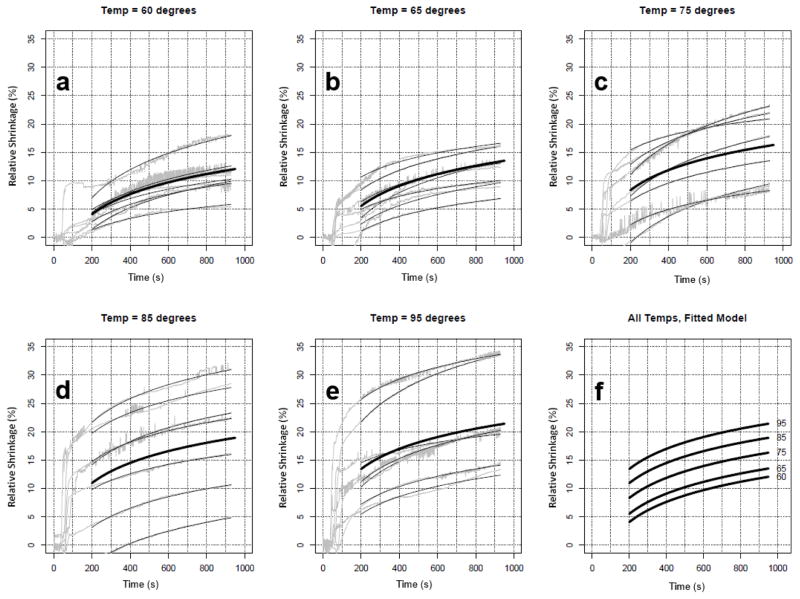
A longitudinal linear regression model was employed that incorporates data for the long-term phase of the experiments (heating time > 200 s). We were able to use all of the repeated measures from all experiments, account for repeated measures over time, and adjust for time since sacrifice (i.e., experiments occurred 0, 1 and 2 days after sacrifice of the animal). Random effects were included per experiment to account for repeated measures, as well as fixed effects of temperature and fixed effects for the days since sacrifice. The model fits extremely well (see Figure 6); the R2 value is 0.99 (including random effects) meaning that 99% of the variance is explained by the model. Ignoring the experiment level intercept (i.e. random effect), the R2 value is 0.60. Using the model, we evaluate the significance of the temperature term and the shrinkage values at any given point in time between 200 and 1000 seconds. Original data and results of the model fitting are shown in Figure 6; model parameter values are listed in Table 2. To evaluate the fit of the model to each experiment, we calculated the experiment-specific R2 based on the mean within an experiment (for calculating the total sum of squares) and the model-based fitted values. One of the experiments at temperature 60 has a low R2 (R2=0.40), evidenced in Figure 6. The next two lowest R2 were 0.65 and 0.69 for two experiments at temperatures 95 and 75ºC, respectively. The remaining 32 experiments all had R2 values greater than 0.80, with 14 experiments with R2 values greater than 0.95.
Figure 6.
Experimental shrinkage curves of porcine liver (gray) and fitted regression models (thin black lines) per experiment (a–e). The thick black line shows the ‘fitted’ model per temperature. (f) shows a plot of the fitted model for all 5 temperatures, demonstrating a clear increase in shrinkage by temperature.
4 Discussion
In thermally mediated treatments such as radiofrequency ablation, microwave ablation or high-intensity focused ultrasound, heat is used to treat pathologic tissue. When heat is applied to tissues, shrinkage occurs as a result of protein denaturation, dehydration, and specifically, contraction of collagen at higher temperatures (> 50ºC) [9, 23].
Prior studies evaluated the dynamic shrinkage behavior in collagenous tissues such as bovine chordae tendineae [11], bovine tendon [23], rat tendon [13], bovine joint capsule [24], and bovine pericardium [12]. Common findings of these studies were that the rate of shrinkage significantly increased with temperature, and that minor contraction occurred at temperatures below 60ºC. The dynamic heat-induced tissue shortening process is controlled by kinetic processes, and thus can be described with predictive models employing low order kinetics and the Arrhenius relation [12–14], statistical methods, or phenomenological based kinetic models [15]. Phenomenological models have the advantage of applicability regardless of the mechanisms underlying the shrinkage process [9, 12].
In this study, we evaluated the dynamic shrinkage of ex vivo porcine liver tissue samples at ablative temperatures (60 – 95ºC) for 15 min. This duration is in the range of time periods that are clinically used for cardiac and tumor ablation procedures. The tissue contraction during iso-thermal heating was recorded via digital video imaging and analyzed to quantify the relative shrinkage. The smallest contraction occurred at 60ºC and was 12.3%; the highest contraction was measured at 95ºC and was 21.7%. Similar to a prior study in liver tissue [8], contraction was most significant in the first two minutes of heating and decreased afterwards (see Figure 4). The estimated model parameters characterizing the tissue shrinkage dynamics are by a factor of ~1.8 higher than the values for collagen denaturation reported in the literature [15], which differ depending on the tissue type. While prior studies applied models to collagenous tissues where collagen denaturation is supposedly responsible for the observed shrinkage, organ tissues (e.g. liver as studied here) also contain collagen [25] about half to one third the amount contained typically in chordae tendineae [26] where the model was originally applied [15]. In addition to collagen denaturation, other processes such as water loss may contribute towards tissue shrinkage.
Similar to prior findings in bovine chordae tendineae [11], we found that shrinkage followed three characteristic regimes: A slow initial regime, where little to no shrinkage occurred, a transition regime with rapid shrinkage, and a long-term regime with continuing slow shrinkage. However due to the rapid heating in the initial phase of the experiments our data revealed less distinct initial- and transition regimes and a more distinct long-term regime. Particularly, a similar, approximately exponential contraction behavior was observed for all temperatures for the long-term regime (see Figure 6).
A statistical model was used to describe the time and temperature-dependent contraction of liver tissue, and was fit to the experimental data. The model was derived from phenomenological equations that were presented by Chen et al [15] to describe the shrinkage behavior of collagenous tissue (chordae tendineae) during heating. Due to repeated measures over time, we included a random effect per experiment. In the model fitting, we considered an interaction term between temperature and time, but it did not improve the model fit. By using the regression model approach, we were able to adjust our parameter estimates for time since sacrifice and to provide precision estimates for parameter estimates. The model fits the experimental data extremely well; however, factors potentially contributing towards deviations between model and measured data may include effects during non-isothermal tissue heating that are not accurately represented in the model. It is usually impossible to perform ideal isothermal tissue studies. In the current study RF power was controlled manually to keep the tissue temperature constant during the heating experiments (± 0.9ºC variability). However, an automatic temperature controller to regulate the power supplied by the generator in order to keep the temperature in the tissue constant may reduce temperature variability and allow better reproducibility of results.
Following heating collagenous tissues can experience partial recovery of shrinkage [11]. Our data revealed that final contraction for heating temperatures lower 75ºC might undergo tissue recovery, though even at the lowest temperature of 60ºC recovery was only 0.66% and likely not clinically relevant. For higher temperatures we found an increase in maximal final shrinkage, e.g. by an additional 2.86% for 95ºC. The model presented in this paper does not consider shrinkage recovery, which may result in an overestimation of the final shrinkage at higher temperatures.
In the current study there was considerable shrinkage during the initial heating phase (first two min) which cannot be described with our model. Nevertheless, shrinkage values at any given point in time between 200 and 1000 can be predicted, and this is in the time range of clinically ablation procedures.
The phenomenological equations were originally designed to describe the time, temperature, and load-dependent axial contraction, since prior studies showed that mechanical uni-axial stresses delayed the denaturation processes and tend to diminish the effect of heating [11, 27]. In this study we performed free shrinkage tests without applying isotonic loads to the tissue samples. To determine the influence of mechanical loads on the shrinkage, additional experiments would be required. Note however, that liver tissue is known to hardly bear mechanical loads and to yield at relatively low tensile stresses (about 5.8×10⁴ Pa at 68.7% elongation [28]).
Prior studies indicate quantitative differences between electrical and mechanical tissue properties measured in vivo and post-mortem as a result of lack of perfusion, cell and tissue breakdown [29–31]. Mechanical stiffness of the liver tissue increases as a function post-mortem up to about 20% and may contribute to the variability in the presented shrinkage data measured within 62 hours (see Figure 5). Note however that the statistical model was able to correct for time after tissue extraction with high R2-values after this correction is applied.
The presented shrinkage model assumes isotropic material properties. However, data presented by Chui et al [32] shows that like many other soft biological tissues, liver is anisotropic and heterogeneous. Therefore contraction could depend on the orientation of the tissue sample which was not evaluated here. Furthermore, in this study we used unperfused ex vivo tissue samples and mechanical tissue behavior may differ in-vivo. While in-vivo shrinkage might be significantly different, for the scope of improving treatment planning, it is worthwhile to determine ranges of tissue shrinkage properties with ex-vivo liver.
Our setup did not allow us to determine the shrinkage behavior at temperatures above 95ºC, which is relevant for treatment modalities where higher tissue temperatures are obtained, such as microwave ablation [33]. Furthermore, desiccation and vaporization caused by higher temperatures may cause additional changes in tissue dimension; these effects cannot be examined with the experimental setup used here.
Nevertheless, this appears to be the first study on the temperature-dependent dynamics of shrinkage behavior of organ tissue. In particular, the results are relevant to thermal tumor ablation procedures (e.g. radiofrequency ablation), that use post-interventional images to evaluate the extent of the destroyed tissue region [8, 14, 34]. Without consideration of tissue contraction, measurements of the ablation zone underestimate dimensions of destroyed tissue. Recent studies presented by Brace et al [8] and Sommer et al [35] determined the amount of tissue contraction during radiofrequency and microwave ablation, and demonstrated that contraction is an important aspect that must be considered when comparing pre- and post-ablation images. The issue of tissue contraction is also relevant for mathematical models that aim to predict ablation zone dimensions based on simulation of tissue heating. Such models implemented as software tools are investigated for planning and optimization of tumor ablation treatments to ensure adequate tumor coverage, while minimizing potential damage surrounding structures [36–39]. Although these tools take into account complex patient specific geometry and vascular cooling, none of these tools yet considers thermally induced shrinkage effects. These tools assume that tissue dimensions stay the same and thus overestimate the size of estimated ablation zone. Thus, a mathematical model as presented in this paper may be integrated into such software tools to improve accuracy. However, since the studies in this paper were performed on normal tissue, additional studies on tumors are required to confirm shrinkage behavior of tumor tissues since tumor tissue mechanical properties may differ [29–31].
5 Conclusions
We presented experimental data on dynamics of heat induced free shrinkage of liver tissue and fitted a mathematical model to the data. This study indicates that shrinkage dynamics were sensitive to temperature and could be modeled adequately via longitudinal linear regression model. Our results suggest importance of consideration of tissue shrinkage for heat mediated treatments.
Acknowledgments
This work was supported by NIH grants R01CA118990, R21CA135519. This work was also supported in part by the Biostatistics Shared Resource, Hollings Cancer Center, Medical University of South Carolina (P30 CA138313).The work was conducted in a facility constructed with support from the National Institutes of Health, Grant Number C06 RR018823 from the Extramural Research Facilities Program of the National Center for Research Resources.
References
- 1.Benabid AL, Chabardes S, Mitrofanis J, et al. Deep brain stimulation of the subthalamic nucleus for the treatment of Parkinson’s disease. Lancet Neurol. 2009 Jan;8(1):67–81. doi: 10.1016/S1474-4422(08)70291-6. [DOI] [PubMed] [Google Scholar]
- 2.Gazelle GS, Goldberg SN, Solbiati L, et al. Tumor ablation with radio-frequency energy. Radiology. 2000 Dec;217(3):633–46. doi: 10.1148/radiology.217.3.r00dc26633. [DOI] [PubMed] [Google Scholar]
- 3.Livraghi T, Goldberg SN, Lazzaroni S, et al. Small hepatocellular carcinoma: treatment with radio-frequency ablation versus ethanol injection. Radiology. 1999 Mar;210(3):655–61. doi: 10.1148/radiology.210.3.r99fe40655. [DOI] [PubMed] [Google Scholar]
- 4.Nademanee K, McKenzie J, Kosar E, et al. A new approach for catheter ablation of atrial fibrillation: mapping of the electrophysiologic substrate. J Am Coll Cardiol. 2004 Jun 2;43(11):2044–53. doi: 10.1016/j.jacc.2003.12.054. [DOI] [PubMed] [Google Scholar]
- 5.Hecht P, Hayashi K, Cooley AJ, et al. The thermal effect of monopolar radiofrequency energy on the properties of joint capsule. An in vivo histologic study using a sheep model. Am J Sports Med. 1998 Nov-Dec;26(6):808–14. doi: 10.1177/03635465980260061201. [DOI] [PubMed] [Google Scholar]
- 6.Madersbacher S, Kratzik C, Susani M, et al. Tissue ablation in benign prostatic hyperplasia with high intensity focused ultrasound. J Urol. 152(6 Pt 1):1956–60. doi: 10.1016/s0022-5347(17)32278-4. discussion 1960–1, Dec, 1994. [DOI] [PubMed] [Google Scholar]
- 7.McDonald MB. Conductive keratoplasty: a radiofrequency-based technique for the correction of hyperopia. Trans Am Ophthalmol Soc. 2005;103:512–36. [PMC free article] [PubMed] [Google Scholar]
- 8.Brace CL, Diaz TA, Hinshaw JL, et al. Tissue contraction caused by radiofrequency and microwave ablation: a laboratory study in liver and lung. J Vasc Interv Radiol. 2010 Aug;21(8):1280–6. doi: 10.1016/j.jvir.2010.02.038. [DOI] [PMC free article] [PubMed] [Google Scholar]
- 9.Wright NT, Humphrey JD. Denaturation of collagen via heating: an irreversible rate process. Annu Rev Biomed Eng. 2002;4:109–28. doi: 10.1146/annurev.bioeng.4.101001.131546. [DOI] [PubMed] [Google Scholar]
- 10.Humphrey JD. Continuum biomechanics of soft biological tissues. Proceedings of the Royal Society A. 2003;459:1–44. [Google Scholar]
- 11.Chen SS, Wright NT, Humphrey JD. Heat-induced changes in the mechanics of a collagenous tissue: isothermal, isotonic shrinkage. J Biomech Eng. 1998 Jun;120(3):382–8. doi: 10.1115/1.2798005. [DOI] [PubMed] [Google Scholar]
- 12.Dueck J, Marashdeh M, Breiter R. Experimental Investigation and Mathematical Modeling of the Thermal Shrinkage of Bovine Pericardium. Journal of Medical and Biological Engineering. 2010;31(3):193–200. [Google Scholar]
- 13.Miles CA, Burjanadze TV, Bailey AJ. The kinetics of the thermal denaturation of collagen in unrestrained rat tail tendon determined by differential scanning calorimetry. J Mol Biol. 1995 Jan 27;245(4):437–46. doi: 10.1006/jmbi.1994.0035. [DOI] [PubMed] [Google Scholar]
- 14.Weir CE. Rate of shrinkage of tendon collagen-heat, entropy and free energy of activation of the shrinkage of untreated tendon. Effect of acid salt, pickle, and tannage on the activation of tendon collagen. J Am Leather Chem Ass. 1949;44:108–140. [Google Scholar]
- 15.Chen SS, Wright NT, Humphrey JD. Phenomenological evolution equations for heat-induced shrinkage of a collagenous tissue. IEEE Trans Biomed Eng. 1998 Oct;45(10):1234–40. doi: 10.1109/10.720201. [DOI] [PubMed] [Google Scholar]
- 16.Agah R, Pearce JA, Welch AJ, et al. Rate process model for arterial tissue thermal damage: implications on vessel photocoagulation. Lasers Surg Med. 1994;15(2):176–84. doi: 10.1002/lsm.1900150205. [DOI] [PubMed] [Google Scholar]
- 17.Hedeker D. An introduction to growth modeling. In: IDK, editor. Quantitative Methodology for the Social Sciences. Thousand Oaks CA: Sage Publications; 2004. [Google Scholar]
- 18.Hedeker D, Gibbons RD. Longitudinal Data Analysis. Wiley; 2006. [Google Scholar]
- 19.Lindstrom MJ, Bates DM. Newton-Raphson and EM Algorithms for Linear Mixed-Effects Models for Repeated-Measures Data. Journal of the American Statistical Association. 1988;83:1014–1022. [Google Scholar]
- 20.McLean RA, Sanders WL, Stroup WW. A Unified Approach to Mixed Linear Models. The American Statistician. 1991;45:54–64. [Google Scholar]
- 21.Pinheiro J, Bates D, DebRoy S, et al. nlme: Linear and Nonlinear Mixed Effects Models. R package version 3.1–103. 2012 [Google Scholar]
- 22.Laird NM, Ware JH. Random-effects models for longitudinal data. Biometrics. 1982 Dec;38(4):963–74. [PubMed] [Google Scholar]
- 23.Wall MS, Deng XH, Torzilli PA, et al. Thermal modification of collagen. J Shoulder Elbow Surg. 1999 Jul-Aug;8(4):339–44. doi: 10.1016/s1058-2746(99)90157-x. [DOI] [PubMed] [Google Scholar]
- 24.Moran K, Anderson P, Hutcheson J, et al. Thermally induced shrinkage of joint capsule. Clin Orthop Relat Res. 2000 Dec;(381):248–55. doi: 10.1097/00003086-200012000-00029. [DOI] [PubMed] [Google Scholar]
- 25.Kershenobich D, Fierro FJ, Rojkind M. The relationship between the free pool of proline and collagen content in human liver cirrhosis. J Clin Invest. 1970 Dec;49(12):2246–9. doi: 10.1172/JCI106443. [DOI] [PMC free article] [PubMed] [Google Scholar]
- 26.Ritchie J, Warnock JN, Yoganathan AP. Structural characterization of the chordae tendineae in native porcine mitral valves. Ann Thorac Surg. 2005 Jul;80(1):189–97. doi: 10.1016/j.athoracsur.2005.02.011. [DOI] [PubMed] [Google Scholar]
- 27.Kang T, Resar J, Humphrey JD. Heat-induced changes in the mechanical behavior of passive coronary arteries. J Biomech Eng. 1995 Feb;117(1):86–93. doi: 10.1115/1.2792274. [DOI] [PubMed] [Google Scholar]
- 28.Sakuma I, Chui C. Biomechanical System Technology. World Scientific; Nov, 2007. Methods in combined compression and elongation of liver tissue and their application in surgical simulation; p. 56. [Google Scholar]
- 29.Haemmerich D, Ozkan R, Tungjitkusolmun S, et al. Changes in electrical resistivity of swine liver after occlusion and postmortem. Med Biol Eng Comput. 2002 Jan;40(1):29–33. doi: 10.1007/BF02347692. [DOI] [PubMed] [Google Scholar]
- 30.Mark P, Amy Ottensmeyer, Kerdok Robert E, Howe D, et al. The Effects of Testing Environment on the Viscoelastic Properties of Soft Tissues. Medical Simulation, International Symposium, ISMS 2004; Cambridge, MA, USA. 2004. pp. 9–18. [Google Scholar]
- 31.Rosen J, Brown JD, De S, et al. Biomechanical properties of abdominal organs in vivo and postmortem under compression loads. J Biomech Eng. 2008 Apr;130(2):021020. doi: 10.1115/1.2898712. [DOI] [PubMed] [Google Scholar]
- 32.Chui C, Kobayashi E, Chen X, et al. Transversely isotropic properties of porcine liver tissue: experiments and constitutive modelling. Med Biol Eng Comput. 2007 Jan;45(1):99–106. doi: 10.1007/s11517-006-0137-y. [DOI] [PubMed] [Google Scholar]
- 33.Andreano A, Brace CL. A Comparison of Direct Heating During Radiofrequency and Microwave Ablation in Ex Vivo Liver. Cardiovasc Intervent Radiol. 2012 May 10; doi: 10.1007/s00270-012-0405-1. [DOI] [PMC free article] [PubMed] [Google Scholar]
- 34.Ganguli S, Brennan DD, Faintuch S, et al. Immediate renal tumor involution after radiofrequency thermal ablation. J Vasc Interv Radiol. 2008 Mar;19(3):412–8. doi: 10.1016/j.jvir.2007.10.024. [DOI] [PubMed] [Google Scholar]
- 35.Sommer CM, Sommer SA, Mokry T, et al. Quantification of Tissue Shrinkage and Dehydration Caused by Microwave Ablation: Experimental Study in Kidneys for the Estimation of Effective Coagulation Volume. J Vasc Interv Radiol. 2013 Jun 20; doi: 10.1016/j.jvir.2013.04.008. [DOI] [PubMed] [Google Scholar]
- 36.Kroger T, Patz T, Altrogge I, et al. Fast Estimation of the Vascular Cooling in RFA Based on Numerical Simulation. Open Biomed Eng J. 4:16–26. doi: 10.2174/1874120701004020016. [DOI] [PMC free article] [PubMed] [Google Scholar]
- 37.McCreedy ES, Cheng R, Hemler PF, et al. Radio frequency ablation registration, segmentation, and fusion tool. IEEE Trans Inf Technol Biomed. 2006 Jul;10(3):490–6. doi: 10.1109/titb.2006.872076. [DOI] [PMC free article] [PubMed] [Google Scholar]
- 38.Villard C, Soler L, Papier N, et al. RF-Sim: a treatment planning tool for radiofrequency ablation of hepatic tumors. Proceedings Seventh International Conference on Information Visualization - IV 2003 - International Conference on Computer Visualization and Graphics Applications 2003; pp. 561–566. [Google Scholar]
- 39.Sun S, Gao S, Kondabagil K, et al. Structure and function of the small terminase component of the DNA packaging machine in T4-like bacteriophages. Proc Natl Acad Sci U S A. 2012 Jan 17;109(3):817–22. doi: 10.1073/pnas.1110224109. [DOI] [PMC free article] [PubMed] [Google Scholar]


