

Abstract
“Gain-of-function” and “loss-of-function” studies in human cancer cells and analysis of a transgenic mouse model have convincingly established that AEG-1/MTDH/LYRIC performs a seminal role in regulating proliferation, invasion, angiogenesis, metastasis, and chemoresistance, the salient defining hallmarks of cancer. These observations are strongly buttressed by clinicopathologic correlations of AEG-1/MTDH/LYRIC expression in a diverse array of cancers distinguishing AEG-1/MTDH/LYRIC as an independent biomarker for highly aggressive metastatic disease with poor prognosis. AEG-1/MTDH/LYRIC has been shown to be a marker predicting response to chemotherapy, and serum anti-AEG-1/MTDH/LYRIC antibody titer also serves as a predictor of advanced stages of aggressive cancer. However, inconsistent findings have been reported regarding the localization of AEG-1/MTDH/LYRIC protein in the nucleus or cytoplasm of cancer cells and the utility of nuclear or cytoplasmic AEG-1/MTDH/LYRIC to predict the course and prognosis of disease. This chapter provides a comprehensive analysis of the existing literature to emphasize the common and conflicting findings relative to the clinical significance of AEG-1/MTDH/LYRIC in cancer.
1. INTRODUCTION
Astrocyte elevated gene-1 (AEG-1) was first cloned in 2002 as an HIV- and TNF-α-inducible gene in primary human fetal astrocytes (Kang et al., 2005; Su et al., 2002). Subsequently, in vivo phage screening allowed the cloning of the mouse gene as a protein mediating metastasis of breast cancer cells to lung and was named metadherin (MTDH) (Brown & Ruoslahti, 2004). The mouse/rat gene was also cloned as a tight junction protein named LYsine-RIch CEACAM1 coisolated (LYRIC) and by gene trapping techniques as an endoplasmic reticulum (ER)/nuclear envelop protein and was named 3D3/LYRIC (Britt et al., 2004; Sutherland, Lam, Briers, Lamond, & Bickmore, 2004). Human AEG-1/MTDH/LYRIC mRNA encodes a single-pass transmembrane protein of predicted molecular mass of ~64 kDa and pI of 9.3 (Kang et al., 2005). It is a highly basic protein rich in lysines. There is an N-terminal transmembrane domain and three putative nuclear localization signals in AEG-1/MTDH/LYRIC.
Expression analysis revealed that AEG-1/MTDH/LYRIC is a unique protein that is overexpressed in all cancers studied to date (Sarkar et al., 2009; Yoo, Emdad, et al., 2011). The spectrum of cancers analyzed includes all organs and tissues belonging to all biological systems. AEG-1/MTDH/LYRIC expression gradually increases as the disease process progresses, and AEG-1/MTDH/LYRIC expression level clearly correlates with adverse patient prognosis. Overexpression of AEG-1/MTDH/LYRIC augments proliferation, migration, invasion, angiogenesis, chemoresistance, and metastasis, while inhibition of AEG-1/MTDH/LYRIC abrogates the above-mentioned phenotypes indicating a pivotal role of AEG-1/MTDH/LYRIC in regulating tumorigenesis (Sarkar et al., 2009; Yoo, Emdad, et al., 2011).
Multiple mechanisms underlie AEG-1/MTDH/LYRIC overexpression in cancers. AEG-1/MTDH/LYRIC is transcriptionally regulated by c-Myc, which is located downstream of Ha-ras and PI3K pathways (Lee, Su, Emdad, Sarkar, & Fisher, 2006). As such, activation or increase in any of these three components will lead to AEG-1/MTDH/LYRIC over-expression. The AEG-1/MTDH/LYRIC gene is located at chromosome 8q22, which is a center of activity for genomic amplification in multiple cancers. Indeed, genomic amplification of AEG-1/MTDH/LYRIC has been detected in breast and liver cancers (Hu et al., 2009; Yoo, Emdad, et al., 2009). AEG-1/MTDH/LYRIC is regulated by multiple tumor suppressor miRNAs, miR-375, miR-136, and miR-26a, which are downregulated in several cancers (He et al., 2012; Hui et al., 2011; Nohata et al., 2011; Yang et al., 2012; Zhang et al., 2011). Cytoplasmic polyadenylation element-binding protein-1 binds to the 3′-UTR of AEG-1/MTDH/LYRIC mRNA and increases its translation in glioma cells (Kochanek & Wells, 2013). Monoubiquitination of AEG-1/MTDH/LYRIC protein increases its stabilization and cytoplasmic accumulation in cancer cells (Srivastava et al., 2012; Thirkettle et al., 2009). These diverse mechanisms ensure that AEG-1/MTDH/LYRIC is overexpressed in all cancers (Fig. 2.1), thereby permitting AEG-1/MTDH/LYRIC to serve as an important participant in aggressive progression of cancers.
Figure 2.1.
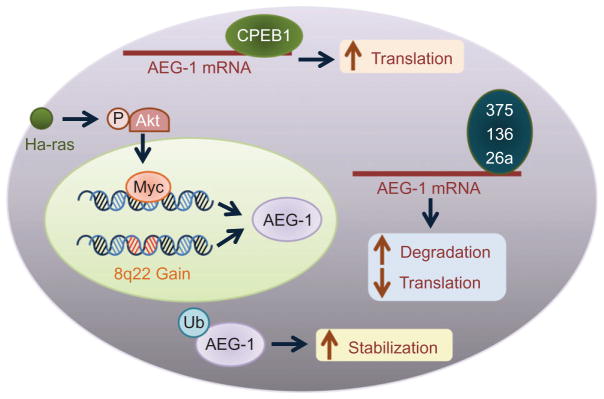
Molecular mechanism of AEG-1/MTDH/LYRIC overexpression in cancer. Genomic amplification (8q22 gain) leading to increased AEG-1/MTDH/LYRIC expression has been documented in breast and liver cancers. Activation of Ha-ras results in activation of PI3K/Akt and subsequent binding of c-Myc to AEG-1/MTDH/LYRIC promoter increasing transcription. Monoubiquitination of AEG-1/MTDH/LYRIC protein in cancer cells leads to increased stabilization and cytoplasmic accumulation. AEG-1/MTDH/LYRIC mRNA is posttranscriptionally regulated by several tumor suppressor mRNAs, such as miR-375, miR-136, and miR-26a, which are downregulated in multiple cancers. Cytoplasmic polyadenylation element-binding protein 1 (CEBP1) binds to the 3′-UTR of AEG-1/MTDH/LYRIC mRNA and promotes its translation in glioma cells.
A literature search using AEG-1/MTDH/LYRIC as a key word identifies 114 papers, a large number of which analyze the clinical significance of AEG-1/MTDH/LYRIC overexpression in cancers. Indeed, more papers are devoted to analyzing AEG-1/MTDH/LYRIC expression profile and its clinicopathological significance rather than scrutinizing the molecular mechanism(s) of AEG-1/MTDH/LYRIC function. These studies have firmly established the importance of AEG-1/MTDH/LYRIC in regulating cancer progression and metastasis, which is reflected in the inclusion of AEG-1/MTDH/LYRIC in MammaPrint early metastasis risk assessment assay (http://www.agendia.com/pages/mammaprint/21.php). Mamma-Print is the first and only FDA-approved individualized metastasis risk assessment assay for breast cancer that includes a unique 70-gene signature, and AEG-1/MTDH/LYRIC is included in this gene signature. The present review provides a comprehensive synopsis of the clinicopathological correlation studies on AEG-1/MTDH/LYRIC stressing the relevant features in each cancer indication.
2. GASTROINTESTINAL SYSTEM
2.1. Colorectal cancer
Colorectal cancer (CRC) is the third most common cancer and the fourth most common cause of cancer-related deaths worldwide with about 600,000 estimated deaths annually (Ferlay et al., 2010). Several studies have been performed in CRC patients to analyze the clinical significance of AEG-1/MTDH/LYRIC. Song, Li, Li, and Geng (2010) analyzed by immunohistochemistry (IHC) Formalin-fixed paraffin-embedded (FFPE) sections of low-grade adenoma (n=31), high-grade adenoma (n=15), colorectal carcinoma (n=146), and normal colorectal mucosa (n=45). Additionally, tissues with hepatic (n=10), pulmonary (n=2), and lymph node (n=250) metastases were included. None of these patients received chemo- or radiotherapy prior to surgery. Based on the Union Internationale Centre le Cancer (UICC) classification, among the CRC patients, 42 were stage I, 38 were stage II, 54 were stage III, and 12 were stage IV. While weak to no AEG-1/MTDH/LYRIC expression was detected in normal mucosa, the expression of this protein gradually increased from low-grade adenoma to high-grade adenoma with the highest expression being detected in CRC. In normal mucosa and adenoma, AEG-1/MTDH/LYRIC expression was cytoplasmic, while in CRC samples as well as in pulmonary metastases, overexpressed AEG-1/MTDH/LYRIC was detected in the nucleus. In CRC patients, stage III/IV patients showed higher nuclear AEG-1/MTDH/LYRIC staining compared to stage I/II patients (46.67% vs. 24.32%, respectively; p=0.037). Statistical analysis revealed that in CRC patients, AEG-1/MTDH/LYRIC expression correlated significantly with UICC stage, TNM classification, Ki-67 expression, and histological differentiation. No statistical correlation was observed with age, gender, tumor location, and size. A significant correlation was observed between AEG-1/MTDH/LYRIC expression level and the shorter overall survival (OS) time of CRC patients (p<0.001) with a correlation coefficient of −0.380. The 5-year cumulative survival rate was 73.4% in low AEG-1/MTDH/LYRIC-expressing group, while it was 41.5% in high AEG-1/MTDH/LYRIC-expressing group. These findings indicate that AEG-1/MTDH/LYRIC might be a significant prognostic factor for CRC patients.
Zhang et al. (2012) performed a similar IHC-based study in 120 pairs of CRC and adjacent nontumor tissue (ANT) and 60 samples of lymph node metastases of CRC tissues. High AEG-1/MTDH/LYRIC expression was detected in 54 CRC samples (45%) and 13 ANT samples (10.8%). AEG-1/MTDH/LYRIC expression was significantly higher in CRC with lymph node metastasis versus CRC without lymph node metastasis (p<0.001). Nuclear accumulation of β-catenin, a downstream AEG-1/MTDH/LYRIC molecule, was observed in 62% CRC and 0% ANT samples and showed positive statistical correlation with high AEG-1/MTDH/LYRIC expression (p<0.001).
Jiang et al. analyzed tumor tissues, matched normal tissues, and liver metastasis specimens from 520 CRC cases for AEG-1/MTDH/LYRIC expression Jiang, Zhu, Zhu, and Piao (2012). Among the 520 cases, 37 (7.12%), 204 (39.23%), 262 (50.38%), and 17 (3.27%) were with Duke’s A, B, C, and D clinical-stage tumors, respectively. AEG-1/MTDH/LYRIC mRNA and protein expressions were significantly higher in CRC compared to matched normal tissues and in patients with liver metastases compared to those without liver metastases. However, the overexpressed AEG-1/MTDH/LYRIC protein was detected in the cytoplasm and membrane but not in the nucleus. A positive correlation was observed between AEG-1/MTDH/LYRIC expression and age, Duke’s stage, and distant metastasis (p=0.001, 0.001, and 0.016, respectively), but not with gender and histological grade. A separate set of 56 patients with postoperative distant metastases was also analyzed. Among these patients, 48 (88.89%) developed liver metastases in which 58.33% showed positive AEG-1/MTDH/LYRIC expression (p=0.016). High AEG-1/MTDH/LYRIC expression was an independent prognostic marker for shorter OS. The significant finding of this study is the identification of AEG-1/MTDH/LYRIC as a determinant of liver metastases of CRC.
Gnosa et al. (2012) analyzed AEG-1/MTDH/LYRIC mRNA expression by qPCR in primary tumor and adjacent normal mucosa from 156 CRC patients, and AEG-1/MTDH/LYRIC protein expression by IHC in 74 distant normal colorectal mucosa, 107 adjacent normal colorectal mucosa, 158 primary CRC, 35 lymph node metastases, and 9 liver metastases. The mean level of AEG-1/MTDH/LYRIC mRNA was 371.56±348.37 in the primary tumor and 214.98±156.39 in the adjacent normal mucosa in 156 patients (p=0.0005). AEG-1/MTDH/LYRIC protein expression was significantly higher in primary CRC when compared to either adjacent or distant normal mucosa. Interestingly, both high cytoplasmic and nuclear AEG-1/MTDH/LYRIC expressions were detected in CRC patients. Even though AEG-1/MTDH/LYRIC expression in lymph node metastases showed a higher trend compared to that in primary tumors, the difference was not statistically significant. However, both cytoplasmic and nuclear AEG-1/MTDH/LYRIC expressions in liver metastases were significantly higher than that in primary tumors and lymph node metastases. Interestingly, AEG-1/MTDH/LYRIC mRNA expression showed significantly higher expression in rectal cancer patients compared to colon cancer patients (p=0.047). However, this study did not find any correlation between AEG-1/MTDH/LYRIC protein expression and other clinicopathological variables, such as age, gender, location, differentiation, or patient survival. In primary tumors, both cytoplasmic and nuclear AEG-1/MTDH/LYRIC protein expression correlated with phosphorylated NF-κB (Ser 536), p73, and Rad50 with statistical significance. Cytoplasmic, but not nuclear, AEG-1/MTDH/LYRIC showed association with increased apoptosis as determined by TUNEL assay and it was speculated that AEG-1 might be involved in DNA damage-induced apoptosis which is mediated by p73. However, this hypothesis requires experimental validation to establish its significance in colorectal carcinogenesis.
Although these studies authenticate the importance of AEG-1/MTDH/LYRIC in promoting tumorigenesis and metastasis in CRC patients, one disconcerting observation is the varied localization of AEG-1/MTDH/LYRIC detected by different investigators. Use of different antibodies recognizing different epitopes of AEG-1/MTDH/LYRIC or experimental technique might be potential reasons as is the case with Jiang et al. and Gnosa et al. who used the same antibody, but reported dissimilar findings. Thus, an optimized IHC protocol needs to be developed that might be universally used by molecular diagnostic laboratories to employ cytoplasmic and/or nuclear AEG-1/MTDH/LYRIC as a diagnostic/prognostic marker for CRC (Table 2.1).
Table 2.1.
AEG-1/MTDH/LYRIC is a diagnostic/prognostic marker for multiple cancers
Multiple studies have identified staphylococcal nuclease domain-containing protein-1 (SND1), a multifunctional protein regulating transcription, mRNA splicing and stability, and miRNA function, as an AEG-1/MTDH/LYRIC-interacting protein (Blanco et al., 2011; Meng et al., 2012; Yoo, Santhekadur, et al., 2011). Coexpression of AEG-1/MTDH/LYRIC and SND1 was analyzed in tumor tissues and adjacent noncancerous tissues in 196 colon cancer patients by IHC (Wang et al., 2012). AEG-1/MTDH/LYRIC and SND1 expression was detected in 149 (76%) and 137 (69.9%) cases, respectively, specifically in the cancer tissue and not in the adjacent normal tissue. Among the 149 AEG-1/MTDH/LYRIC-positive cases, 132 showed positive staining for SND1. Among the 47 AEG-1/MTDH/LYRIC-negative cases, 42 were negative for SND1, suggesting a high consistency of expression of these two proteins in colon cancer, which was statistically significant (r=0.86, p<0.001). Significantly higher AEG-1/MTDH/LYRIC and SND1 expression was detected in cases with aggressive nodal status (N2), late pathological stage, and poor differentiation when compared to N0–N1 nodal status (p=0.02), early pathological stage (p=0.006), and moderate differentiation (p=0.03), respectively. No correlation was observed with age, sex, or tumor status. The 196 patients were divided into four groups based on AEG-1/MTDH/LYRIC and SND1 coexpression: AEG-1-/SND1− (42 cases); AEG-1-/SND1+ (5 cases); AEG-1+/SND1− (17 cases); and AEG-1+/SND1+ (132 cases). AEG-1+/SND1+ status was significantly associated with aggressive nodal status (p=0.02), late pathological stage (p=0.01), poor differentiation (p<0.001), and shorter OS (p=0.01). Indeed, OS in AEG-1-/SND1-cases was significantly longer when compared to the other three groups (p=0.006). Cox multivariate analysis revealed that AEG-1/MTDH/LYRIC and SND1 coexpression negatively correlated with postoperative OS and positively correlated with mortality (p=0.009), indicating that AEG-1/MTDH/LYRIC and SND1 are potential prognostic factors for colon cancer.
2.2. Hepatocellular carcinoma
Hepatocellular carcinoma (HCC) which represents >80% of all primary liver cancers is the fifth most common cancer and the third most common cause of cancer-related deaths worldwide (El-Serag, 2011). Yoo, Emdad, et al. (2009) first analyzed AEG-1/MTDH/LYRIC expression profile at mRNA and protein levels in multiple cohorts of HCC patients. IHC was performed in tissue microarrays (TMA) containing 86 primary HCC, 23 metastatic HCC, and 9 normal adjacent liver samples. Very little to no AEG-1/MTDH/LYRIC immunostaining was detected in the nine normal liver samples, while significant AEG-1/MTDH/LYRIC staining was observed in HCC samples. AEG-1 expression was detected predominantly in the perinuclear region. Among the 109 HCC samples, only 7 scored negative for AEG-1/MTDH/LYRIC and the remaining 102 (93.58%) showed variable levels of AEG-1/MTDH/LYRIC. Expression of AEG-1/MTDH/LYRIC gradually increased with the stages from I to IV as well as with the grades of differentiation from well differentiated to poorly differentiated, and a statistically significant correlation (p<0.0001) was obtained between AEG-1/MTDH/LYRIC expression level and the stage of HCC. Gene expression data from Affymetrix microarray of a separate set of patients, including 132 human samples in various stages of human hepatocarcinogenesis: normal liver (n=10), cirrhotic tissue (n=13), low-grade dysplastic nodules (n=10), high-grade dysplastic nodules (n=8), and HCC (n=91), were analyzed to check AEG-1/MTDH/LYRIC mRNA expression level. Expression of AEG-1/MTDH/LYRIC in hepatitis C virus (HCV)-related HCC was significantly increased in comparison to normal liver and cirrhotic tissue. Mean upregulation in comparison to normal liver and cirrhosis were 1.7 (t-test, p=0.04)- and 1.65 (t-test, p<0.001)-fold increase, respectively. Analysis of DNA copy gain in the AEG-1 locus identified genomic amplification of AEG-1 in 26% of the patients. These studies, however, did not analyze the clinicopathological correlation of AEG-1/MTDH/LYRIC expression in HCC patients.
AEG-1/MTDH/LYRIC expression was assessed by IHC in TMA of 323 HCC patients demonstrating high AEG-1/MTDH/LYRIC expression in 54.2% (175 of 323) of all the patients (Zhu et al., 2011). AEG-1/MTDH/LYRIC expression was closely associated with microvascular invasion (p<0.001), pathologic satellites (p=0.007), tumor differentiation (p=0.002), and TNM stage (p=0.001). Expression of AEG-1/MTDH/LYRIC did not correlate with other clinicopathologic characteristics such as age, gender, liver cirrhosis, serum alpha-fetoprotein, tumor diameter, tumor encapsulation, or BCLC stage. The 1-, 3-, and 5-year OS and cumulative recurrence rates in the whole cohort were 85.4% and 25.4%, 62.2% and 50.2%, 50.7% and 59.7%, respectively. Further, the 1-, 3-, and 5-year OS rates in high AEG-1/MTDH/LYRIC-expressing group were significantly lower than those in low AEG-1/MTDH/LYRIC-expressing group (83.0% vs. 89.7%, 52.0% vs. 75.3%, 37.4% vs. 66.9%, respectively); the 1-, 3-, and 5-year cumulative recurrence rates were markedly higher in the high AEG-1/MTDH/LYRIC-expressing group than those in the low AEG-1/MTDH/LYRIC-expressing group (32.4% vs. 16.8%, 61.2% vs. 38.2%, 70.7% vs. 47.8%, respectively). Univariate and multivariate analyses revealed that along with tumor diameter, encapsulation, microvascular invasion, and TNM stage, AEG-1/MTDH/LYRIC was an independent prognostic factor for both OS (HR=1.870, p<0.001) and recurrence (HR=1.695, p<0.001).
In a separate study, AEG-1/MTDH/LYRIC expression levels were identified to be elevated in HBV-related HCC tissues (n=73) compared to normal liver tissues (n=11) and hepatitis samples (n=45) (Gong et al., 2012). AEG-1/MTDH/LYRIC expression significantly correlated with the American Joint Committee on Cancer (AJCC, 7th edition) stage (p=0.020), T classification (p=0.007), N classification (p=0.044), vascular invasion (p=0.006), and histological differentiation (p=0.020) in the HBV-related HCC patients. In addition, patients with high AEG-1/MTDH/LYRIC levels had shorter survival times compared to those with low AEG-1/MTDH/LYRIC expression (p=0.001).
The gene expression profiles of HBV-HCC and HCV-HCC show significant differences. The identification of AEG-1/MTDH/LYRIC over-expression in both HBV-HCC and HCV-HCC cases suggests that AEG-1/MTDH/LYRIC might be a useful biomarker for HCC irrespective of its etiology.
2.3. Gastric cancer
Gastric cancer is the fourth most frequent malignancy in the world and is common in Asian countries, such as China, Japan, and Korea (Chan, Wong, & Lam, 2001). AEG-1/MTDH/LYRIC expression was analyzed in 105 cases of gastric cancer by IHC (Jian-Bo et al., 2011). Overexpression of AEG-1 was detected in 66 patients mainly in the cytoplasm. In cancerous tissue, AEG-1/MTDH/LYRIC expression intensity score was three or higher, while in the adjacent noncancerous tissue, the corresponding score was 0–2. AEG-1/MTDH/LYRIC expression strongly correlated with the clinical stages of the disease (p<0.01) and T (p<0.01), N (p<0.01), and M (p<0.05) classifications indicating that advanced clinical stage is associated with AEG-1/MTDH/LYRIC overexpression. The proliferation marker Ki-67 correlated with AEG-1/MTDH/LYRIC expression (p<0.01) indicating that AEG-1/MTDH/LYRIC might promote tumor growth. The median overall 5-year survival rate was 23 months in patients with AEG-1/MTDH/LYRIC overexpression versus 38 months in AEG-1/MTDH/LYRIC-negative patients (p<0.001). In multivariate analysis, TNM stage, lymph node metastasis, and AEG-1/MTDH/LYRIC over-expression were associated with poor OS thus suggesting that AEG-1/MTDH/LYRIC might be a prognostic marker for gastric cancer.
Another independent study analyzed AEG-1/MTDH/LYRIC expression in 30 paired gastric tumoral and nontumoral tissue samples of Iranian patients by qRT-PCR (Baygi & Nikpour, 2012). Although overall AEG-1/MTDH/LYRIC expression was higher in tumor tissue compared to normal tissue (p=0.05), a significant heterogeneity was observed in the level of expression. In 46.6% cases, AEG-1/MTDH/LYRIC expression was higher, while in 36.6% cases, the expression was lower in the tumor tissue versus the nontumor tissue. No statistically significant association was observed between AEG-1/MTDH/LYRIC expression and the grades and types of tumor. This apparent lack of importance of AEG-1/MTDH/LYRIC in gastric cancer might be due to a number of reasons. AEG-1/MTDH/LYRIC expression at the protein level is much higher in tumor tissue versus normal tissue when compared to AEG-1/MTDH/LYRIC expression at the mRNA level suggesting that posttranscriptional regulation might be more important than genomic amplification or transcriptional regulation to confer AEG-1/MTDH/LYRIC overexpression. Regulation of AEG-1/MTDH/LYRIC by multiple tumor suppressor miRNAs and cancer-specific stabilization of AEG-1/MTDH/LYRIC protein by monoubiquitination further stress this notion (He et al., 2012; Hui et al., 2011; Nohata et al., 2011; Srivastava et al., 2012; Thirkettle et al., 2009; Yang et al., 2012; Zhang et al., 2011). As such, simultaneous analysis of AEG-1/MTDH/LYRIC at both mRNA and protein levels is necessary to get a comprehensive picture of the expression pattern. A racial difference in AEG-1/MTDH/LYRIC expression might also be an issue.
2.4. Esophageal cancer
Esophageal cancer is a highly aggressive cancer of the gastrointestinal tract and is the sixth most common cause of cancer-related deaths worldwide (Kamangar, Dores, & Anderson, 2006). Esophageal cancer is typically either esophageal squamous cell cancer (ESCC) or adenocarcinoma, the former more prevalent in Asian countries (Hiyama, Yoshihara, Tanaka, & Chayama, 2007). AEG-1/MTDH/LYRIC was evaluated as a biomarker for ESCC by IHC of FFPE sections in 168 patients that include 9 cases of stage I, 73 cases of stage IIa, 14 cases of stage IIb, 62 cases of stage III, and 10 cases of stage IV cancer (Yu et al., 2009). AEG-1/MTDH/LYRIC protein expression was detected in 156 cases (92.9%) and was upregulated when compared to adjacent normal esophageal tissues. AEG-1/MTDH/LYRIC expression strongly correlated with clinical staging (p=0.001), T (p=0.002), N (p=0.034), M (p=0.021) classifications, and histological differentiation (p=0.035), which was confirmed by Spearman correlations. The cumulative 5-year survival rate in low AEG-1/MTDH/LYRIC-expressing patients was 40.7% (95% confidence interval, 0.5095–0.3044) versus 22.6% in high AEG-1/MTDH/LYRIC-expressing patients (95% confidence interval, 0.3177–0.1343). AEG-1/MTDH/LYRIC expression levels inversely correlated with OS time (p=0.001) establishing AEG-1/MTDH/LYRIC as a potential prognostic biomarker. One interesting finding in this study, which was not observed in other studies, is statistically significant (p=0.041) higher AEG-1/MTDH/LYRIC expression in male ESCC patients compared to female patients. The molecular mechanism of male-specific overexpression and the potential implications of this observation remain to be determined.
2.5. Gallbladder carcinoma
Gallbladder carcinoma (GBC) is the most common malignancy of the biliary tract and the fifth most common malignancy of the digestive tract (Miller & Jarnagin, 2008). The 5-year survival rate of GBC after surgery is 0–10%, thus making it a leading cause of cancer-related deaths (Malka et al., 2004). AEG-1/MTDH/LYRIC expression was detected by IHC in 41 GBC, 10 adenomas, and chronic or acute cholecystitis samples (Sun et al., 2011). Weak or negative AEG-1/MTDH/LYRIC expression was observed in normal gallbladder mucosa. The frequency and intensity of AEG-1/MTDH/LYRIC expression gradually increased from normal mucosa to adenoma to GBC. AEG-1/MTDH/LYRIC overexpression was detected in 26 of 41 GBC (63.4%) patients (p=0.0003 vs. cholecystitis). While no nuclear AEG-1/MTDH/LYRIC staining was observed in normal mucosa or adenomas, overexpressed AEG-1/MTDH/LYRIC was detected in the nucleus. Increased AEG-1/MTDH/LYRIC expression correlated with differentiation degree (p=0.0259), Nevin stage (p=0.0339), liver infiltration (p=0.0328), and Ki-67 expression (p=0.0032). However, no correlation was observed between AEG-1/MTDH/LYRIC level and age, gender, tumor location, tumor size, venous invasion, lymph node metastasis, or pathological type. AEG-1/MTDH/LYRIC was identified as an independent prognostic factor for OS rate of GBC patients by the Cox proportional hazards model. The mean survival time for high and low AEG-1/MTDH/LYRIC-expressing GBC patients was 21 and 37.1 months, respectively (p=0.008). The cumulative 1-, 3-, and 5-year OS rates were 57.7%, 19.2%, and 3.8% in the high AEG-1/MTDH/LYRIC-expressing group versus 80%, 53.3%, and 33.3% in low AEG-1/MTDH/LYRIC-expressing group. Although the clinicopathological findings of this study are similar to studies in other cancers, two interesting differences were observed. First, AEG-1/MTDH/LYRIC levels did not correlate with lymph node metastases, even though in other cancers AEG-1/MTDH/LYRIC is a primary determinant of metastasis. Second, the overexpressed AEG-1/MTDH/LYRIC was detected in the nucleus, while in the majority of other cancers, it is detected in the cytoplasm and in the cell membrane. Whether the nuclear AEG-1/MTDH/LYRIC preferentially regulates any signaling pathways or gene expression in GBC patients remains to be determined.
A second study analyzed 108 GBC patient samples, including 36 well-differentiated adenocarcinoma, 31 moderately differentiated adenocarcinomas, 30 poorly differentiated adenocarcinomas, and 11 mucinous adenocarcinomas, and 96 benign samples that included 46 peritumoral tissues from the 108 GBC patients, 15 gallbladder polyps, and 35 chronic cholecystitis cases (Liu & Yang, 2011). Among the 46 peritumoral tissues, 10 were normal, while 10, 12, and 14 cases showed mild, moderate, or severe dysplasia, respectively. Among the 35 chronic cholecystitis cases, 11 were considered as normal, while 12, 7, and 5 cases showed mild, moderate, or severe dysplasia, respectively. The expression of AEG-1/MTDH/LYRIC and another marker EphA7 was analyzed by IHC. Compared to the peritumoral tissues, polyps, and chronic cholecystitis, significantly increased AEG-1/MTDH/LYRIC and EphA7 expression was detected in GBC (p<0.01). Those benign cases showed that expression of AEG-1/MTDH/LYRIC and EphA7 also showed moderate to severe dysplasia. Among the 57 EphA7 positive GBC cases, 43 showed positive expression of AEG-1/MTDH/LYRIC, while among the 51 EphA7 negative cases, 32 were negative for AEG-1/MTDH/LYRIC (χ2=13.11, p<0.001), suggesting a concordant expression pattern of these two markers. AEG-1/MTDH/LYRIC and EphA7 expression was lower in well-differentiated cases with small tumor size (<2 cm), no lymph node metastasis, and no invasion compared to poorly differentiated cases with large tumor size (>2 cm), lymph node metastasis, and invasion into surrounding tissues and organs (p<0.05). No correlation was observed with mucinous adenocarcinoma or with sex, age, or history of gallstones. Survival information was available for 67 out of 108 GBC patients. Among these 67 patients, 37 and 34 patients showed positive AEG-1/MTDH/LYRIC and EphA7 expression, respectively. The average survival time in EphA7 and AEG-1/MTDH/LYRIC positive cases was 8.1 months when compared to 13.2 months in EphA7 and AEG-1/MTDH/LYRIC-negative cases (p<0.001). Cox multivariate analysis revealed that tumor size (>2 cm), lymph node metastasis, invasion as well as AEG-1/MTDH/LYRIC and EphA7 expression levels were negatively correlated with postoperative survival and positively correlated with mortality, suggesting that AEG-1/MTDH/LYRIC and EphA7 might be prognostic factors for GBC.
3. GENITOURINARY SYSTEM
3.1. Breast cancer
Breast cancer is the second most frequent cancer in the world and the first most commonly diagnosed cancer, and the first leading cause of cancer-related deaths in women in the United States (Ferlay et al., 2010; Siegel, Naishadham, & Jemal, 2012). Although the role of AEG-1/MTDH/LYRIC in breast cancer metastasis was first reported by Brown and Ruoslahti (2004) using mouse models, Li et al. (2008) first demonstrated the clinical significance of AEG-1/MTDH/LYRIC overexpression in breast cancer. The study was performed by IHC using FFPE sections of 225 breast cancer patients, including 28, 98, 66, and 33 cases of stage I, II, III, and IV, respectively, and 9 cases of matched lung or liver metastases. AEG-1/MTDH/LYRIC expression was detected in 210 of 225 (93.3%) cases. While AEG-1/MTDH/LYRIC expression was marginally detectable in normal breast tissue and in the adjacent noncancerous tissues in all tumor sections, high levels of expression were detected in areas containing cancer cells in primary breast tumors as well as metastatic tumors. More intense staining was detected in hepatic metastases derived from patients with late relapses than that in the paired primary breast tumors. In the primary breast cancer cells, AEG-1/MTDH/LYRIC staining was detected mostly in the cytoplasm, while metastatic tumors showed a high percentage of nuclear staining. AEG-1/MTDH/LYRIC expression level showed statistical correlation with advanced clinical staging (p=0.001) as well as T (p=0.004), N, (p=0.026), and M (p=0.001) classifications. Higher levels of AEG-1/MTDH/LYRIC expression were associated with shorter survival time (p<0.001 with a correlation coefficient of −0.304). The cumulative 5-year survival rate was 75.7% in the low AEG-1/MTDH/LYRIC expression group (95% confidence interval, 0.773–0.857), while it was only 45.1% in the high AEG-1/MTDH/LYRIC expression group (95% confidence interval, 0.377–0.581). AEG-1/MTDH/LYRIC was recognized as an independent prognostic marker for breast cancer using multivariate survival analysis. However, no correlation was observed between the level of AEG-1/MTDH/LYRIC and that of estrogen receptor, progesterone receptor, and ErbB2 in these patients. In a follow-up study, the authors demonstrated a significant correlation between AEG-1/MTDH/LYRIC and Ki-67 levels (p=0.003) in the same breast cancer patients indicating involvement of AEG-1/MTDH/LYRIC in highly proliferative breast cancers (Li et al., 2009).
Hu et al. (2009) who first identified 8q22 gain, resulting in AEG-1/MTDH/LYRIC expression, to confer chemoresistance and metastasis in breast cancer, analyzed 170 patient samples by IHC, out of which 47% showed moderate to high level of AEG-1/MTDH/LYRIC staining. Although AEG-1/MTDH/LYRIC overexpression did not show any correlation with any specific breast tumor subtype based on HER2 status, triple marker status (ER/PR/HER2), or the basal epithelial cell marker C5/6 status, a significant association was observed with a higher risk of metastasis (p=0.0058) and shorter survival time (p=0.0008). Univariate survival analysis employing the Cox proportional hazard model demonstrated strong association between high AEG-1/MTDH/LYRIC level with higher hazard ratio (HR) and worse clinical outcome (HR=3.7, p=0.01 for metastasis; HR=8.3, p=0.005 for cancer-related death). Interestingly, not all patients showing high levels of AEG-1/MTDH/LYRIC expression presented with corresponding gains in 8q22 with 12% of samples having normal DNA copy number of AEG-1/MTDH/LYRIC but still showing high-level expression at the protein level. However, the association of AEG-1/MTDH/LYRIC with poor survival outcome was observed in all samples with AEG-1/MTDH/LYRIC overexpression, independent of 8q22 gain or alternative mechanisms of activation. More importantly, a multivariate analysis confirmed that AEG-1/MTDH/LYRIC might be a prognostic marker, independent of other clinicopathologic parameters including ER, PR, HER2, p53 status, and size of the primary tumor at the time of diagnosis. A multivariate Cox analysis combining all these parameters with AEG-1/MTDH/LYRIC expression showed that the hazards of metastasis were significantly higher with AEG-1/MTDH/LYRIC expression (p=0.023) even when all the other factors were considered.
IHC was used to analyze AEG-1/MTDH/LYRIC expression in 249 patients including 29 with ductal hyperplasia (UDH) without atypia, 14 atypical ductal hyperplasia (ADH), 37 ductal carcinoma in situ (DCIS) including 15 low-grade, 7 intermediate-grade, and 15 high-grade patients, 162 invasive ductal carcinomas, and 7 normal breast tissues from reduction mammoplasty (Su et al., 2010). AEG-1/MTDH/LYRIC overexpression was detected in 24.14% cases of UDH, 28.57% cases of ADH, 72.97% cases of DCIS, and 55.56% cases of invasive breast cancer with no overexpression detected in normal breast tissue. The observation that AEG-1/MTDH/LYRIC expression is detected in higher percentage of DCIS patients compared to invasive cancer suggests that AEG-1/MTDH/LYRIC might be involved in initiation of ductal carcinoma which contradicts with other studies indicating higher AEG-1/MTDH/LYRIC expression in metastatic lesions compared to the primary tumors. In DCIS patients, no correlation was observed between AEG-1/MTDH/LYRIC expression with that of ER, PR, and HER2. However, a significant correlation was observed with Ki-67 expression (p=0.008) as well as histologically high-grade tumors (p=0.035). However, in invasive cancer patients, AEG-1/MTDH/LYRIC expression strongly correlated with the patients’ age (p=0.042), Ki-67 status (p=0.036), ER status (p=0.018), and p53 status (p=0.001), which were not observed in previous studies.
Triple-negative breast cancer is characterized by a lack of expression or ER, PR, and HER2 and carries a poor prognosis (Li, Li, et al., 2011). AEG-1/MTDH/LYRIC expression analysis was carried out in 125 cases of triple-negative invasive breast cancer that included 25 stage I, 71 stage II, and 29 stage III cases. A major focus of this study was to analyze association of AEG-1/MTDH/LYRIC with angiogenesis, which was checked by staining for VEGF and for CD34 that denotes microvascular density (MVD). Among the 125 cases, 71 (56.8%) showed high AEG-1/MTDH/LYRIC expression out of which 54 cases showed high VEGF expression, thus exhibiting strong statistical correlation (p<0.001). When analyzing MVD, 59 cases out of 125 showed high MVD and 42 cases of these high-MVD patients also showed high AEG-1/MTDH/LYRIC expression again demonstrating significant statistical correlation (p=0.002). Kaplan–Meyer 5-year survival curve analysis revealed that poor disease-free survival and OS were associated with high AEG-1/MTDH/LYRIC and VEGF levels.
3.2. Ovarian and endometrial cancer
Epithelial ovarian cancer (EOC) is the most lethal gynecological cancer in Western countries (Siegel et al., 2012). The peritoneal cavity is the most common site of metastatic spread and recurrence of EOC (Kikkawa et al., 1994). Li, Liu, et al. (2011) studied AEG-1/MTDH/LYRIC expression in 157 patients with EOC using IHC in FFPE sections. These cases included 49 patients with lymph node metastasis and 128 patients with peritoneal dissemination. In addition, 25 normal ovaries from hysterectomy specimens resected for nonovarian disease were analyzed. Normal ovaries showed little to no AEG-1/MTDH/LYRIC expression. Low AEG-1/MTDH/LYRIC expression was detected in 25 EOC samples (35.7%) without peritoneal metastasis and 62 (88.6%) samples without lymph node metastasis. However, 83 samples (64.8%) with peritoneal metastasis and 41 samples (83.7%) with lymph node metastasis exhibited high AEG-1/MTDH/LYRIC expression. The intensity and frequency of AEG-1/MTDH/LYRIC staining gradually increased from primary lesions to peritoneal dissemination and lymph node metastases in the same patient (25 cases). AEG-1/MTDH/LYRIC expression correlated with FIGO stage (p=0.0011), histopathological differentiation (p=0), and residual tumor size (p<0.0001). A multivariate logistic regression analysis revealed that ascites (p<0.0001; odds ratio 12.613; 95% confidence interval 3.148–28.517) and AEG-1/MTDH/LYRIC expression (p=0.0017; odds ratio 8.541; 95% confidence interval 2.561–37.461) were associated with peritoneal dissemination, and a positive correlation was observed between lymph node metastasis and AEG-1/MTDH/LYRIC expression (p<0.0001; odds ratio 9.581; 95% confidence interval 2.613–23.214).
Ovarian serous carcinoma is the most common type of ovarian cancer (Siegel et al., 2012). AEG-1/MTDH/LYRIC expression was analyzed by IHC in FFPE sections of 101 patients with stages II–IV ovarian serous carcinomas and 25 normal ovarian tissues (Li et al., 2012). Weak to no AEG-1/MTDH/LYRIC staining was detected in normal ovarian tissues. The intensity and frequency of AEG-1/MTDH/LYRIC staining was significantly higher in chemoresistant (to cisplatin) patients than that in chemosensitive patients (p<0.0001). AEG-1/MTDH/LYRIC expression correlated with poor differentiation (p=0.0182), lymph node metastasis (p=0.0021), and higher residual disease volume (p<0.001). Median progression-free survival and OS were 30.4 months and 35.28 months, respectively, in high AEG-1/MTDH/LYRIC expression group versus 63.6 months and >50 months in low AEG-1/MTDH/LYRIC expression group (p<0.001). A multivariate logistic regression analysis identified AEG-1/MTDH/LYRIC expression status is an independent factor in predicting a poor likelihood of response to chemotherapy (cisplatin) treatment (p=0.0001). Multiple studies have shown that overexpression of AEG-1/MTDH/LYRIC confers marked chemoresistance to the cells. This study establishes those observations by correlating AEG-1 expression with sensitivity of patients to chemotherapy, thus providing another aspect of using AEG-1/MTDH/LYRIC as a biomarker.
Endometrial cancer is the most common cancer of the female genital tract and typically a disease of postmenopausal women (Siegel et al., 2012). The disease is usually diagnosed early with a 5-year survival rate of more than 80% (van Wijk, van der Burg, Burger, Vergote, & van Doorn, 2009). However, there are a group of patients presenting with recurrence and metastasis for which a biomarker needs to be developed for properly assessing the prognosis of the disease. AEG-1/MTDH/LYRIC expression was analyzed by IHC in FFPE sections in 174 endometrial cancer patients that included 161 cases of endometroid carcinoma, 8 cases of serous carcinoma, and 5 cases of clear cell carcinoma (Song, Li, Lu, Zhang, & Geng, 2010). In addition, tissues from 35 healthy patients were used as control. AEG-1/MTDH/LYRIC staining gradually increased from normal to atypical hyperplasia and was highest in endometrial cancer (p<0.001). Advanced and invasive tumors showed nuclear AEG-1/MTDH/LYRIC staining. AEG-1/MTDH/LYRIC expression correlated with FIGO stage (p<0.001), depth of myometrial invasion (p=0.015), lymph node metastasis (p=0.005), lymph vascular space invasion (p<0.001), recurrence (p<0.001), and Ki-67 expression (p=0.032). Mean OS and disease-free survival (DFS) were 74 months and 72 months, respectively, in low AEG-1/MTDH/LYRIC-expressing group compared to 58 months and 54 months, respectively, in high AEG-1/MTDH/LYRIC-expressing group (p<0.001). AEG-1/MTDH/LYRIC was identified as an independent prognostic factor for poor OS and DFS by multivariate analysis.
3.3. Prostate cancer
Prostate cancer is the most frequent cancer and the second most common cause of cancer-associated death in men in the United States (Siegel et al., 2012). AEG-1/MTDH/LYRIC expression was analyzed by IHC in TMA containing 63 benign prostatic hyperplasia (BPH) and 143 prostate cancer samples. Additionally, 11 bone metastasis of prostate cancer patients were analyzed (Thirkettle et al., 2009). All tissues showed some AEG-1/MTDH/LYRIC staining. In benign tissues, predominantly nuclear AEG-1/MTDH/LYRIC staining was observed. Interestingly, tumor tissues showed low-level nuclear staining; however, nucleolar staining was observed in tumor tissues, which was not observed in benign tissues. When compared to normal bone, 9 of 11 bone metastases showed an increased expression of AEG-1/MTDH/LYRIC, which was detected exclusively in the cytoplasm and in the cell membrane. The intensity of AEG-1/MTDH/LYRIC staining was significantly increased in prostate cancer compared to BPH (p=0.037). Interestingly, unlike other cancers, AEG-1/MTDH/LYRIC expression was high in patients with low Gleason score and decreased in patients with high Gleason score, although these changes were not statistically significant. In 52 of 63 BPH cases (82.5%), AEG-1/MTDH/LYRIC expression was detected in the nucleus of luminal cells and some staining of basal cells was detected in benign tissue, which was lost in cancer samples. In tumors, 38 out of 143 cases (26.6%) showed nuclear AEG-1/MTDH/LYRIC staining. The decrease in nuclear staining was associated with increased Gleason grade (p<0.001) with reciprocal increase in cytoplasmic staining. Patients with nuclear AEG-1/MTDH/LYRIC had a mean survival of 70 months compared with 39 months for patients without any nuclear AEG-1/MTDH/LYRIC staining (p=0.0023). Patients who did not receive any hormone treatment showed higher AEG-1/MTDH/LYRIC expression compared to the patients who received hormone treatment (p=0.009) regardless of whether the patient responded to the hormone treatment or not. Although no significant change in AEG-1/MTDH/LYRIC localization was observed with hormone therapy, hormone-sensitive patients demonstrated more nuclear AEG-1/MTDH/LYRIC staining. The observations from this study suggest a differential function between cytoplasmic and nuclear AEG-1/MTDH/LYRIC. While nuclear AEG-1/MTDH/LYRIC might function in normal cells and exert a protective role against tumor formation, cytoplasmic AEG-1/MTDH/LYRIC might exert functions contributing to tumorigenesis. Indeed, studies from other cancer indications demonstrate that cytoplasmic AEG-1/MTDH/LYRIC regulates miRNA function as part of the RNA-induced silencing complex and regulates translation of specific mRNAs, such as multidrug resistance protein-1 or coagulation factor XII, which contribute to the oncogenic function of AEG-1/MTDH/LYRIC (Srivastava et al., 2012; Yoo et al., 2010; Yoo, Santhekadur, et al., 2011). AEG-1/MTDH/LYRIC staining intensity as well as its localization might therefore be used as a biomarker for prostate cancer.
3.4. Renal cell carcinoma
Renal cell carcinoma (RCC) is the most common malignancy of adult urinary tract and accounts for ~3% of all adult malignancies (Nelson, Evans, & Lara, 2007). AEG-1/MTDH/LYRIC mRNA and protein overexpression were documented by RT-PCR and Western blot analysis in tumor tissues of eight RCC patients compared to matched normal kidney tissue (Chen et al., 2010). Analyzing AEG-1/MTDH/LYRIC expression by IHC in FFPE sections of 102 RCC patients that included 86 clear cell carcinomas, 10 papillary carcinomas, 3 chromophobe cell types, and 3 cases of cancer of the collecting duct of Bellini extended these observations. These cases also included six matched lymph node metastases and seven cases of neoplastic embolus in the renal vein. Weak AEG-1/MTDH/LYRIC expression was detected in the tubular epithelium and no expression was detected in the glomeruli of the adjacent normal kidney. However, 96 out of the 102 RCC cases showed high AEG-1/MTDH/LYRIC expression. Expression was higher in the lymph node metastases and in the neoplastic emboli, and the staining was detected in the cytoplasm. AEG-1/MTDH/LYRIC expression showed positive correlation with poorly differentiated nuclear grade of clear cell-type and papillary-type RCC with sarcomatoid areas showing the highest expression. Significant correlation was observed between AEG-1/MTDH/LYRIC and clinical stage (p=0.026), T classification (p=0.013), and M classification (p=0.032), while no correlation was observed with age, gender, and N classification. The cumulative 5-year survival rate was 91.3% in the low AEG-1/MTDH/LYRIC expression group, while it was 52.4% in the high AEG-1/MTDH/LYRIC expression group. The mean survival time in the low AEG-1/MTDH/LYRIC expression group was 76.98 months (95% confidence interval, 72.94–81.02), while it was 60.94 months in high AEG-1/MTDH/LYRIC expression group (95% confidence interval, 53.83–68.06) indicating that AEG-1/MTDH/LYRIC regulates advanced progression of RCC.
3.5. Bladder cancer
Bladder cancer is the second most common cancer of the urinary system (Kiriluk, Prasad, Patel, Steinberg, & Smith, 2012). AEG-1/MTDH/LYRIC expression analysis was performed in 60 cases of primary bladder carcinoma and 15 specimens of normal urothelial tissue (Zhou et al., 2012). Quantitative RT-PCR showed significantly higher levels of AEG-1/MTDH/LYRIC mRNA in cancer tissues when compared to normal tissues. In IHC analysis, all the normal samples had a staining index (SI) of 3 or less indicating negative expression, while 65% of cancer samples had a SI of 4 or more. Based on the Union for International Cancer Control (UICC) staging, 77.8% patients with positive AEG-1/MTDH/LYRIC staining belonged to the invasive (T2–T4) stage, while 26.7% patients with positive AEG-1/MTDH/LYRIC staining belonged to the superficial (Ta–T1) stage indicating a statistically significant correlation (p <0.001). According to WHO classification, 30%, 50%, and 86.7% AEG-1/MTDH/LYRIC positively stained samples were identified in G1, G2, and G3 stages, respectively, with a significant statistical correlation (p=0.001). AEG-1/MTDH/LYRIC expression correlated with tumor recurrence (p=0.015) and with multiple tumors. Positive AEG-1/MTDH/LYRIC expression was observed in 82.4% multiple tumors versus 42.3% single tumors (p=0.026). AEG-1/MTDH/LYRIC expression level correlated with Ki-67 expression level (p<0.001), the latter also showing correlation with UICC stage, tumor recurrence, and tumor multiplicity. In a multivariate survival analysis, patients with high SI (SI>6) had a shorter OS compared to patients with low SI (SI<6) (p<0.001). The 5-year cumulative survival rate was 92.3% in the low SI group versus 81.3% in the high SI group suggesting that AEG-1/MTDH/LYRIC might be an independent prognostic marker for bladder cancer.
4. NERVOUS SYSTEM
4.1. Malignant glioma
Cancers of the nervous system account for 1.7% of new disease, representing 189,000 cases annually resulting in 142,000 deaths globally (Stupp et al., 2005). Gliomas arising from glial cells comprise more than one-third of these cases and malignant gliomas, including anaplastic astrocytoma and glioblastoma multiforme (GBM), are the most common primary tumors (Butowski, Sneed, & Chang, 2006). AEG-1/MTDH/LYRIC expression was analyzed by IHC in FFPE sections from 296 glioma patients that include 39 cases of grade 1 (13.2%), 121 cases of grade 2 (40.9%), 88 cases of grade 3 (29.7%), and 48 cases of grade 4 (16.2%) gliomas (Liu et al., 2010). AEG-1/MTDH/LYRIC staining was detected in 265 out of 296 cases (89.5%) among which 143 (48.3%) were identified as low AEG-1/MTDH/LYRIC expression and 153 (51.7%) was considered as high AEG-1/MTDH/LYRIC expression. A statistically significant difference was observed in AEG-1/MTDH/LYRIC expression level between normal brain and glioma samples (p<0.001). AEG-1/MTDH/LYRIC expression correlated with age of the patient showing higher expression in patients >45 years age (p<0.001) and the clinicopathologic grade of the patients (p<0.001).
In a separate study, AEG-1/MTDH/LYRIC expression was analyzed by Western blot using frozen brain tissues from 9 normal individuals and tumor samples from 25 GBM, 18 astrocytomas, 18 meningiomas, 19 oligodendrogliomas, and 18 other types of brain cancers (Emdad et al., 2010). Compared to normal brain, AEG-1/MTDH/LYRIC protein expression was increased in >90% cases with a 3- to 10-fold increase, the highest changes being observed in GBM patients. These findings were also confirmed by IHC in FFPE sections.
As yet, no study analyzed AEG-1/MTDH/LYRIC expression level with the clinical outcome and survival time of glioma patients. Association of MMP-2 and MMP-9 with AEG-1/MTDH/LYRIC was observed in glioma patients but stringent statistical analysis was not performed (Emdad et al., 2010; Liu et al., 2010).
4.2. Neuroblastoma
Neuroblastoma, a tumor of peripheral neural crest origin, is the most common extracranial solid tumor in infancy and childhood and accounts for 7–10% of pediatric malignancies and approximately 15% of pediatric cancer-related deaths (Brodeur, 2003). AEG-1/MTDH/LYRIC expression was analyzed by IHC in FFPE sections of 32 neuroblastoma patients (Liu et al., 2012). Positive AEG-1/MTDH/LYRIC staining was observed in all cases with 75% showing high expression, which was detected in vascular endothelial cells and glandula. AEG-1/MTDH/LYRIC expression strongly correlated with age (p=0.012), clinical stage (p=0.030), and histological stage (p=0.041) and inversely correlated with reduced survival and poor prognosis (p=0.031) indicating that similar to other cancers AEG-1/MTDH/LYRIC might also be a potential biomarker for neuroblastoma.
4.3. Oligodendroglioma
Oligodendroglioma is the third most common intracranial glioma after GBM and anaplastic astrocytoma (Fuller & Scheithauer, 2007). AEG-1/MTDH/LYRIC expression was analyzed by IHC in FFPE sections of 75 oligodendroglioma patients including 52 grade 2 (well-differentiated) and 23 grade 3 (anaplastic) patients (Xia et al., 2010). While AEG-1/MTDH/LYRIC was hardly detected in normal brain, its expression was detected in 51 out of 75 cases (68%), which showed strong correlation with grade (p=0) but no correlation with age and sex. Ki-67 and AEG-1/MTDH/LYRIC expression showed positive correlation in these patients. The median survival time of high AEG-1/MTDH/LYRIC-expressing patients was 28 months (95% confidence interval, 25.54–30.46) while that of low AEG-1/MTDH/LYRIC-expressing patients was 57 months (95% confidence interval, 46.37–67.63) (p=0). The cumulative 3-year survival rate was 19.69% in high AEG-1/MTDH/LYRIC-expressing group, while it was 88.05% in the low AEG-1/MTDH/LYRIC-expressing group. Multivariate survival analysis identified AEG-1/MTDH/LYRIC as an independent prognostic factor for patient outcome.
5. RESPIRATORY SYSTEM: NONSMALL CELL LUNG CANCER
Lung cancer is the leading cause of cancer-related deaths in both men and women worldwide (Ferlay et al., 2010). Nonsmall cell lung cancer (NSCLC) accounts for 80% of all lung cancers. AEG-1/MTDH/LYRIC expression was detected by IHC in 95 cases of NSCLC with nonlymphatic metastases, 105 cases with lymphatic metastases, and 20 cases of matched distant metastases derived mostly from patients with relapse of lung cancer (Song et al., 2009). AEG-1/MTDH/LYRIC expression was undetectable or detectable at a low level in the adjacent noncancerous tissues while significantly high AEG-1/MTDH/LYRIC expression was detected in all the cancerous regions (p<0.001). AEG-1/MTDH/LYRIC expression strongly correlated with N classification (p=0.015), distant metastases (p=0.004), and pathological differentiation (p=0.027). An inverse correlation was observed between high AEG-1/MTDH/LYRIC expression and OS time (p<0.001) with a correlation coefficient of −0.341. The survival time between high and low AEG-1/MTDH/LYRIC-expressing groups was significantly different in poorly differentiated cases (p<0.001) but not in well-differentiated cases, and this difference was in observed both squamous cell carcinoma and adenocarcinoma. In univariate and multivariate analyses, AEG-1/MTDH/LYRIC was identified as an independent prognostic factor for patient outcome.
In another study, AEG-1/MTDH/LYRIC expression was analyzed by IHC in FFPE sections of 67 NSCLC patients that included 27 squamous cell carcinomas and 40 adenocarcinomas. Out of these 67 cases, 32 contained corresponding normal lung tissue (Sun et al., 2012). High AEG-1/MTDH/LYRIC expression was detected in 46 cases (68.7%) mainly in the cytoplasm. More intense staining was observed in patients with poor differentiation or lymph node metastases. AEG-1/MTDH/LYRIC expression correlated with clinical staging (p=0.048), degree of differentiation (p=0.023), and lymph node metastases (p=0.032). The sections were also stained for MMP-2 and MMP-9, and correlation was observed between AEG-1/MTDH/LYRIC and MMP-9 and not MMP-2. Spearman correlation coefficients between AEG-1/MTDH/LYRIC and MMP-2 or MMP-9 were −0.191 (p=0.121) and 0.449 (p<0.001), respectively. An inverse correlation was observed between high AEG-1/MTDH/LYRIC level and OS (p<0.001). The cumulative 5-year survival rates were 46.4% and 4.8% in low and high AEG-1/MTDH/LYRIC-expressing groups, respectively.
6. HEAD AND NECK CANCER
6.1. Salivary gland carcinoma
Salivary gland carcinoma (SGC) is a relatively rare cancer accounting for <5% of head and neck cancers (Milano, Longo, Basile, Iaffaioli, & Caponigro, 2007). However, SGC is a complicated tumor containing up to 24 histological subtypes (Thompson, 2006). AEG-1/MTDH/LYRIC expression was detected by IHC in FFPE sections of 141 SGC samples including 9 histological subtypes, mucoepidermoid carcinoma, adenoid cystic carcinoma, acinar cell carcinoma, adenocarcinoma, squamous cell carcinoma, salivary duct carcinoma, and basal cell carcinoma (Liao et al., 2011). In 136 out of 141 cases (96.5%), positive AEG-1/MTDH/LYRIC staining was detected while weak or negative signals were detected in control normal tissues. AEG-1/MTDH/LYRIC expression was upregulated in all the histological subtypes and was detected mainly in the cytoplasm. Quantitative IHC analysis documented that AEG-1/MTDH/LYRIC expression in all primary SGC was significantly higher than that in normal tissues and increased with the progression of the tumor grades I–IV (p<0.001). Spearman correlation and χ2-tests confirmed correlation of AEG-1/MTDH/LYRIC level with clinical stage (p=0.001), T classification (p=0.008), N classification (p=0.008), distant metastases (p=0.006), and lymph node involvement (p=0.008). However, no correlation was observed with age, gender, histological subtypes, and history of drinking or smoking. High AEG-1/MTDH/LYRIC expression was associated with shorter survival time (p<0.001) with a correlation coefficient of −0.383. The cumulative 5-year survival rate was 78.4% (95% confidence interval, 0.665–0.903) in the low AEG-1/MTDH/LYRIC group, while it was only 45% (95% confidence interval, 0.303–0.597) in the high AEG-1/MTDH/LYRIC group. In clinical stages III–IV, high AEG-1/MTDH/LYRIC expression correlated with poor survival. However, in clinical stage I–II, no significant difference was observed between low or high AEG-1/MTDH/LYRIC and OS. Shorter OS time with high AEG-1/MTDH/LYRIC expression was observed in patients with distant metastases, while no such correlation was observed in patients without distant metastases. These findings suggest that AEG-1/MTDH/LYRIC might be a prognostic marker for patients with late stage and aggressive SGC.
6.2. Head and neck squamous cell carcinoma
Head and neck squamous cell carcinoma (HNSCC), arising from the oral cavity, oropharynx, larynx, and hypopharynx, is the sixth most common malignancy worldwide (Ferlay et al., 2010). AEG-1/MTDH/LYRIC expression was analyzed in 20 primary HNSCC cases (oral cavity: 6, larynx: 3, oropharynx: 5, hypopharynx: 6) and corresponding normal epithelial samples (Nohata et al., 2011). Compared to normal tissue, AEG-1/MTDH/LYRIC expression was significantly higher and miR-375 expression was significantly lower in the cancer tissue (p=0.0154 and p=0.008, respectively). A direct regulation of AEG-1/MTDH/LYRIC by miR-375 expression was documented thereby unraveling a novel mechanism of AEG-1/MTDH/LYRIC regulation in these patients.
6.3. Squamous cell carcinoma of the tongue
Squamous cell carcinoma of the tongue (TSCC) comprises ~41% of squamous cell carcinoma of the oral cavity and oropharynx (Rusthoven, Ballonoff, Raben, & Chen, 2008). The incidence of TSCC is rising and TSCC patients often present with lymphatic metastasis. AEG-1/MTDH/LYRIC expression was analyzed by IHC in 93 TSCC patients of different stages, 30 of whom also contained corresponding normal tongue tissue (Ke et al., 2012). While in normal tongue tissue, weak or negative signals for AEG-1/MTDH/LYRIC were detected, positive AEG-1/MTDH/LYRIC staining was detected in 45 of 93 (48.39%) TSCC samples. The staining intensity was significantly high in the tumor tissue when compared to the normal tongue (p<0.001), and AEG-1/MTDH/LYRIC expression gradually increased with the progression of tumor grades I–IV. Both by χ2-test and by Spearman correlation analysis, AEG-1/MTDH/LYRIC expression significantly correlated with differentiation degree (p<0.001), clinical stage (p<0.001), T classification (p=0.007), N classification (p=0.012), and lymph node involvement (p=0.013). No correlation was observed between AEG-1/MTDH/LYRIC expression and age, gender, and smoking. Low AEG-1/MTDH/LYRIC expression was significantly associated with higher OS (p=0.004) and multivariate Cox regression analysis identified AEG-1 as an independent prognostic marker for early TSCC with well-differentiated stages, but not in moderately or poorly differentiated stages. AEG-1/MTDH/LYRIC expression was detected mainly in the cytoplasm of the cancer cells.
7. OSTEOSARCOMA
The most commonly diagnosed primary malignancy of bone is osteosarcoma which is prevalent in children and adolescents (Damron, Ward, & Stewart, 2007). AEG-1/MTDH/LYRIC expression was analyzed in FFPE sections of 62 osteosarcoma patients and 20 normal bone samples by IHC (Wang et al., 2011). While AEG-1/MTDH/LYRIC expression was barely detectable in normal bone tissue, 51 of 62 (82.3%) showed positive staining for AEG-1/MTDH/LYRIC out of which 32 cases showed high-level expression. AEG-1/MTDH/LYRIC expression demonstrated association with clinical stage (r=0.547, p<0.001), tumor classification (r=0.489, p<0.001), metastasis (r=0.373, p=0.003), and poor differentiation (r=0.520, p<0.001). Interestingly, AEG-1/MTDH/LYRIC expression significantly associated with gender exhibiting higher expression in female patients (r=0.300, p=0.018). The average survival time in low AEG-1/MTDH/LYRIC expression group was 91.73 months (95% confidence interval, 77.950–105.511) while that in high AEG-1/MTDH/LYRIC expression group was 57.188 months (95% confidence interval, 44.608–70.308). Multivariate survival analysis identified AEG-1/MTDH/LYRIC as an independent prognostic factor for osteosarcoma.
8. LYMPHOMA
Contribution of AEG-1/MTDH/LYRIC to both B- and T-cell lymphomas has been reported. Diffuse large B-cell lymphoma (DLBCL) is an aggressive malignancy of mature B lymphocytes and is the most common type of lymphoma in adults accounting for 25–50% of adult non-Hodgkin lymphoma in the Western countries (Muris et al., 2005). AEG-1/MTDH/LYRIC mRNA and protein expression were analyzed by real-time PCR and Western blot, respectively, using tissues from 21 DLBCL patients and 25 patients with reactive hyperplasia of lymph nodes. A significant increase (p<0.0001) in AEG-1/MTDH/LYRIC expression at an mRNA and protein level was observed in DLBCL patients compared to controls (Ge et al., 2012). AEG-1/MTDH/LYRIC expression was further analyzed in samples from 30 DLBCL patients and 15 reactive hyperplasia of the lymph nodes by IHC in FFPE sections. Little or no AEG-1/MTDH/LYRIC expression was detected in the 15 patients with reactive hyperplasia. In the cases of DLBCL, 7 cases were negative for AEG-1/MTDH/LYRIC expression while the remaining 23 (76.67%) cases showed a variable level of AEG-1/MTDH/LYRIC expression. AEG-1/MTDH/LYRIC level significantly correlated (p<0.05) with the clinical staging of DLBCL patients, which was confirmed by Spearman rank correlation analysis (0.507; p=0.004). However, no correlation was observed between AEG-1/MTDH/LYRIC expression and age, gender, and B symptoms of the patients.
AEG-1/MTDH/LYRIC expression was analyzed in lymph node biopsies from 129 T-cell non-Hodgkin lymphoma (T-NHL) patients and 17 control individuals. While AEG-1/MTDH/LYRIC expression was barely detectable in normal lymph node tissues, high AEG-1/MTDH/LYRIC level was detected in T-NHL patients (p<0.01) (Yan et al., 2012). However, no clinicopathological correlation study with AEG-1/MTDH/LYRIC was performed.
9. ANTI-AEG-1/MTDH/LYRIC ANTIBODY AS A BIOMARKER FOR CANCER
Autoantibodies against tumor-associated antigens are present in the blood of cancer patients (Caron, Choquet-Kastylevsky, & Joubert-Caron, 2007). As AEG-1/MTDH/LYRIC overexpression is detected on the membrane of cancer cells, it was hypothesized that cancer patients might have elevated levels of anti-AEG-1/MTDH/LYRIC antibody in the serum. Sera from 483 different cancer patients were analyzed by ELISA to detect anti-AEG-1/MTDH/LYRIC antibody using the lung-homing domain (aa 381–443) of human AEG-1/MTDH/LYRIC as the antigen (Chen et al., 2012). Antibody at titers of ≥1:50 was detected in 238 of 483 (49%) cancer patients, including 44 out of 98 (45%) breast cancer patients, 48 out of 96 (50%) HCC patients, 43 out of 88 (49%) CRC patients, 51 out of 113 (45%) lung cancer patients, and 43 out of 88 (49%) gastric cancer patients. In contrast, 0 out of 230 normal individual showed serum anti-AEG-1/MTDH/LYRIC antibody (p<0.01). Although no difference was observed between the antibody titer and sex or metastasis status of the patient, antibody at a titer of ≥1:50 was detected in 168 of 287 (59%) patients <60 years old versus 70 out of 196 (36%) patients >60 years old (p<0.01), suggesting that positive rate of anti-AEG-1/MTDH/LYRIC antibody decreases with age.
In stage I and II cancer patients, anti-AEG-1/MTDH/LYRIC antibody was detected in 40 out of 127 (31%) cancer patients at titers of ≥1:50 that include 9 of 30 (30%) breast cancer patients, 8 of 31 (26%) HCC patients, 8 of 23 (35%) CRC patients, 6 of 20 (30%) lung cancer patients, and 9 of 23 (39%) gastric cancer patients. However, in stage III and IV cancer patients, anti-AEG-1/MTDH/LYRIC antibody was detected in 198 out of 356 (56%) cancer patients at titers of ≥1:50 that include 35 of 68 (51%) breast cancer patients, 40 of 65 (62%) HCC patients, 43 of 90 (48%) CRC patients, 37 of 68 (54%) lung cancer patients, and 43 of 65 (64%) gastric cancer patients (p<0.01). Thus, anti-AEG-1/MTDH/LYRIC antibody might be a marker for progression of cancer. Although exciting, this is the only study documenting the utility of anti-AEG-1/MTDH/LYRIC antibody as a biomarker and needs to be validated in other population-based studies of different geographic locations.
10. CLINICAL SIGNIFICANCE OF AEG-1/MTDH/LYRIC POLYMORPHISM
Two studies analyzed AEG-1/MTDH/LYRIC polymorphism and their link to clinicopathological status of the patients. In the first study, blood cells from 108 breast cancer patients, including 7 lobular carcinoma, 82 ductal carcinoma, and 19 classified as other subtypes, and 100 healthy women from the Han ethnic group in China were analyzed for single-nucleotide polymorphism in the AEG-1/MTDH/LYRIC gene (Liu et al., 2011). 13 variants in the control group and 11 variants in breast cancer patients were detected which were distributed throughout the gene but more frequently at the ends of the gene. Three novel variants were observed in breast cancer patients but not in the control group. Among them, one polymorphism in exon 6 (1333 C>G) causes an Asp to Glu conversion in MTDH protein, which might alter the structure and/or function of the protein. In another patient, a G/C variant (C>G) just one nucleotide prior to exon 8 changes the “GT/AG” rule for mRNA splicing and might lead to a variant form of the protein with altered functions. Among the high-frequency polymorphisms, untitled_3 occurring in intron 11 showed significant association with breast cancer patients. T/T genotype was observed in 89 control and 84 breast cancer patients, C/C genotype was observed in 2 controls and 0 cancer patients, and C/T genotype was observed in 9 control and 24 breast cancer patients accounting for a significant statistical difference (p=0.008). Although the paper states that the homozygous T/T genotype increases the risk of breast cancer, based on the provided data there is more association of C/T genotype to breast cancer. The conclusion drawn by the authors thus is not clear and might reflect a flaw in data analysis or a simple typographic error.
A second polymorphism in exon 9 (1681 G>A, rs2331652) was also found to increase susceptibility to breast cancer. G/G genotype was observed in 64 control and 52 breast cancer patients, A/A genotype was observed in 5 controls and 10 cancer patients, and A/G genotype was observed in 31 control and 46 breast cancer patients. Although A/A or A/G genotype alone did not show any statistical difference, when A/A and A/G genotypes were combined, a statistically significant difference was observed (p=0.026). However, neither of these polymorphisms exhibited any significant correlations with clinicopathologic parameters, such as age at diagnosis, pathological diagnosis, tumor size and grade, and nodal metastasis, indicating that these polymorphisms may not have any prognostic indication.
The same group performed a second study in 145 ovarian cancer patients and 245 age-matched healthy women of the Han ethnicity (Yuan et al., 2012). In this study, a polymorphism was identified in the promoter region of AEG-1/MTDH/LYRIC gene (−470 G>A). G/G genotype was observed in 55.5% control and 64.1% cancer patients, AA genotype was observed in 9.84% control and 3.45% cancer cases, and G/A genotype was observed in 34.6% control and 32.4% cancer patients. A statistically significant correlation (p=0.042) was observed in ovarian cancer in the additive genetic model, GG versus GS versus AA. Using the dominant genetic model GG+GA versus AA, a statistically significant difference in ovarian cancer risk was observed (p=0.0198). These findings indicate that the AA genotype might be protective for ovarian cancer. However, when the expression level of AEG-1/MTDH/LYRIC was analyzed by Western blot, none of these genotypes demonstrated a difference in level of expression either in the control or in the ovarian cancer patients. A polymorphism in the promoter region might indicate alteration of promoter function leading to changes in expression level. The lack of this observation raises concern regarding the functional contribution of the polymorphism in regulation of AEG-1/MTDH/LYRIC expression. Interestingly, a statistically significant correlation (p=0.038) was observed between the polymorphism and the stage of the cancer although no other clinicopathologic parameters showed any significant correlation.
Those two studies were performed in a specific ethnic group in China. To establish the clinical relevance of AEG-1/MTDH/LYRIC polymorphism in disease etiology, diagnosis and prognosis studies need to be performed in large patient population of diverse genetic background.
11. CONCLUSION
The inclusion of AEG-1/MTDH/LYRIC in the 70-gene signature for risk assessment for breast cancer metastasis is the first step in the translational utilization of AEG-1/MTDH/LYRIC in clinical settings. However, AEG-1/MTDH/LYRIC has a much broader scope of application in patient care. A large number of studies in diverse cancer indications clearly demonstrate an inverse relationship between AEG-1/MTDH/LYRIC expression level and OS and recurrence of the disease. The results of these studies should pave the way for routinely analyzing AEG-1/MTDH/LYRIC expression level in tissue biopsies to determine the prognosis of the patients. One strong phenotype conferred by AEG-1/MTDH/LYRIC is chemoresistance. However, very few studies have been carried out to analyze AEG-1/MTDH/LYRIC expression status and sensitivity to chemotherapy in cancer patients. Given that bench-top laboratory analyses have elucidated the molecular mechanisms of AEG-1/MTDH/LYRIC-induced chemoresistance, stringent statistical clinical research needs to be performed to use AEG-1/MTDH/LYRIC as a screening biomarker before developing a chemotherapy-based treatment protocols (Bhutia et al., 2010; Hu et al., 2009; Yoo et al., 2010; Yoo, Gredler, et al., 2009). The identification of anti-AEG-1/MTDH/LYRIC antibody titer as a serum biomarker for aggressive cancer is an encouraging approach, and comparative studies need to be carried out to establish its specificity and selectivity versus other currently employed serum biomarkers (Chen et al., 2012). Additionally, studies need to be carried out to determine whether changes in anti-AEG-1/MTDH/LYRIC antibody titer might be used as a marker for response to therapy and whether this titer might be periodically checked as a determinant for failure of therapy or disease recurrence. Overexpression of AEG-1/MTDH/LYRIC on the surface of cancer cells might be exploited to develop antibody-based diagnostic or therapeutic approaches. Indeed, in vitro proof-of-principle studies combining anti-AEG-1/MTDH/LYRIC antibody with gold nanoparticles have demonstrated the potential utility of this approach (Unak et al., 2012). More extensive future research might elevate AEG-1/MTDH/LYRIC as a central tool that could be routinely employed in a clinical diagnostic laboratory in diagnosing diverse cancers, monitoring cancer progression, defining efficacy of cancer therapy, and signaling cancer relapse after therapy.
Acknowledgments
Research support is acknowledged from grants provided by the James S. McDonnell Foundation and National Cancer Institute Grant R01 CA138540 (DS), the Samuel Waxman Cancer Research Foundation (SWCRF) Grant (DS and PBF), the National Foundation for Cancer Research (PBF), and NIH Grant R01 CA134721 (PBF). PBF holds the Thelma Newmeyer Corman Chair in Cancer Research and is a SWCRF Investigator. DS is the Harrison Endowed Scholar in Cancer Research, a Blick scholar and a SWCRF Investigator.
Footnotes
The authors declare no conflict of interest.
References
- Baygi ME, Nikpour P. Deregulation of MTDH gene expression in gastric cancer. Asian Pacific Journal of Cancer Prevention. 2012;13:2833–2836. doi: 10.7314/apjcp.2012.13.6.2833. [DOI] [PubMed] [Google Scholar]
- Bhutia SK, Kegelman TP, Das SK, Azab B, Su ZZ, Lee SG, et al. Astrocyte elevated gene-1 induces protective autophagy. Proceedings of the National Academy of Sciences of the United States of America. 2010;107:22243–22248. doi: 10.1073/pnas.1009479107. [DOI] [PMC free article] [PubMed] [Google Scholar]
- Blanco MA, Aleckovic M, Hua Y, Li T, Wei Y, Xu Z, et al. Identification of staphylococcal nuclease domain-containing 1 (SND1) as a Metadherin-interacting protein with metastasis-promoting functions. The Journal of Biological Chemistry. 2011;286:19982–19992. doi: 10.1074/jbc.M111.240077. [DOI] [PMC free article] [PubMed] [Google Scholar]
- Britt DE, Yang DF, Yang DQ, Flanagan D, Callanan H, Lim YP, et al. Identification of a novel protein, LYRIC, localized to tight junctions of polarized epithelial cells. Experimental Cell Research. 2004;300:134–148. doi: 10.1016/j.yexcr.2004.06.026. [DOI] [PubMed] [Google Scholar]
- Brodeur GM. Neuroblastoma: Biological insights into a clinical enigma. Nature Reviews. Cancer. 2003;3:203–216. doi: 10.1038/nrc1014. [DOI] [PubMed] [Google Scholar]
- Brown DM, Ruoslahti E. Metadherin, a cell surface protein in breast tumors that mediates lung metastasis. Cancer Cell. 2004;5:365–374. doi: 10.1016/s1535-6108(04)00079-0. [DOI] [PubMed] [Google Scholar]
- Butowski NA, Sneed PK, Chang SM. Diagnosis and treatment of recurrent high-grade astrocytoma. Journal of Clinical Oncology. 2006;24:1273–1280. doi: 10.1200/JCO.2005.04.7522. [DOI] [PubMed] [Google Scholar]
- Caron M, Choquet-Kastylevsky G, Joubert-Caron R. Cancer immunomics using autoantibody signatures for biomarker discovery. Molecular & Cellular Proteomics. 2007;6:1115–1122. doi: 10.1074/mcp.R600016-MCP200. [DOI] [PubMed] [Google Scholar]
- Chan AO, Wong BC, Lam SK. Gastric cancer: Past, present and future. Canadian Journal of Gastroenterology. 2001;15:469–474. doi: 10.1155/2001/850308. [DOI] [PubMed] [Google Scholar]
- Chen X, Dong K, Long M, Lin F, Wang X, Wei J, et al. Serum anti-AEG-1 auto-antibody is a potential novel biomarker for malignant tumors. Oncology Letters. 2012;4:319–323. doi: 10.3892/ol.2012.734. [DOI] [PMC free article] [PubMed] [Google Scholar]
- Chen W, Ke Z, Shi H, Yang S, Wang L. Overexpression of AEG-1 in renal cell carcinoma and its correlation with tumor nuclear grade and progression. Neoplasma. 2010;57:522–529. doi: 10.4149/neo_2010_06_522. [DOI] [PubMed] [Google Scholar]
- Damron TA, Ward WG, Stewart A. Osteosarcoma, chondrosarcoma, and Ewing’s sarcoma: National Cancer Data Base Report. Clinical Orthopaedics and Related Research. 2007;459:40–47. doi: 10.1097/BLO.0b013e318059b8c9. [DOI] [PubMed] [Google Scholar]
- El-Serag HB. Hepatocellular carcinoma. The New England Journal of Medicine. 2011;365:1118–1127. doi: 10.1056/NEJMra1001683. [DOI] [PubMed] [Google Scholar]
- Emdad L, Sarkar D, Lee SG, Su ZZ, Yoo BK, Dash R, et al. Astrocyte elevated gene-1: A novel target for human glioma therapy. Molecular Cancer Therapeutics. 2010;9:79–88. doi: 10.1158/1535-7163.MCT-09-0752. [DOI] [PMC free article] [PubMed] [Google Scholar]
- Ferlay J, Shin HR, Bray F, Forman D, Mathers C, Parkin DM. Estimates of worldwide burden of cancer in 2008: GLOBOCAN 2008. International Journal of Cancer. 2010;127:2893–2917. doi: 10.1002/ijc.25516. [DOI] [PubMed] [Google Scholar]
- Fuller GN, Scheithauer BW. The 2007 Revised World Health Organization (WHO) Classification of Tumours of the Central Nervous System: Newly codified entities. Brain Pathology. 2007;17:304–307. doi: 10.1111/j.1750-3639.2007.00084.x. [DOI] [PMC free article] [PubMed] [Google Scholar]
- Ge X, Lv X, Feng L, Liu X, Gao J, Chen N, et al. Metadherin contributes to the pathogenesis of diffuse large B-cell lymphoma. PLoS One. 2012;7:e39449. doi: 10.1371/journal.pone.0039449. [DOI] [PMC free article] [PubMed] [Google Scholar]
- Gnosa S, Shen YM, Wang CJ, Zhang H, Stratmann J, Arbman G, et al. Expression of AEG-1 mRNA and protein in colorectal cancer patients and colon cancer cell lines. Journal of Translational Medicine. 2012;10:109. doi: 10.1186/1479-5876-10-109. [DOI] [PMC free article] [PubMed] [Google Scholar]
- Gong Z, Liu W, You N, Wang T, Wang X, Lu P, et al. Prognostic significance of metadherin overexpression in hepatitis B virus-related hepatocellular carcinoma. Oncology Reports. 2012;27:2073–2079. doi: 10.3892/or.2012.1749. [DOI] [PubMed] [Google Scholar]
- He XX, Chang Y, Meng FY, Wang MY, Xie QH, Tang F, et al. Micro-RNA-375 targets AEG-1 in hepatocellular carcinoma and suppresses liver cancer cell growth in vitro and in vivo. Oncogene. 2012;31:3357–3369. doi: 10.1038/onc.2011.500. [DOI] [PubMed] [Google Scholar]
- Hiyama T, Yoshihara M, Tanaka S, Chayama K. Genetic polymorphisms and esophageal cancer risk. International Journal of Cancer. 2007;121:1643–1658. doi: 10.1002/ijc.23044. [DOI] [PubMed] [Google Scholar]
- Hu G, Chong RA, Yang Q, Wei Y, Blanco MA, Li F, et al. MTDH activation by 8q22 genomic gain promotes chemoresistance and metastasis of poor-prognosis breast cancer. Cancer Cell. 2009;15:9–20. doi: 10.1016/j.ccr.2008.11.013. [DOI] [PMC free article] [PubMed] [Google Scholar]
- Hui AB, Bruce JP, Alajez NM, Shi W, Yue S, Perez-Ordonez B, et al. Significance of dysregulated metadherin and microRNA-375 in head and neck cancer. Clinical Cancer Research. 2011;17:7539–7550. doi: 10.1158/1078-0432.CCR-11-2102. [DOI] [PubMed] [Google Scholar]
- Jian-Bo X, Hui W, Yu-Long H, Chang-Hua Z, Long-Juan Z, Shi-Rong C, et al. Astrocyte-elevated gene-1 overexpression is associated with poor prognosis in gastric cancer. Medical Oncology. 2011;28:455–462. doi: 10.1007/s12032-010-9475-6. [DOI] [PubMed] [Google Scholar]
- Jiang T, Zhu A, Zhu Y, Piao D. Clinical implications of AEG-1 in liver metastasis of colorectal cancer. Medical Oncology. 2012;29:2858–2863. doi: 10.1007/s12032-012-0186-z. [DOI] [PubMed] [Google Scholar]
- Kamangar F, Dores GM, Anderson WF. Patterns of cancer incidence, mortality, and prevalence across five continents: Defining priorities to reduce cancer disparities in different geographic regions of the world. Journal of Clinical Oncology. 2006;24:2137–2150. doi: 10.1200/JCO.2005.05.2308. [DOI] [PubMed] [Google Scholar]
- Kang DC, Su ZZ, Sarkar D, Emdad L, Volsky DJ, Fisher PB. Cloning and characterization of HIV-1-inducible astrocyte elevated gene-1, AEG-1. Gene. 2005;353:8–15. doi: 10.1016/j.gene.2005.04.006. [DOI] [PubMed] [Google Scholar]
- Ke ZF, He S, Li S, Luo D, Feng C, Zhou W. Expression characteristics of astrocyte elevated gene-1 (AEG-1) in tongue carcinoma and its correlation with poor prognosis. Cancer Epidemiology. 2012;37:179–185. doi: 10.1016/j.canep.2012.10.007. [DOI] [PubMed] [Google Scholar]
- Kikkawa F, Kawai M, Mizuno K, Ishikawa H, Kojima M, Maeda O, et al. Recurrence of epithelial ovarian carcinoma after clinical remission. Gynecologic and Obstetric Investigation. 1994;38:65–69. doi: 10.1159/000292449. [DOI] [PubMed] [Google Scholar]
- Kiriluk KJ, Prasad SM, Patel AR, Steinberg GD, Smith ND. Bladder cancer risk from occupational and environmental exposures. Urologic Oncology. 2012;30:199–211. doi: 10.1016/j.urolonc.2011.10.010. [DOI] [PubMed] [Google Scholar]
- Kochanek DM, Wells DG. CPEB1 regulates the expression of MTDH/AEG-1 and glioblastoma cell migration. Molecular Cancer Research. 2013;11(2):149–160. doi: 10.1158/1541-7786.MCR-12-0498. [DOI] [PubMed] [Google Scholar]
- Lee SG, Su ZZ, Emdad L, Sarkar D, Fisher PB. Astrocyte elevated gene-1 (AEG-1) is a target gene of oncogenic Ha-ras requiring phosphatidylinositol 3-kinase and c-Myc. Proceedings of the National Academy of Sciences of the United States of America. 2006;103:17390–17395. doi: 10.1073/pnas.0608386103. [DOI] [PMC free article] [PubMed] [Google Scholar]
- Li C, Li R, Song H, Wang D, Feng T, Yu X, et al. Significance of AEG-1 expression in correlation with VEGF, microvessel density and clinicopathological characteristics in triple-negative breast cancer. Journal of Surgical Oncology. 2011;103:184–192. doi: 10.1002/jso.21788. [DOI] [PubMed] [Google Scholar]
- Li C, Li Y, Wang X, Wang Z, Cai J, Wang L, et al. Elevated expression of astrocyte elevated gene-1 (AEG-1) is correlated with cisplatin-based chemoresistance and shortened outcome in patients with stages III–IV serous ovarian carcinoma. Histopathology. 2012;60:953–963. doi: 10.1111/j.1365-2559.2012.04182.x. [DOI] [PubMed] [Google Scholar]
- Li C, Liu J, Lu R, Yu G, Wang X, Zhao Y, et al. AEG-1 overexpression: A novel indicator for peritoneal dissemination and lymph node metastasis in epithelial ovarian cancers. International Journal of Gynecological Cancer. 2011;21:602–608. doi: 10.1097/IGC.0b013e3182145561. [DOI] [PubMed] [Google Scholar]
- Li J, Yang L, Song L, Xiong H, Wang L, Yan X, et al. Astrocyte elevated gene-1 is a proliferation promoter in breast cancer via suppressing transcriptional factor FOXO1. Oncogene. 2009;28:3188–3196. doi: 10.1038/onc.2009.171. [DOI] [PubMed] [Google Scholar]
- Li J, Zhang N, Song LB, Liao WT, Jiang LL, Gong LY, et al. Astrocyte elevated gene-1 is a novel prognostic marker for breast cancer progression and overall patient survival. Clinical Cancer Research. 2008;14:3319–3326. doi: 10.1158/1078-0432.CCR-07-4054. [DOI] [PubMed] [Google Scholar]
- Liao WT, Guo L, Zhong Y, Wu YH, Li J, Song LB. Astrocyte elevated gene-1 (AEG-1) is a marker for aggressive salivary gland carcinoma. Journal of Translational Medicine. 2011;9:205. doi: 10.1186/1479-5876-9-205. [DOI] [PMC free article] [PubMed] [Google Scholar]
- Liu HY, Liu CX, Han B, Zhang XY, Sun RP. AEG-1 is associated with clinical outcome in neuroblastoma patients. Cancer Biomarkers. 2012;11:115–121. doi: 10.3233/CBM-2012-0268. [DOI] [PMC free article] [PubMed] [Google Scholar]
- Liu L, Wu J, Ying Z, Chen B, Han A, Liang Y, et al. Astrocyte elevated gene-1 upregulates matrix metalloproteinase-9 and induces human glioma invasion. Cancer Research. 2010;70:3750–3759. doi: 10.1158/0008-5472.CAN-09-3838. [DOI] [PubMed] [Google Scholar]
- Liu DC, Yang ZL. MTDH and EphA7 are markers for metastasis and poor prognosis of gallbladder adenocarcinoma. Diagnostic Cytopathology. 2011;41(3):199–205. doi: 10.1002/dc.21821. [DOI] [PubMed] [Google Scholar]
- Liu X, Zhang N, Li X, Moran MS, Yuan C, Yan S, et al. Identification of novel variants of metadherin in breast cancer. PLoS One. 2011;6:e17582. doi: 10.1371/journal.pone.0017582. [DOI] [PMC free article] [PubMed] [Google Scholar]
- Malka D, Boige V, Dromain C, Debaere T, Pocard M, Ducreux M. Biliary tract neoplasms: Update 2003. Current Opinion in Oncology. 2004;16:364–371. doi: 10.1097/01.cco.0000129679.49651.50. [DOI] [PubMed] [Google Scholar]
- Meng X, Zhu D, Yang S, Wang X, Xiong Z, Zhang Y, et al. Cytoplasmic Metadherin (MTDH) provides survival advantage under conditions of stress by acting as RNA-binding protein. The Journal of Biological Chemistry. 2012;287:4485–4491. doi: 10.1074/jbc.C111.291518. [DOI] [PMC free article] [PubMed] [Google Scholar]
- Milano A, Longo F, Basile M, Iaffaioli RV, Caponigro F. Recent advances in the treatment of salivary gland cancers: Emphasis on molecular targeted therapy. Oral Oncology. 2007;43:729–734. doi: 10.1016/j.oraloncology.2006.12.012. [DOI] [PubMed] [Google Scholar]
- Miller G, Jarnagin WR. Gallbladder carcinoma. European Journal of Surgical Oncology. 2008;34:306–312. doi: 10.1016/j.ejso.2007.07.206. [DOI] [PubMed] [Google Scholar]
- Muris JJ, Cillessen SA, Vos W, van Houdt IS, Kummer JA, van Krieken JH, et al. Immunohistochemical profiling of caspase signaling pathways predicts clinical response to chemotherapy in primary nodal diffuse large B-cell lymphomas. Blood. 2005;105:2916–2923. doi: 10.1182/blood-2004-07-2716. [DOI] [PubMed] [Google Scholar]
- Nelson EC, Evans CP, Lara PN., Jr Renal cell carcinoma: Current status and emerging therapies. Cancer Treatment Reviews. 2007;33:299–313. doi: 10.1016/j.ctrv.2006.12.005. [DOI] [PubMed] [Google Scholar]
- Nohata N, Hanazawa T, Kikkawa N, Mutallip M, Sakurai D, Fujimura L, et al. Tumor suppressive microRNA-375 regulates oncogene AEG-1/MTDH in head and neck squamous cell carcinoma (HNSCC) Journal of Human Genetics. 2011;56:595–601. doi: 10.1038/jhg.2011.66. [DOI] [PubMed] [Google Scholar]
- Rusthoven K, Ballonoff A, Raben D, Chen C. Poor prognosis in patients with stage I and II oral tongue squamous cell carcinoma. Cancer. 2008;112:345–351. doi: 10.1002/cncr.23183. [DOI] [PubMed] [Google Scholar]
- Sarkar D, Emdad L, Lee SG, Yoo BK, Su ZZ, Fisher PB. Astrocyte elevated gene-1: Far more than just a gene regulated in astrocytes. Cancer Research. 2009;69:8529–8535. doi: 10.1158/0008-5472.CAN-09-1846. [DOI] [PMC free article] [PubMed] [Google Scholar]
- Siegel R, Naishadham D, Jemal A. Cancer statistics, 2012. CA: A Cancer Journal for Clinicians. 2012;62:10–29. doi: 10.3322/caac.20138. [DOI] [PubMed] [Google Scholar]
- Song H, Li C, Li R, Geng J. Prognostic significance of AEG-1 expression in colorectal carcinoma. International Journal of Colorectal Disease. 2010;25:1201–1209. doi: 10.1007/s00384-010-1009-3. [DOI] [PubMed] [Google Scholar]
- Song H, Li C, Lu R, Zhang Y, Geng J. Expression of astrocyte elevated gene-1: A novel marker of the pathogenesis, progression, and poor prognosis for endometrial cancer. International Journal of Gynecological Cancer. 2010;20:1188–1196. doi: 10.1111/igc.0b013e3181ef8e21. [DOI] [PubMed] [Google Scholar]
- Song L, Li W, Zhang H, Liao W, Dai T, Yu C, et al. Over-expression of AEG-1 significantly associates with tumour aggressiveness and poor prognosis in human non-small cell lung cancer. The Journal of Pathology. 2009;219:317–326. doi: 10.1002/path.2595. [DOI] [PubMed] [Google Scholar]
- Srivastava J, Siddiq A, Emdad L, Santhekadur P, Chen D, Gredler R, et al. Astrocyte elevated gene-1 (AEG-1) promotes hepatocarcinogenesis: Novel insights from a mouse model. Hepatology. 2012;56(5):1782–1791. doi: 10.1002/hep.25868. [DOI] [PMC free article] [PubMed] [Google Scholar]
- Stupp R, Mason WP, van den Bent MJ, Weller M, Fisher B, Taphoorn MJ, et al. Radiotherapy plus concomitant and adjuvant temozolomide for glioblastoma. The New England Journal of Medicine. 2005;352:987–996. doi: 10.1056/NEJMoa043330. [DOI] [PubMed] [Google Scholar]
- Su ZZ, Kang DC, Chen Y, Pekarskaya O, Chao W, Volsky DJ, et al. Identification and cloning of human astrocyte genes displaying elevated expression after infection with HIV-1 or exposure to HIV-1 envelope glycoprotein by rapid subtraction hybridization, RaSH. Oncogene. 2002;21:3592–3602. doi: 10.1038/sj.onc.1205445. [DOI] [PubMed] [Google Scholar]
- Su P, Zhang Q, Yang Q. Immunohistochemical analysis of Metadherin in proliferative and cancerous breast tissue. Diagnostic Pathology. 2010;5:38. doi: 10.1186/1746-1596-5-38. [DOI] [PMC free article] [PubMed] [Google Scholar]
- Sun W, Fan YZ, Xi H, Lu XS, Ye C, Zhang JT. Astrocyte elevated gene-1 overexpression in human primary gallbladder carcinomas: An unfavorable and independent prognostic factor. Oncology Reports. 2011;26:1133–1142. doi: 10.3892/or.2011.1387. [DOI] [PubMed] [Google Scholar]
- Sun S, Ke Z, Wang F, Li S, Chen W, Han A, et al. Overexpression of astrocyte-elevated gene-1 is closely correlated with poor prognosis in human non-small cell lung cancer and mediates its metastasis through up-regulation of matrix metalloproteinase-9 expression. Human Pathology. 2012;43:1051–1060. doi: 10.1016/j.humpath.2011.08.017. [DOI] [PubMed] [Google Scholar]
- Sutherland HG, Lam YW, Briers S, Lamond AI, Bickmore WA. 3D3/lyric: A novel transmembrane protein of the endoplasmic reticulum and nuclear envelope, which is also present in the nucleolus. Experimental Cell Research. 2004;294:94–105. doi: 10.1016/j.yexcr.2003.11.020. [DOI] [PubMed] [Google Scholar]
- Thirkettle HJ, Girling J, Warren AY, Mills IG, Sahadevan K, Leung H, et al. LYRIC/AEG-1 is targeted to different subcellular compartments by ubiquitinylation and intrinsic nuclear localization signals. Clinical Cancer Research. 2009;15:3003–3013. doi: 10.1158/1078-0432.CCR-08-2046. [DOI] [PubMed] [Google Scholar]
- Thompson L. World Health Organization classification of tumours: Pathology and genetics of head and neck tumours. Ear, Nose, & Throat Journal. 2006;85:74. [PubMed] [Google Scholar]
- Unak G, Ozkaya F, Medine EI, Kozgus O, Sakarya S, Bekis R, et al. Gold nanoparticle probes: Design and in vitro applications in cancer cell culture. Colloids and Surfaces. B, Biointerfaces. 2012;90:217–226. doi: 10.1016/j.colsurfb.2011.10.027. [DOI] [PubMed] [Google Scholar]
- van Wijk FH, van der Burg ME, Burger CW, Vergote I, van Doorn HC. Management of recurrent endometrioid endometrial carcinoma: An overview. International Journal of Gynecological Cancer. 2009;19:314–320. doi: 10.1111/IGC.0b013e3181a7f71e. [DOI] [PubMed] [Google Scholar]
- Wang N, Du X, Zang L, Song N, Yang T, Dong R, et al. Prognostic impact of Metadherin-SND1 interaction in colon cancer. Molecular Biology Reports. 2012;39:10497–10504. doi: 10.1007/s11033-012-1933-0. [DOI] [PubMed] [Google Scholar]
- Wang F, Ke ZF, Sun SJ, Chen WF, Yang SC, Li SH, et al. Oncogenic roles of astrocyte elevated gene-1 (AEG-1) in osteosarcoma progression and prognosis. Cancer Biology & Therapy. 2011;12:539–548. doi: 10.4161/cbt.12.6.16301. [DOI] [PubMed] [Google Scholar]
- Xia Z, Zhang N, Jin H, Yu Z, Xu G, Huang Z. Clinical significance of astrocyte elevated gene-1 expression in human oligodendrogliomas. Clinical Neurology and Neurosurgery. 2010;112:413–419. doi: 10.1016/j.clineuro.2010.02.007. [DOI] [PubMed] [Google Scholar]
- Yan J, Zhang M, Chen Q, Zhang X. Expression of AEG-1 in human T-cell lymphoma enhances the risk of progression. Oncology Reports. 2012;28:2107–2114. doi: 10.3892/or.2012.2055. [DOI] [PubMed] [Google Scholar]
- Yang Y, Wu J, Guan H, Cai J, Fang L, Li J, et al. MiR-136 promotes apoptosis of glioma cells by targeting AEG-1 and Bcl-2. FEBS Letters. 2012;586:3608–3612. doi: 10.1016/j.febslet.2012.08.003. [DOI] [PubMed] [Google Scholar]
- Yoo BK, Chen D, Su ZZ, Gredler R, Yoo J, Shah K, et al. Molecular mechanism of chemoresistance by Astrocyte Elevated Gene-1 (AEG-1) Cancer Research. 2010;70:3249–3258. doi: 10.1158/0008-5472.CAN-09-4009. [DOI] [PMC free article] [PubMed] [Google Scholar]
- Yoo BK, Emdad L, Lee SG, Su ZZ, Santhekadur PK, Chen D, et al. Astrocyte elevated gene-1 (AEG-1): A multifunctional regulator of normal and abnormal physiology. Pharmacology & Therapeutics. 2011;130:1–8. doi: 10.1016/j.pharmthera.2011.01.008. [DOI] [PMC free article] [PubMed] [Google Scholar]
- Yoo BK, Emdad L, Su ZZ, Villanueva A, Chiang DY, Mukhopadhyay ND, et al. Astrocyte elevated gene-1 regulates hepatocellular carcinoma development and progression. The Journal of Clinical Investigation. 2009;119:465–477. doi: 10.1172/JCI36460. [DOI] [PMC free article] [PubMed] [Google Scholar]
- Yoo BK, Gredler R, Vozhilla N, Su ZZ, Chen D, Forcier T, et al. Identification of genes conferring resistance to 5-fluorouracil. Proceedings of the National Academy of Sciences of the United States of America. 2009;106:12938–12943. doi: 10.1073/pnas.0901451106. [DOI] [PMC free article] [PubMed] [Google Scholar]
- Yoo BK, Santhekadur PK, Gredler R, Chen D, Emdad L, Bhutia SK, et al. Increased RNA-induced silencing complex (RISC) activity contributes to hepatocelllular carcinoma. Hepatology. 2011;53:1538–1548. doi: 10.1002/hep.24216. [DOI] [PMC free article] [PubMed] [Google Scholar]
- Yu C, Chen K, Zheng H, Guo X, Jia W, Li M, et al. Overexpression of astrocyte elevated gene-1 (AEG-1) is associated with esophageal squamous cell carcinoma (ESCC) progression and pathogenesis. Carcinogenesis. 2009;30:894–901. doi: 10.1093/carcin/bgp064. [DOI] [PubMed] [Google Scholar]
- Yuan C, Li X, Yan S, Yang Q, Liu X, Kong B. The MTDH (−470G>A) polymorphism is associated with ovarian cancer susceptibility. PLoS One. 2012;7:e51561. doi: 10.1371/journal.pone.0051561. [DOI] [PMC free article] [PubMed] [Google Scholar]
- Zhang B, Liu XX, He JR, Zhou CX, Guo M, He M, et al. Pathologically decreased miR-26a antagonizes apoptosis and facilitates carcinogenesis by targeting MTDH and EZH2 in breast cancer. Carcinogenesis. 2011;32:2–9. doi: 10.1093/carcin/bgq209. [DOI] [PubMed] [Google Scholar]
- Zhang F, Yang Q, Meng F, Shi H, Li H, Liang Y, Han A. Astrocyte elevated gene-1 interacts with beta-catenin and increases migration and invasion of colorectal carcinoma. Mol Carcinog. 2012 doi: 10.1002/mc.21894. in press. [DOI] [PubMed] [Google Scholar]
- Zhou J, Li J, Wang Z, Yin C, Zhang W. Metadherin is a novel prognostic marker for bladder cancer progression and overall patient survival. Asia-Pacific Journal of Clinical Oncology. 2012;8:e42–e48. doi: 10.1111/j.1743-7563.2012.01541.x. [DOI] [PubMed] [Google Scholar]
- Zhu K, Dai Z, Pan Q, Wang Z, Yang GH, Yu L, et al. Metadherin promotes hepatocellular carcinoma metastasis through induction of epithelial-mesenchymal transition. Clinical Cancer Research. 2011;17:7294–7302. doi: 10.1158/1078-0432.CCR-11-1327. [DOI] [PubMed] [Google Scholar]