Abstract
This study investigated the capacity of chondrogenic and osteogenic pre-differentiation of mesenchymal stem cells (MSCs) for the development of osteochondral tissue constructs using injectable bilayered oligo(poly(ethylene glycol) fumarate) (OPF) hydrogel composites. We hypothesized that the combinatorial approach of encapsulating cell populations of both chondrogenic and osteogenic lineages in a spatially controlled manner within bilayered constructs would enable these cells to maintain their respective phenotypes via the exchange of biochemical factors even without the influence of external growth factors. During monolayer expansion prior to hydrogel encapsulation, it was found that 7 (CG7) and 14 (CG14) days of MSC exposure to TGF-β3 allowed for the generation of distinct cell populations with corresponding chondrogenic maturities as indicated by increasing aggrecan and type II collagen/type I collagen expression. Chondrogenic and osteogenic cells were then encapsulated within their respective (chondral/subchondral) layers in bilayered hydrogel composites to include four experimental groups. Encapsulated CG7 cells within the chondral layer exhibited enhanced chondrogenic phenotype when compared to other cell populations based on stronger type II collagen and aggrecan gene expression and higher glycosaminoglycans-to-hydroxyproline ratios. Osteogenic cells that were co-cultured with chondrogenic cells (in the chondral layer) showed higher cellularity over time, suggesting that chondrogenic cells stimulated the proliferation of osteogenic cells. Groups with osteogenic cells displayed mineralization in the subchondral layer, confirming the effect of osteogenic pre-differentiation. In summary, it was found that MSCs that underwent 7 days, but not 14 days, of chondrogenic pre-differentiation most closely resembled the phenotype of native hyaline cartilage when combined with osteogenic cells in a bilayered OPF hydrogel composite, indicating that the duration of chondrogenic preconditioning is an important factor to control. Furthermore, the respective chondrogenic and osteogenic phenotypes were maintained for 28 days in vitro without the need for external growth factors, demonstrating the exciting potential of this novel strategy for the generation of osteochondral tissue constructs for cartilage engineering applications.
Keywords: chondrogenic pre-differentiation, osteogenic pre-differentiation, mesenchymal stem cells, bilayered hydrogel, co-culture
1. Introduction
Articular cartilage, a flexible connective tissue that enables the articulation of bone in major synovial joints, characteristically maintains a limited endogenous capacity for self-regeneration. Hence in the absence of surgical intervention, damage to the tissue as a result of disease or trauma often leads to pain and premature arthritis. With over 60% of all patient knee arthroscopies revealing hyaline cartilage lesions [1, 2], the high incidence of cartilage injuries presents significant economic burden on society [3]. Over the years, reparative clinical procedures that have been developed to address this problem include microfracturing [4], osteochondral autograft transfer, and mosaicplasty [5, 6] among others. Despite some positive mid- to long-term results, issues involving the formation of fibrous tissue, high patient morbidity, and poor graft preservation complicate clinical outcomes and render results unpredictable [7]. In such cases where reparative strategies are less indicated, regenerative approaches at treating cartilage injuries are preferred. While modern cartilage regeneration techniques involving autologous chondrocyte transplantation (ACT) [8, 9] or matrix-assisted ACT [10] have met some clinical success, difficulties with joint arthrofibrosis and limited donor chondrocyte availability still present significant clinical hurdles. Indeed, current techniques are still unable to recapture the properties of healthy hyaline cartilage tissue.
Although chondrocytes, being the resident cell type in healthy articular cartilage, represent the logical choice for cell-based cartilage therapies, mesenchymal stem cells (MSCs) derived from the bone marrow are becoming increasingly coveted in new tissue engineering strategies for their ability to undergo chondrogenic and osteogenic differentiation under defined conditions [11]. This inherent multipotency, along with their potentially limitless supply, make MSCs the ideal candidate for cell-based orthopedic tissue engineering applications. However, ideal conditions for the preparation and delivery of MSCs to osteochondral defect sites for tissue regeneration are not fully known [12]. Since the first reports of preclinical efficacy in animal models by Wakitani et al. [13] and Caplan et al. [14], treatment strategies involving MSCs have taken on many various forms. One particularly promising avenue of research leverages the use of chondrogenically pre-differentiated cells. Recent evidence suggests that chondrogenic pre-differentiation of MSCs in vitro can influence their efficacy during cartilage regeneration in vivo [15]. For instance, chondrogenically pre-differentiated MSCs outperformed undifferentiated MSCs [16] and even autologous chondrocytes [17] when transplanted via type I collagen hydrogels into chronic osteochondral defects in an ovine model. Interestingly, chondrogenic pre-differentiation of human MSCs failed to elicit cartilage formation in biphasic agarose/decellularized-bone constructs under perfusion culture [18]. Given such contradictory findings, it is clear that the optimal strategy for MSC pre-differentiation remains elusive.
Emerging treatment options for osteochondral defects have evolved to recognize the importance of three-dimensional (3D) scaffolds for successful neo-tissue formation during healing. In particular, in situ forming polymeric hydrogel materials have been gaining recent popularity in the field of osteochondral tissue regeneration [19, 20]. As part of this effort, our laboratory has developed a novel class of water soluble oligo(poly(ethylene glycol) fumarate) (OPF) macromers that can be chemically crosslinked to yield hydrolytically degradable and injectable hydrogels [21, 22]. Indeed, previous findings have demonstrated that OPF hydrogels supported the proliferation of encapsulated articular chondrocytes [23] as well as the chondrogenic differentiation of encapsulated MSCs in vitro [24-26]. Additionally, previous in vivo investigations have showcased the promise of OPF hydrogels as MSC delivery vehicles for osteochondral tissue regeneration [27, 28]. However, the conditions for MSC delivery remain to be optimized.
Since successful osteochondral tissue repair remains a significant clinical challenge, the present study investigated the capacity of chondrogenic and osteogenic pre-differentiation of MSCs for the development of osteochondral tissue constructs using biodegradable OPF bilayered hydrogel constructs. This combinatorial approach of encapsulating cell populations of both chondrogenic and osteogenic lineages in a spatially controlled manner within respective chondral and subchondral layers of a single bilayered construct enables hierarchical segmentation of the local biochemical microenvironment as mediated by the cells for the generation of osteochondral constructs. We hypothesized that MSCs pre-differentiated prior to encapsulation would maintain their chondrogenic and osteogenic phenotypes following encapsulation within their respective parts of a bilayered hydrogel construct even without the influence of external growth factors. Specific objectives of this study were to investigate (1) whether osteogenically pre-differentiated MSCs within the subchondral layer affect the chondrogenic differentiation of cells in the chondral layer; (2) whether chondrogenically and osteogenically pre-differentiated MSCs can maintain their differentiation states after encapsulation within their respective layers of a bilayered hydrogel without external growth factor influence; (3) whether different chondrogenic pre-differentiation periods influenced the chondrogenic and osteogenic differentiation of MSCs after encapsulation.
2. Materials and Methods
2.1 Experimental Design
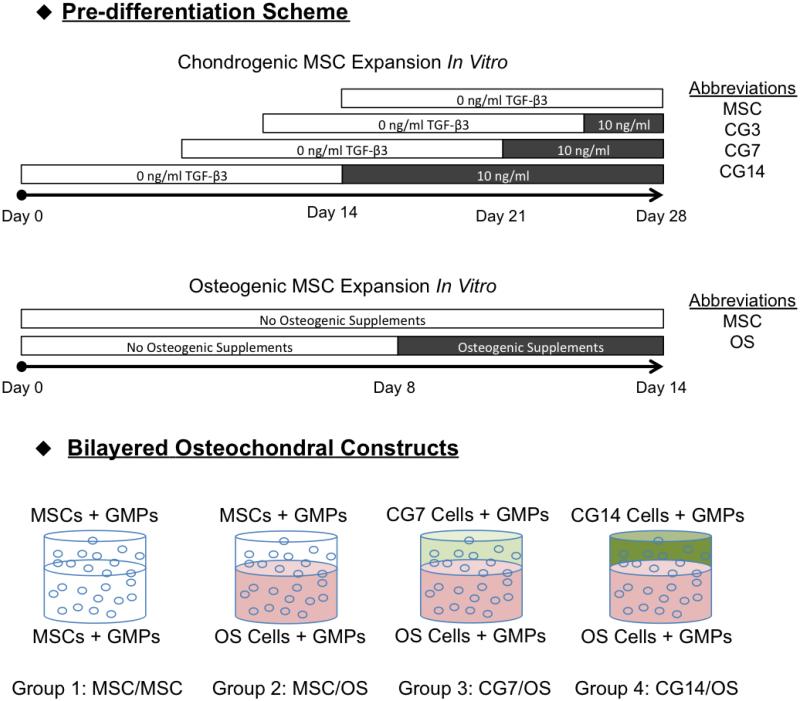
The overall experimental design is shown in Figure 1. In this study, MSCs that had undergone chondrogenic pre-differentiation to varying extents were encapsulated with osteogenically pre-differentiated MSCs within respective chondral and subchondral hydrogel layers that together make up the bilayered hydrogel system that was used. Prior to hydrogel encapsulation, MSCs were first expanded for 14 days in general medium and then subjected to 3 days, 7 days, or 14 days of culture in chondrogenic media supplemented with transforming growth factor-β3 (TGF-β3) in vitro to obtain differentiating MSC populations of increasing chondrogenic maturity. From these MSC populations, MSCs of distinct chondrogenic phenotype, as determined by gene expression, were then co-encapsulated with osteogenically pre-differentiated MSCs (OS cells) in bilayered hydrogel composites to yield four different experimental formulations as outlined in Figure 1. Specifically, the four formulations were as follows: Group 1 comprised undifferentiated MSCs encapsulated in both layers (MSC/MSC), Group 2 comprised undifferentiated MSCs in the chondral layer and OS cells in the subchondral layer (MSC/OS), Group 3 comprised CG7 cells in the chondral layer and OS cells in the subchondral layer (CG7/OS), Group 4 comprised CG14 cells in the chondral layer and OS cells in the subchondral layer (CG14/OS). Bilayered hydrogel composites encapsulating undifferentiated MSCs in both the chondral and subchondral layers were fabricated as negative controls.
Figure 1.
Schematic representation of the overall experimental design. According to the outlined chondrogenic pre-differentiation scheme, MSCs were subjected to 3, 7, or 14 days of exposure to TGF-β3 at a concentration of 10 ng/mL after a fixed period of general expansion. For osteogenic pre-differentiation, MSCs were subjected to 6 days of exposure to complete osteogenic medium immediately before cell encapsulation. Suitable cell populations were then encapsulated at Day 0 to yield the following four bilayered formulations: MSC/MSC, MSC/OS, CG7/OS, and CG14/OS. Bilayered hydrogel constructs were cultured for 28 days in serum-free chondrogenic medium without any additional growth factors.
2.2 OPF Synthesis and Characterization
OPF was synthesized using poly(ethylene glycol) (PEG) of a nominal molecular weight of 35,000 g/mol according to previously established procedures [21, 22]. Briefly, PEG was first dried via azeotropic distillation in toluene and then dissolved in anhydrous methylene chloride. Triethylamine and fumaryl chloride were added to initiate the synthesis reaction, which was allowed to proceed for 2 days. The resulting product was then purified via the removal of methylene chloride and salt precipitates, washing with ethyl ether, and subsequent drying of the OPF. The synthesized OPF was characterized via gel permeation chromatography and sterilized prior to use by ethylene oxide (EO) exposure for 12 hrs following established methods [26].
2.3 Gelatin Microparticle Fabrication
Gelatin microparticles (GMPs) were fabricated using acidic gelatin with an isoelectric point of 5.0 (Nitta Gelatin INC., Osaka, Japan) following previously established methods [29]. Briefly, a 10% w/v gelatin solution was prepared by dissolving 5 g of gelatin in 45 mL of distilled, deionized water (ddH2O) at 60 °C for ~20 min. This solution was added dropwise to 250 mL of olive oil containing 0.5 wt.% Span 80 during mixing at 500 rpm and then chilled in an ice/water bath for 30 min under continued stirring. 100 mL of chilled acetone was then added to the emulsion. After an additional 30 min, gelatin microspheres were collected via filtration and washing with acetone. The collected gelatin microspheres were then crosslinked in 10 mM glutaraldehyde for 20 hrs at 15 °C, after which glycine was added to a concentration of 25 mM to terminate the crosslinking reaction by blocking residual aldehyde groups of unreacted glutaraldehyde. Crosslinked microparticles were vacuum-filtered, washed with ddH2O, and lyophilized overnight. Dried GMPs of 50–100 μm in diameter were selected by sieving and sterilized by EO exposure for 12 hrs before use. Prior to encapsulation in hydrogels, sterile GMPs were swollen with phosphate buffered saline (PBS) at 4 °C overnight according to previously established procedures [29]. To achieve equilibrium swelling, 55 μL of PBS was applied to every 11 mg of dried GMPs. When encapsulated within OPF, GMPs can act as moieties for cell interaction as well as digestible porogens that aid hydrogel degradation [30].
2.4 Rabbit Marrow MSC Isolation and Culture
The experimental protocol for this study was reviewed and approved by the Rice University Institutional Animal Care and Use Committee, and conducted according to the National Institutes of Health animal care and use guidelines. Rabbit marrow-derived MSCs were isolated from the tibiae of 6-month old New Zealand white rabbits as previously described [31]. Briefly, after anesthesia, bone marrow was collected into 10 mL syringes containing 5000 U of heparin. The bone marrow was then cultured in general medium (GM) containing low glucose Dulbecco’s modified Eagle’s medium (DMEM-LG), 10% v/v fetal bovine serum (FBS), and 1% v/v penicillin/streptomycin/fungizone (PSF) for 2 weeks. Afterward, the rabbit marrow-derived MSCs were then pooled (from a total of six rabbits) to minimize interanimal variation and then cryopreserved in freezing medium containing 20% v/v FBS and 10% v/v dimethyl sulfoxide until use as previously described.
2.5 Monolayer Pre-differentiation of MSCs
Prior to hydrogel encapsulation, cryopreserved cells were thawed at 37 °C and cultured at a density of 3,500 cells per cm2 in T-225 flasks containing GM for at least 1 week before pre-differentiation (Figure 1). To generate cell populations at varying stages of chondrogenic pre-differentiation, MSCs were first expanded for a fixed duration and then subjected to 3 (CG3), 7 (CG7), or 14 (CG14) days of pre-differentiation in serum-free chondrogenic media containing DMEM-LG, ITS + Premix (6.25 μg/mL insulin, 6.25 μg/mL transferrin, 6.25 μg/mL selenous acid, 5.35 μg/mL linoleic acid, and 1.25 μg/mL bovine serum albumin) (BD Biosciences, San Jose, CA), 50 mg/L ascorbic acid, 10−7 M dexamethasone, 10 ng/mL TGF-β3 (PeproTech, Rocky Hill, NJ), and 1% v/v PSF. To obtain osteogenically (OS) pre-differentiated cells, MSCs were cultured in complete osteogenic medium containing high glucose DMEM, 10% w/v FBS, 50 mg/L ascorbic acid, 10 mM β-glycerophosphate, 10−8 M dexamethasone, and 1% v/v PSF. OS cells were exposed to osteogenic media 6 days immediately prior to hydrogel encapsulation as previously described [32]. Chondrogenic cells were subjected to biochemical (n=4) and gene expression analysis (n=3) before use in order to identify phenotypically distinct chondrogenic populations for hydrogel encapsulation.
2.6 Fabrication of Bilayered Hydrogel Composites and MSC Encapsulation
Bilayered hydrogel composites, which comprised separate subchondral and chondral layers, were fabricated via a two-step crosslinking procedure following previously established protocols [32, 33]. To briefly outline the fabrication process, the subchondral layer was first prepared by partially crosslinking the subchondral precursor solution within a Teflon mold, followed by the crosslinking of the chondral precursor solution on top of the subchondral layer to permit hydrogel lamination. Specifically, 100 mg of sterile OPF and 50 mg of sterile poly(ethylene glycol) diacrylate (PEG-DA, Laysan, Arab, AL) with a molecular weight of 3,400 g/mol were dissolved in 468 μL of PBS and combined with 110 μL of the swollen GMP solution. Equal parts (46.8 μL) of the thermal radical initiator solutions, 0.3 M of ammonium persulfate (APS, Sigma Aldrich) and 0.3 M of N,N,N’,N’–tetramethylethylenediamine (TEMED, Sigma Aldrich), were then added into the polymer solution. The respective cell suspension (6.7 million cells in 168 μL of PBS) of either MSCs or OS cells was subsequently mixed into the precursor solution to obtain a final concentration of 10 million cells/mL. After gentle mixing, the precursor solution for the subchondral layer was quickly injected into the bottom 2 mm of cylindrical Teflon molds (6 mm in diameter, 3 mm in thickness) and incubated for 5 min to allow for partial crosslinking. Meanwhile, the precursor solution for the chondral layer was prepared. 100 mg of sterile OPF and 50 mg of sterile PEG-DA were dissolved in 468 μL of PBS, combined with 110 μL of the swollen GMP solution, and mixed with 46.8 μL of 0.3 M APS and 46.8 μL of 0.3 M TEMED. The respective cell suspension (6.7 million cells in 168 μL of PBS) of either MSCs or CG cells was then mixed into the precursor solution to achieve a final concentration of 10 million cells/mL. The mixture for the chondral layer was then quickly injected onto the partially crosslinked subchondral layer within the Teflon mold. The resulting bilayered constructs were then crosslinked at 37 °C for 10 min to allow for lamination.
After fabrication, each bilayered hydrogel construct was transferred to individual wells of a 12-well tissue culture plate and cultured in 3 mL of serum-free chondrogenic medium supplemented with 10 mM β-glycerophosphate for up to 28 days. The medium was changed every 2 days for the first week and every 3 days thereafter. At the prescribed time points of 0, 7, 14, and 28 days, samples were retrieved from culture and collected for quantitative reverse transcriptase-polymerase chain reaction (RT-PCR) (n=4) and for biochemical assays (n=4). Bilayered samples were bisected with a blade to separate the chondral and subchondral layers and stored for analysis.
2.7 Real Time RT-PCR
The chondral layers of bilayered hydrogel constructs were subjected to RT-PCR analysis for the quantification of MSC chondrogenesis as indicated by several chondrogenic genetic markers as previously described [26]. Prior to RT-PCR, total RNA from samples were isolated at specified time points using the RNeasy Mini Kit (Qiagen, Valencia, CA) and following established protocols [26]. Isolated RNA samples were then reverse-transcribed to cDNA using superscript III transcriptase (Invitrogen) and Oligo dT primers (Promega). Final cDNA transcripts were analyzed with RT-PCR (7300 Real-Time PCR System, Applied Biosystems, Foster City, CA) to determine the gene expression for type II collagen, type I collagen, type X collagen, and aggrecan. Gene expression data were analyzed using the 2−ΔΔCt method as previously described [34]. All gene expression data were normalized to the expression of a house-keeping gene, glyceraldehyde-3-phosphatase dehydrogenase (GAPDH), and expressed as the fold ratio as compared with the baseline expression of a control group at day 0. In this study, the control group comprised bilayered hydrogel constructs containing undifferentiated MSCs in both the chondral and subchondral layers. These samples were analyzed immediately after encapsulation. The primer sequences for GAPDH, type II collagen, type I collagen, type X collagen, and aggrecan were as given: GAPDH, 5′-TCACCATCTTCCAGGAGCGA-3′, 5′-CACAATGCCGAAGTGGTCGT-3′; type II collagen, 5′-CTGCAGCACGGTATAGGTGA-3′, 5′-AACACTGCCAACGTCCAGAT-3′; type I collagen, 5′-AGCAGACGCATGAAGGCAAG-3′, 5′-CCCAGAATGGAGCAGTGGTTA-3′; type X collagen, 5′-ATGGAGTGTTCTACGCTGAG-3′, 5′-CCTCTCACTGGTATACCTTTACT-3′; aggrecan, 5′-CGTAAAAGACCTCACCCTCCA-3′, 5′-GCTACGGAGACAAGGATGAGT-3′.
2.8 Biochemical Assays
The chondral and subchondral layers of the bilayered hydrogel constructs were retrieved as described and stored in –20 °C until used for biochemical analysis. Chondral layer samples were thawed, homogenized with a needle syringe, and digested in 1 mL of proteinase K solution (1 mg/mL proteinase K, 0.01 mg/mL pepstatin A, and 0.185 mg/mL iodoacetamide dissolved in 50 mM tris(hydroxymethyl aminomethane) – 1 mM ethylenediaminetetraacetic acid buffer, pH 7.6, adjusted by HCl) at 56 °C for 16 hrs. Subchondral layer samples were thawed in 1 mL of ddH2O in order to preserve alkaline phosphatase (ALP) activity and homogenized with a needle syringe. After the collection and digestion of samples, specimens were subjected to three freeze– thaw cycles followed by probe sonication.
DNA content from both the chondral and subchondral layers was quantified using the Quant-iT PicoGreen dsDNA Assay Kit (Molecular Probes, Eugene, OR) according to the manufacturer’s instructions. Briefly, the cell lysates were combined with assay buffer and dye solution in an opaque 96-well plate, and incubated for 10 min at room temperature. The fluorescence was then measured using excitation and emission wavelengths of 485 nm and 528 nm (FL ×800 Fluorescence Microplate Reader; BioTek Instruments, Winooski, VT), respectively. DNA concentrations were determined relative to a lambda DNA standard curve.
Glycosaminoglycan (GAG) content from the chondral layers was determined with the dimethylmethylene blue colorimetric assay as previously described [35]. Briefly, cell lysate was combined with color reagent in a clear 96-well plate and measured for absorbance at 520 nm (PowerWave ×340 Microplate Reader; BioTek Instruments). GAG concentrations were determined relative to a chondroitin sulfate standard curve. In order to determine GAG synthetic activity, resulting total GAG amounts from each sample were normalized to the amount of DNA from that sample.
Hydroxyproline (HYP) content, which is an indicator of total collagen amount, from the chondral layers was determined using a colorimetric assay as previously described [36]. Briefly, an aliquot of cell lysate was combined with enough NaOH for a final basic concentration of 2 N and hydrolyzed by autoclaving for 15 min at 121 °C (~50 min of processing time). The resulting solution was neutralized with HCl and acetic acid to pH 6.5–7.0 and divided into duplicate reactions. Chloramine-T and p-dimethylaminobenzaldehyde solutions were then added sequentially and the absorbance at 570 nm measured with a plate reader. HYP concentrations were determined relative to a trans-4-hydroxy-L-proline standard curve. For extracellular matrix (ECM) composition, measured HYP amounts were normalized to the amount of GAG for each sample.
ALP enzyme activity from the cell lysates of the subchondral layers was measured using phosphatase substrate tablets and alkaline buffer solution (Sigma Aldrich). Briefly, cell lysate was combined with the buffer and tablet solutions in clear 96-well plates and incubated for 1 hr at 37 °C. After 1 hr, the absorbance at 405 nm was quantified using a plate reader. The resulting ALP activity was determined relative to a p-nitrophenol standard curve.
After determination of ALP activity, acetic acid was added to the cell lysates to achieve a final acidic concentration of 0.5 M and the samples were allowed to incubate at room temperature overnight to release calcium from the homogenized constructs. The calcium (Ca2+) content of the subchondral layers was then measured using a colorimetric assay. Briefly, treated lysates were combined with calcium arsenazo III reagent (Genzyme, Cambridge, MA) and the absorbance at 650 nm was quantified using a plate reader. Ca2+ concentrations were then determined relative to a CaCl2 standard curve.
2.9 Histology
OPF hydrogel constructs were fixed for histology in 10% neutral buffered formalin (Fisher Scientific, Pittsburg, PA), placed in 70% ethanol, and then embedded overnight in HistoPrep freezing medium (Fisher Scientific). After freezing at −20 °C, blocks were sectioned into 10 μm thick slices using a cryostat (Leica CM 1850 UV; Leica Biosystems Nussloch GmbH, Germany) and mounted onto glass slides. Sections from all experimental groups were stained with Safranin-O in order to evaluate the cellular morphology and extracellular matrix distribution at Day 28. Brightfield images were then obtained using a light microscope equipped with a digital camera attachment for image capture (Axio Imager.Z2 with AxioCam MRc5; Carl Zeiss MicroImaging GmbH, Germany).
2.10 Statistical Analysis
All results are presented as means ± standard deviations. Statistical analysis was performed with the SAS JMP Pro 10 software package. For the biochemical assay and RT-PCR data, one-way ANOVA and Tukey’s HSD multiple comparison tests were performed to determine possible significant differences (p<0.05) between groups at each time point.
3. Results
3.1 Monolayer pre-differentiation screening for encapsulation
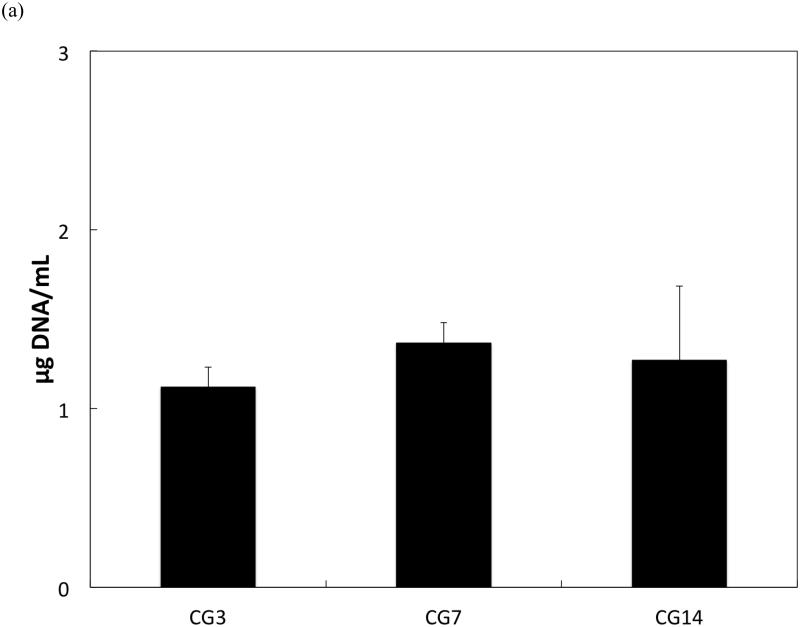
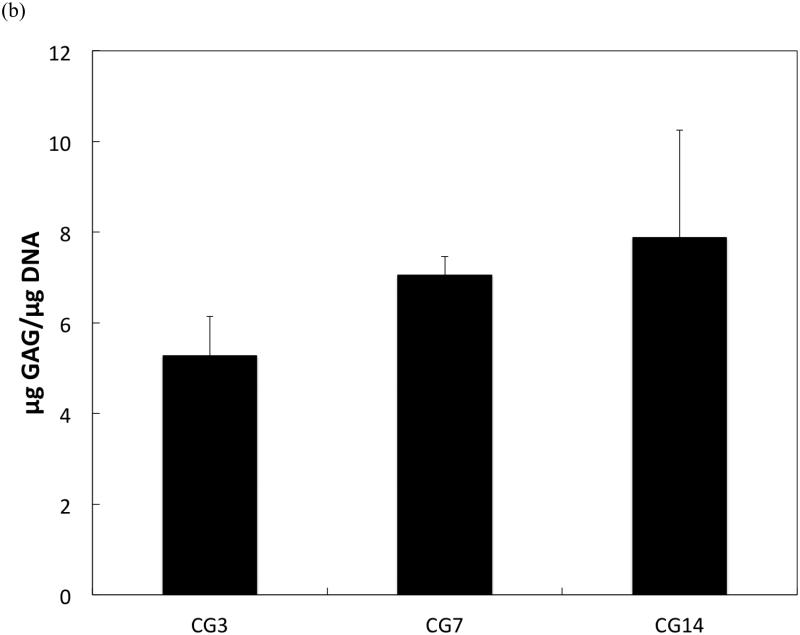
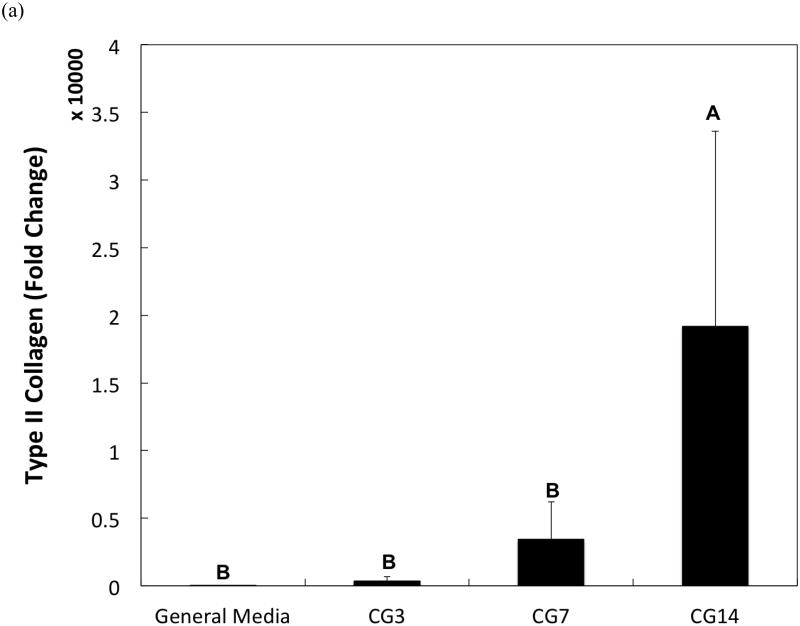
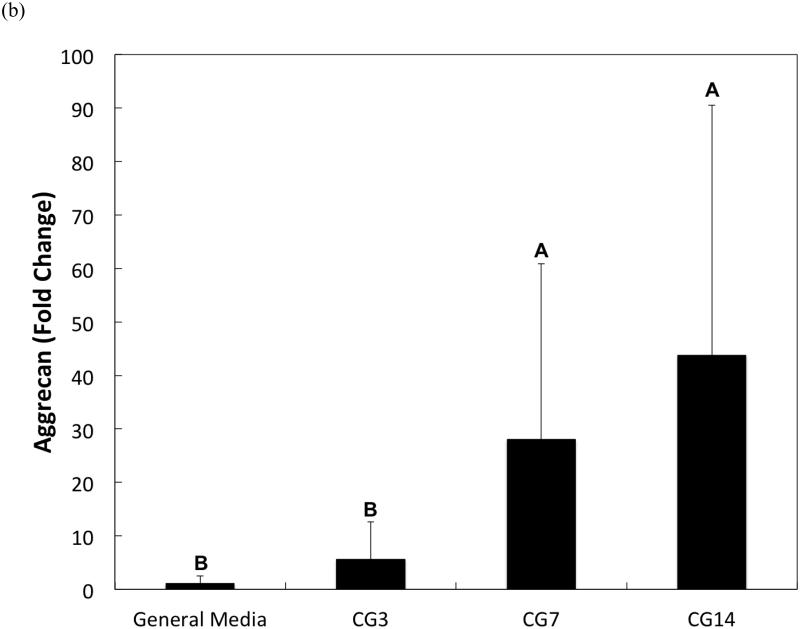
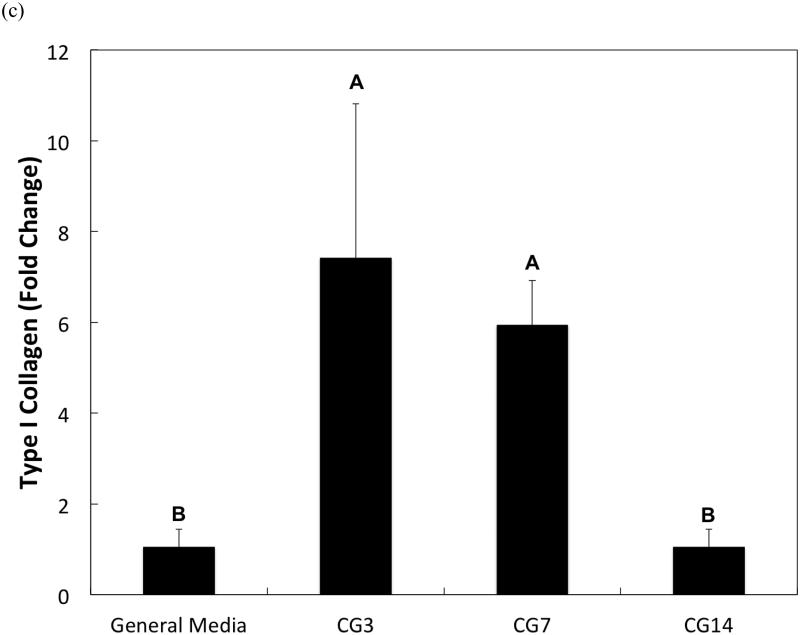
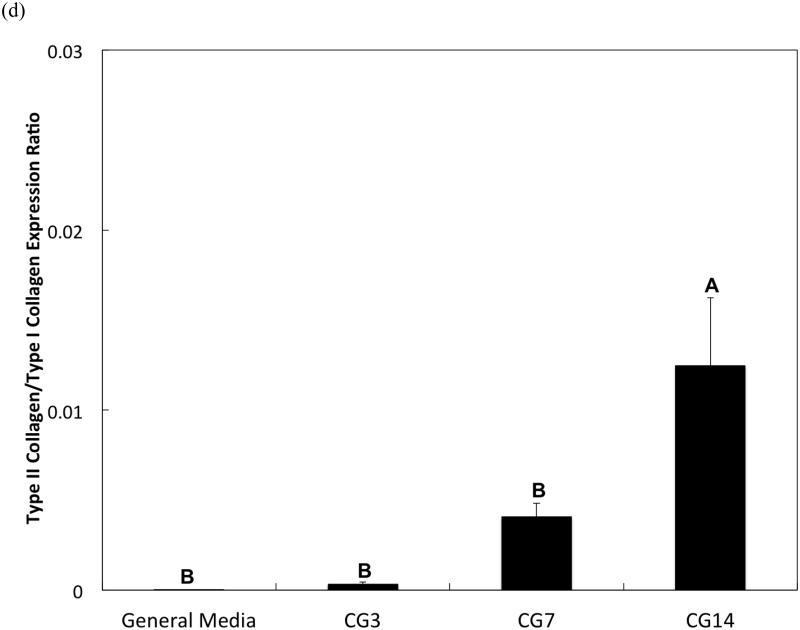
DNA content, an indicator of cellularity, between CG3 cells, CG7 cells, and CG14 cells were not different from each other despite differing durations in monolayer expansion (Figure 2a). Likewise, a comparison of the synthetic activity of each CG cell population showed similar levels of activity between each group (Figure 2b). However, differences between cell populations were discerned in the gene expression of several chondrogenic markers as shown in Figure 3. Specifically, type II collagen gene expression by CG14 cells were at least an order of magnitude larger than other cellular groups (Figure 3a). Aggrecan expression by CG7 and CG14 cells, while similar to each other, were markedly greater than that by CG3 cell or undifferentiated MSCs (Figure 3b). With regard to type I collagen, CG3 and CG7 cells displayed higher gene expression when compared to undifferentiated MSCs and CG14 cells (Figure 3c). When the type II collagen expression was combined with type I collagen expression to yield the type II collagen/type I collagen expression ratio, it was shown that CG14 cells maintained the highest expression ratio when compared to other cell populations (Figure 3d). Given this data, undifferentiated MSCs, CG7 cells, and CG14 cells, which represented three phenotypically distinct cell populations, were selected for encapsulation within the chondral layers of bilayered hydrogel constructs.
Figure 2.
(a) DNA content and (b) synthetic activity of MSCs after various durations of chondrogenic pre-differentiation immediately before encapsulation. Error bars represent the standard deviation for n = 4 samples.
Figure 3.
Quantitative gene expression of (a) type II collagen, (b) aggrecan, (c) type I collagen, and the (d) type II collagen/type I collagen expression ratio of MSCs after various durations of chondrogenic pre-differentiation immediately before encapsulation. Groups that are not marked by the same letter are significantly different (p<0.05). Error bars represent the standard deviation for n = 3 samples.
3.2 Cellularity in both the chondral and subchondral layers
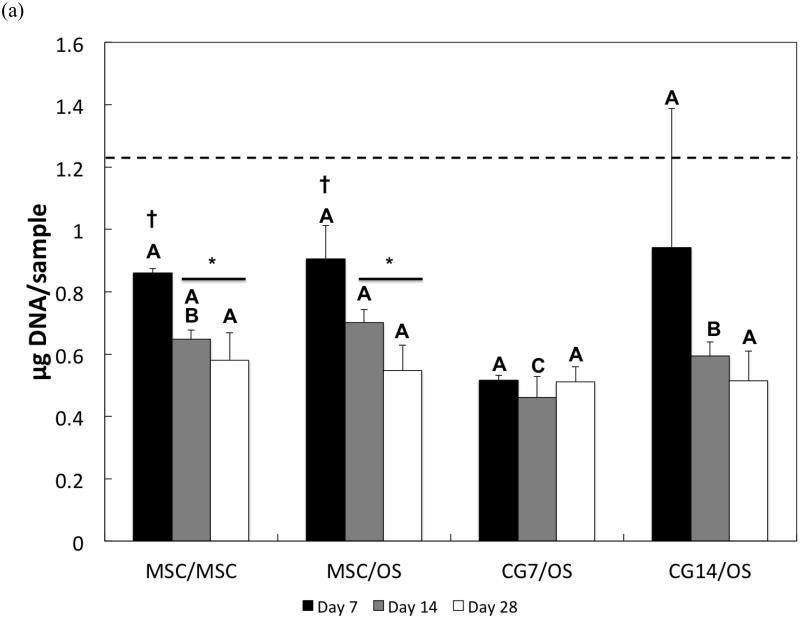
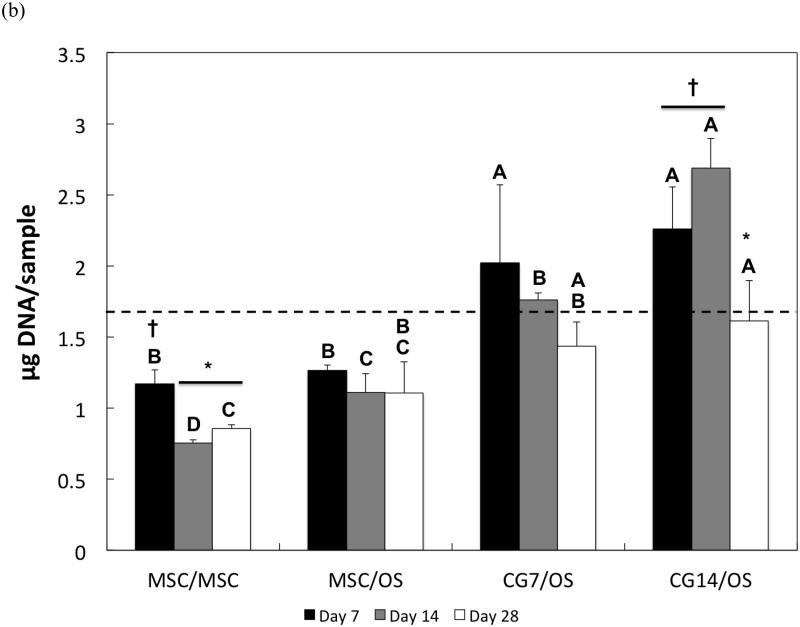
The DNA content of cells after hydrogel encapsulation is shown for both the chondral layer and the subchondral layer in Figures 4a and 4b, respectively. Hydrogel cellularity from the chondral layer (Figure 4a), while similar amongst all composite formulations at Day 7, decreased from Day 7 to Day 14 for the MSC/MSC and MSC/OS groups. CG7/OS and CG14/OS maintained similar DNA content over all time points within each respective group. While cellularity in the chondral layer stabilized for all experimental groups after Day 14, undifferentiated MSCs displayed greater cellularities when compared to CG cells. Specifically, MSC/MSC and MSC/OS maintained the highest cellularity while CG7/OS exhibited the lowest cellularity at Day 14. By Day 28, all groups showed similar cellularities.
Figure 4.
DNA content of cells in the (a) chondral layer and the (b) subchondral layer of bilayered hydrogel constructs at various time points. The dashed line indicates the average starting levels of DNA measured at Day 0 immediately after encapsulation. At each individual time point, groups not connected by the same letter are significantly different (p<0.05); comparing time points within each group, groups not connected by the same symbol are significantly different (p<0.05). Error bars represent the standard deviation for n = 4 samples.
For the subchondral layer, DNA content decreased after Day 7 and Day 14 for MSC/MSC and CG14/OS, respectively (Figure 4b). While a comparison of cellularity between groups at Day 7 showed that subchondral layers with OS cells generally maintained higher cellularities over those with undifferentiated MSCs, it also showed that OS cells that were cocultured with CG cells in the chondral layer displayed greater DNA amounts than OS cells cocultured with undifferentiated MSCs. At Day 14, CG14/OS upheld the highest cellularity, followed by CG7/OS and then MSC/OS. Although OS cells from Group 4 exhibited similar levels of DNA to those from Group 3 by Day 28, the former still maintained the highest cellularity overall.
3.3 Synthetic activity of cells in the chondral layer
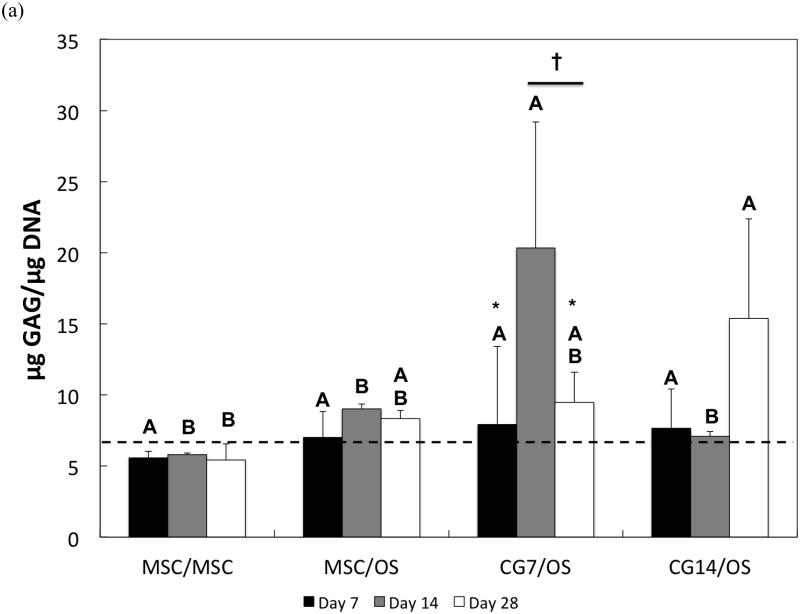
The synthetic activity of cells encapsulated in the chondral layer was assessed via the examination of the GAG content of the hydrogels. During early cultures, GAG deposition by all groups did not differ from each other (Figure 5a). However, only CG cells from Group 3 exhibited increases in synthetic activity over time. Particularly, GAG synthesis in CG7/OS increased significantly from Day 7 to Day 14 but returned to Day 7 levels by Day 28. A comparison of GAG synthetic activity between groups indicated that only chondrogenic pre-differentiation of MSCs for 7 days effected the highest GAG production amongst all groups at Day 14. Additionally, by Day 28, the GAG production by CG14 cells was only greater than that by undifferentiated MSCs.
Figure 5.
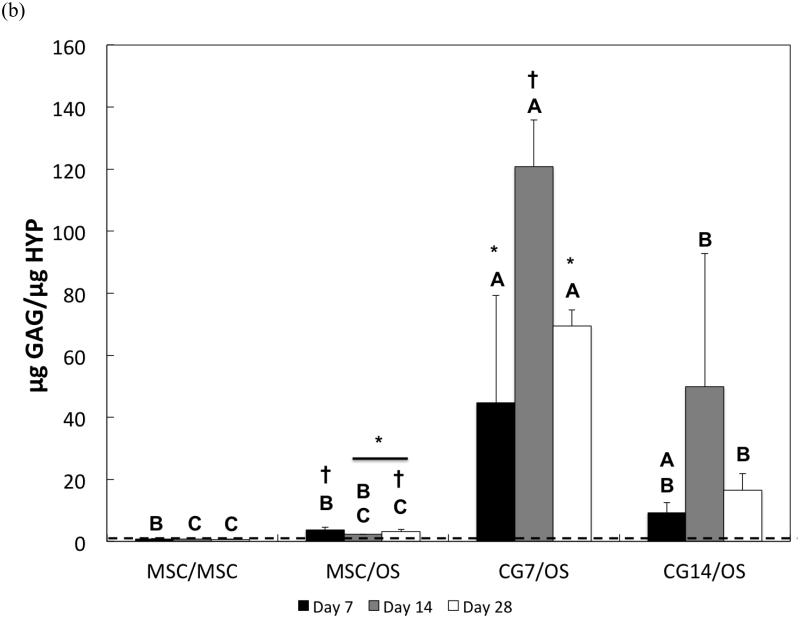
(a) Normalized GAG content and (b) GAG/HYP ratios of the chondral layers of bilayered hydrogel constructs at various time points. The dashed line indicates average starting levels measured at Day 0 immediately after encapsulation. At each individual time point, groups not connected by the same letter are significantly different (p<0.05); comparing time points within each group, groups not connected by the same symbol are significantly different (p<0.05). Error bars represent the standard deviation for n = 4 samples.
The composition of synthesized ECM by experimental groups (chondral layer) was also assessed. In particular, the ratio of synthesized GAGs to total collagen production (as indicated by HYP amounts) was analyzed. For the MSCs from Group 1, the GAG/HYP ratio remained constant over the measured time points (Figure 5b). However, MSCs from Group 2 showed decreased GAG/HYP ratios after Day 7, indicating an increase in total collagen production. Conversely, CG7 cells from Group 3 initially displayed notable increases in GAG/HYP ratio after Day 7 followed by a decrease after Day 14. While no differences in GAG/HYP ratios were observed for CG14 cells over time, it should be noted that the GAG/HYP showed an increasing trend from Day 7 to Day 14 followed by a decreasing trend until Day 28 (p<0.1048). A comparison of ECM composition between groups showed that while chondrogenic pre-differentiation affected higher GAG/HYP ratios at Day 7, 7 days of chondrogenic pre-differentiation resulted in the highest GAG/HYP ratio. By Day 28, CG7 cells from Group 3 still maintained maximal GAG/HYP ratios when compared to other groups. Additionally, CG14 cells from Group 4 displayed greater GAG/HYP ratios when compared to undifferentiated MSCs.
3.4 Histology
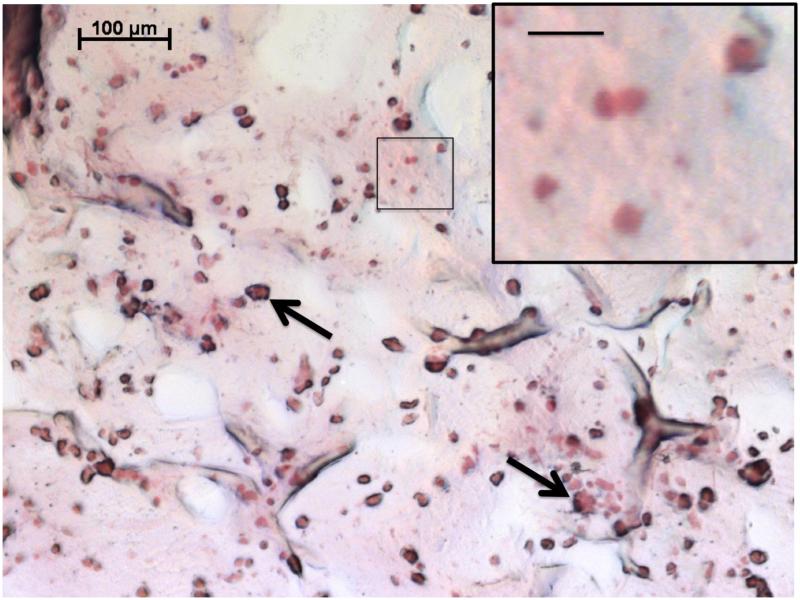
As indicated by the histological evaluation of representative composite cross sections at Day 28 in Figure 6, cells maintained spherical morphology and a homogeneous distribution after hydrogel encapsulation. Sections were stained with Safranin-O, which stains cartilaginous GAGs a pinkish-red color. While significant differences between experimental groups were generally not observed histologically, regions of red in the representative histology (Figure 6) confirm the deposition of extracellular GAG components by the encapsulated cells.
Figure 6.
Representative histological section of the chondral layer of cell-laden OPF hydrogel composites stained with Safranin-O at Day 28. The higher magnification image depicts the spherical morphology of encapsulated cells, where the scale bar represents 20 μm. Arrows indicate gelatin microparticles, now partially degraded, that were also encapsulated within the construct. This section was taken from Group 2 (MSC/OS), which is representative of histology from all groups examined.
3.5 Chondrogenic gene expression in the chondral layer
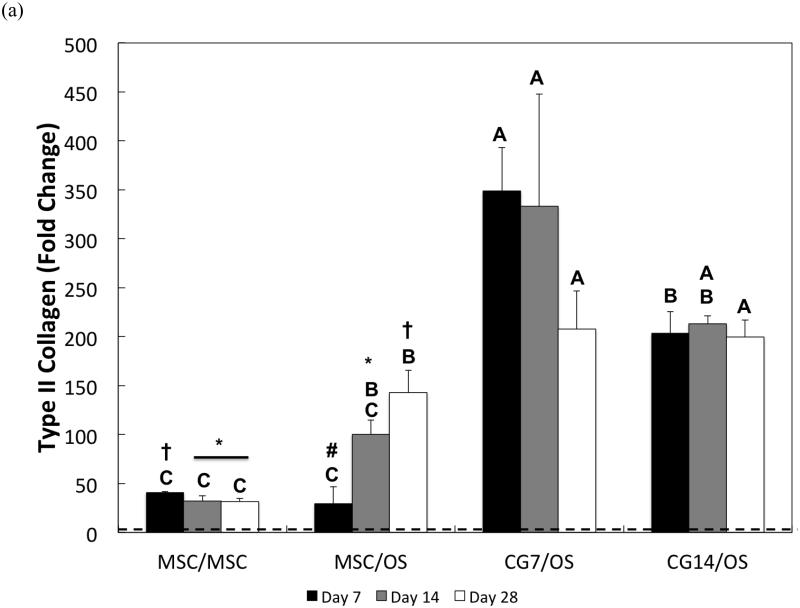
The chondrogenic phenotype of cells encapsulated within the chondral layer of bilayered OPF composite hydrogels was also evaluated via the gene expression analysis of chondrogenic markers, type II collagen and aggrecan, and the fibroblastic marker, type I collagen. With regard to type II collagen, undifferentiated MSCs from Group 1 showed the weakest gene expression overall (Figure 7a). Despite relatively low gene expression levels, type II collagen expression by MSCs from Group 1 was significantly down-regulated from a 40.8 ± 1.1-fold change at Day 7 to a 31.8 ± 5.5-fold change at Day 28. However, co-culturing undifferentiated MSCs in the chondral layer with OS cells in the subchondral layer resulted in increasing up-regulation of type II collagen expression from Day 7 (29.5 ± 17.1-fold change) until Day 28 (142.8 ± 22.9-fold change). At Day 14, CG7 cells maintained a 333.0 ± 114.6-fold change in type II collagen expression, which was greater than the gene expressions measured for the undifferentiated MSCs of Groups 1 and 2. By Day 28, both CG7 and CG14 cells displayed the highest levels of type II collagen expression with fold increases of 207.7 ± 39.0 and 199.9 ± 17.1, respectively.
Figure 7.
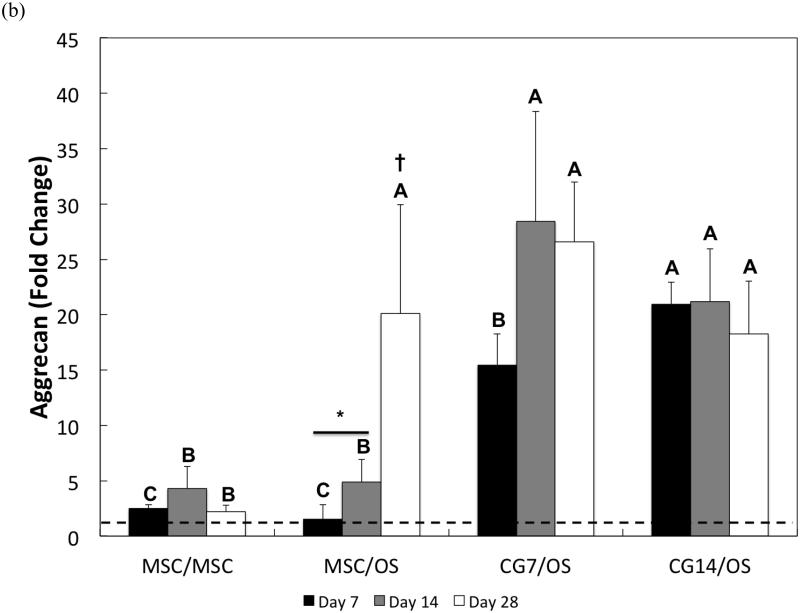
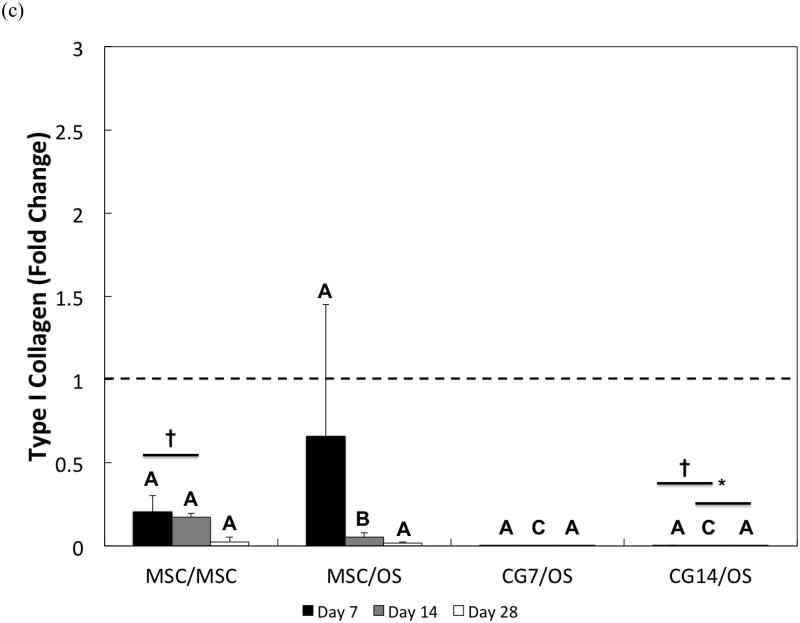
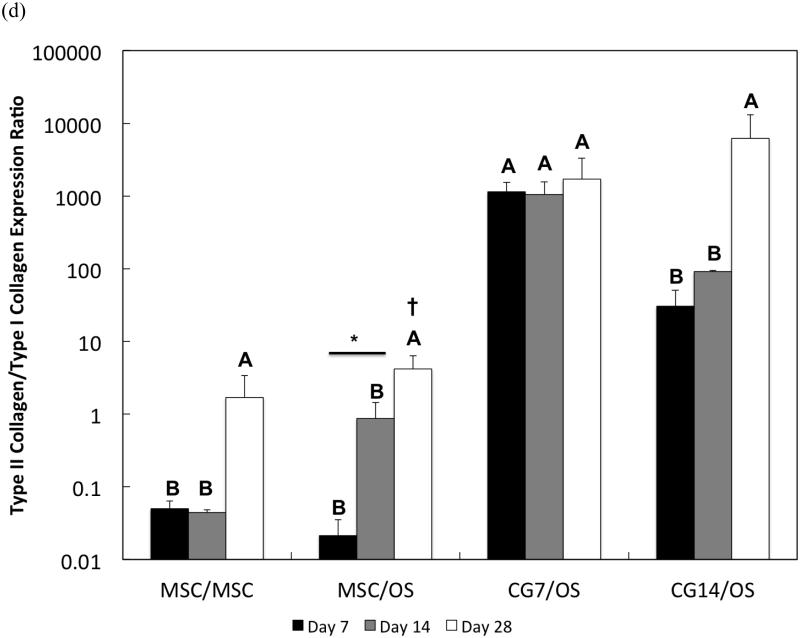
Quantitative gene expression for (a) type II collagen, (b) aggrecan, (c) type I collagen, and the (d) type II collagen/type I collagen expression ratio of cells within the chondral layers of bilayered hydrogel constructs at various time points. The type II collagen/type I collagen expression ratio is presented using a logarithmic scale for the y-axis. The dashed line indicates average starting values measured at Day 0 immediately after encapsulation. At each individual time point, groups not connected by the same letter are significantly different (p<0.05); comparing time points within each group, groups not connected by the same symbol are significantly different (p<0.05). Error bars represent the standard deviation for n = 4 samples.
Aggrecan gene expression patterns generally mirrored those of type II collagen. Specifically, undifferentiated MSCs from Groups 1 and 2 maintained the lowest fold changes in aggrecan expression at early and intermediate time points (Figure 7b). While CG7 cells from Group 3 exhibited a greater level of aggrecan expression when compared to undifferentiated MSCs from Groups 1 and 2 at Day 7, the measured fold change of 15.5 ± 2.8 was less than the measured fold change of 21.0 ± 2.0 for CG14 cells from Group 4. By Day 14, the aggrecan expression of both CG7 and CG14 cells reached similarly high levels. Intriguingly, the presence of OS cells in the subchondral layer up-regulated the aggrecan expression of undifferentiated MSCs after Day 14 from a 4.9 ± 2.0-fold change to a 20.1 ± 9.9-fold change at Day 28. Indeed, all groups containing OS cells in the subchondral layer displayed similar levels of aggrecan expression by Day 28.
The measured gene expression levels for type I collagen for all groups were relatively low when compared to the fold changes in gene expression for type II collagen and aggrecan. Differences between groups were only discerned at Day 14, where MSCs from Group 1 were found to have the highest type I collagen expression while CG cells produced the lowest (Figure 7c). Within Group 1, type I collagen expression levels dropped significantly at Day 28 when compared to Day 7. Despite already low levels, CG14 cells from Group 4 also exhibited down-regulation of type I collagen expression at Day 28 when compared to expression levels at Day 7. When type I collagen expression is combined with type II collagen expression to yield the type II collagen/type I collagen expression ratio, it was shown that CG7 cells from Group 3 achieved the highest ratios when compared to other groups at Days 7 and 14 (Figure 7d). However, no differences in fold ratio between groups were detected at Day 28 due to the high sample variation in expression ratios for CG14 cells from Group 4. For MSCs from Group 2, the type II collagen/type I collagen expression ratio increased from Day 14 to Day 28.
With regard to the type X collagen expression, results from the PCR indicated that while only the undifferentiated MSCs from Group 1 chondral layers initially exhibited low levels of expression at Day 0 (less than 10−4 fold expression relative to GAPDH), the expression levels in the chondral layer of constructs for all experimental groups were generally below the detection limit from Day 7 onwards.
3.6 ALP activity and calcium mineralization in the subchondral layer
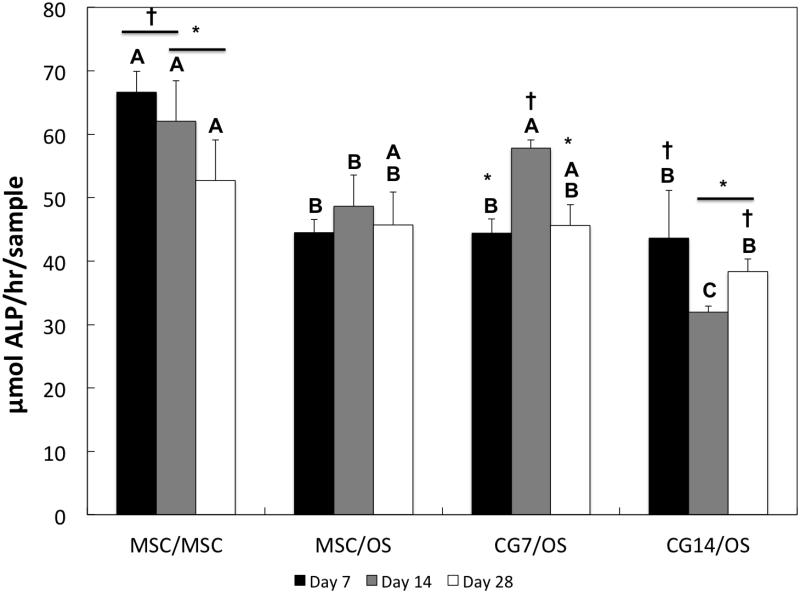
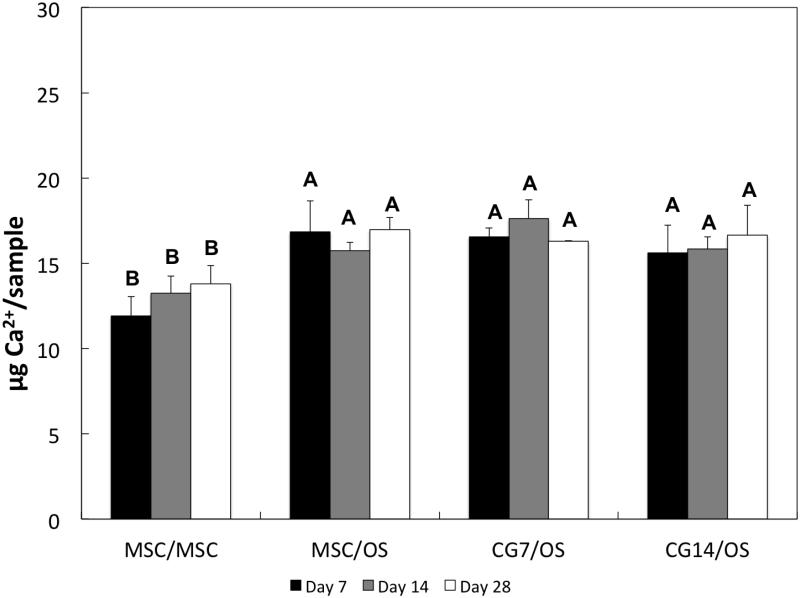
ALP activity and calcium mineralization in the subchondral layer for all groups were measured in order to evaluate the extent of osteogenic differentiation of encapsulated cells. Amongst all groups during early cultures, MSCs from Group 1 produced the highest levels of ALP activity (Figure 8), which decreased significantly by Day 28. Ca2+ mineralization of the subchondral layer was quantified for all groups in Figure 9. As expected, the amount of Ca2+ deposition was significantly higher for all groups containing OS cells at all time points when compared to Group 1 (containing undifferentiated MSCs).
Figure 8.
ALP enzyme activity of cells within the subchondral layers of bilayered hydrogel constructs at various time points. At each individual time point, groups not connected by the same letter are significantly different (p<0.05); comparing time points within each group, groups not connected by the same symbol are significantly different (p<0.05). Error bars represent the standard deviation for n = 4 samples.
Figure 9.
Ca2+ content for the subchondral layers of bilayered hydrogel constructs at various time points. At each individual time point, groups not connected by the same letter are significantly different (p<0.05). Error bars represent the standard deviation for n = 4 samples.
4. Discussion
MSCs are being increasingly recognized as powerful tools capable of inspiring dynamic and effective therapies for osteochondral tissue regeneration. However, discovering how to fully unlock their clinical potential remains a subject of extensive investigation. Accordingly, the objective of the present study was to investigate the effects of pre-differentiation on the chondrogenic and osteogenic differentiation of MSCs encapsulated within their respective layers of a bilayered OPF composite hydrogel. Specifically, we evaluated (1) how osteogenic pre-differentiation affected the chondrogenic differentiation of cells encapsulated in the chondral layer; (2) whether chondrogenically and osteogenically pre-differentiated cells maintained their differentiation states after encapsulation without growth factors; (3) how varying durations of chondrogenic pre-differentiation affected the chondrogenic and osteogenic differentiation of cells after encapsulation.
Previously, studies from our laboratory have documented that OPF hydrogel constructs can successfully support the chondrogenic differentiation of encapsulated MSCs [24-26, 32, 37]. For example, it was shown that the release of transforming growth factor-β1 (TGF-β1) from coencapsulated GMPs induced the chondrogenic differentiation of MSCs in a dose-dependent manner in vitro [26]. Additionally, enhanced chondrogenic gene expression was achieved when TGF-β1 was replaced by TGF-β3 [37]. However, the co-delivery of MSCs and TGF-β1 via OPF hydrogels to a rabbit osteochondral defect did not elicit improved tissue repair when compared to blank hydrogel controls [27]. Instead, the inclusion of MSCs appeared to have had a detrimental effect on the cartilage healing response. It was suggested that these surprising results arose from the relatively non-specific effects of TGF-β1 on MSC differentiation in vivo. Indeed, previous findings have shown that members of the TGF-β family do in fact steer the osteogenic differentiation of MSCs in vitro [38, 39] and participate in in vivo bone formation [40-42]. Additionally, combining these growth factors with undifferentiated MSCs could potentially complicate osteochondral tissue repair through the formation of heterotopic tissues and myofibroblastic scars [43, 44]. Hence, directing the differentiation of transplanted stem cells for composite tissue regeneration becomes critical.
A previous analysis of molecular markers during the in vitro chondrogenesis of MSCs delineated several distinct stages of differentiation along the chondrogenic process toward full chondrocyte commitment [45]. Specifically, the earliest stages of in vitro chondrogenesis of MSCs involve the up-regulation of the TGF-β1, TGF-β2, and TGF-β3 pathways, which are then followed by the up-regulation of the BMP and SMAD pathways as the MSCs reach the final stages of chondrocytic commitment [45]. Such changes in cellular signaling pathways suggest that the cellular secretion profiles of differentiating MSCs involve specific ligands and growth factors for the activation of these pathways. In order to achieve pre-differentiated cell populations at increasing stages of chondrogenic maturity for hydrogel encapsulation, MSCs from the present study were subjected to increasing durations of chondrogenic pre-differentiation in TGF-β3 conditioned chondrogenic media. Namely, MSCs were chondrogenically pre-differentiated for 3 days, 7 days, and 14 days, after which the cellularity, synthetic activity, and chondrogenic gene expression were compared. Although growth factors belonging to the TGF-β superfamily all play crucial roles during the embryonic development of cartilage tissues, TGF-β3 was used because numerous reports have suggested that TGF-β3 may better stimulate the synthesis of cartilage-specific ECM by MSCs [46]. Moreover, MSCs that were embedded within alginate beads retained their chondrogenic phenotype after TGF-β3 treatment and exhibited resistance to osteogenic transdifferentiation when subsequently subjected to osteogenic conditions [47]. Our results indicated that while the prescribed chondrogenic pre-differentiation scheme with TGF-β3 did not effect any detectable changes in cellularity and synthetic activity during monolayer expansion, longer periods of TGF-β3 exposure resulted in higher type II collagen and aggrecan gene expression and reduced type I collagen gene expression. Synthesis of soluble ECM components by these cell populations during monolayer expansion and the subsequent removal of these components during media changes could explain the lack of growth factor influence on detectable synthetic activity. Nonetheless, such changes in gene expression indicated that MSCs were differentiating into chondrocytes while avoiding fibroblastic transformation as influenced by the duration of growth factor exposure. Of the three different exposure durations tested, 14 days resulted in the greatest type II collagen expression and type II collagen/type I collagen expression ratio as demonstrated by CG14 cells. Despite the lack of significant difference in type II collagen expression between CG7 and CG3 cells, the former cell population exhibited increased aggrecan expression when compared to CG3 cells or MSCs. Aside from increased type I collagen expression, CG3 cells were not different from undifferentiated MSCs. 3 days of chondrogenic pre-differentiation in monolayer perhaps may not have been sufficient for the generation of a chondrogenically distinct cell population through the TGF-β-induced activation of the required BMP and SMAD pathways for chondrogenic differentiation as outlined by Chen and colleagues [45]. Indeed, it was previously reported that alginate embedded MSCs that were treated with TGF-β3 for 3 days displayed similar levels of osteogenicity when compared with untreated MSCs, suggesting a lack of commitment to the chondrogenic lineage due to insufficient growth factor exposure [47]. Furthermore, it was demonstrated that MSC pellets subjected to TGF-β3-conditioned medium at a concentration of 10 ng/mL for more than 14 days displayed hypertrophic features [48].
Since CG3 cells were not sufficiently different from undifferentiated MSCs as determined from the gene expression, CG7 and CG14 cells were selected after chondrogenic pre-differentiation and combined with OS cells or MSCs within their respective layers in bilayered OPF composites hydrogels. Specifically, the following four formulations were tested where the cell seeding density was 10 million cells per mL of the hydrogel volume (Figure 1): undifferentiated MSCs encapsulated in both layers (Group 1, MSC/MSC), undifferentiated MSCs in the chondral layer and OS cells in the subchondral layer (Group 2, MSC/OS), CG7 cells in the chondral layer and OS cells in the subchondral layer (Group 3, CG7/OS), CG14 cells in the chondral layer and OS cells in the subchondral layer (Group 4, CG14/OS).
The DNA content of both hydrogel layers, which represents an indirect measurement of cellularity, was assessed over time as shown in Figure 4. For the chondral layer, only MSCs from Groups 1 and 2 showed a decrease in cellularity from Day 7 to Day 14, after which DNA content was stabilized. These results suggested that cells remained viable within the hydrogel for up to 28 days after encapsulation and corroborated similar trends in cellularity from previous studies employing comparable OPF hydrogel constructs [26, 32, 37]. Indeed, cell viability within OPF hydrogel constructs was proven previously via LIVE/DEAD imaging [37]. Additionally, histological evaluation demonstrated that cells were spherical in morphology and homogeneously distributed after hydrogel encapsulation. It was previously shown in a similar bilayered co-culture system utilizing the same base material that osteogenically precultured cells effected a significant increase in the cellularity of uncommitted MSCs via paracrine signaling [37]. However, a comparison of DNA levels between MSC/MSC (Group 1) and MSC/OS (Group 2) indicated that the presence of OS cells within the subchondral layer did not influence MSC cellularity within the chondral layer. This could be explained by the use of OPF of a higher molecular weight in the current study for the fabrication of bilayered hydrogel constructs with greater swelling capacity [25], leading to the dilution of secreted paracrine factors capable of signaling MSC proliferation during in vitro culture.
For the chondral layer, the effect of chondrogenic pre-differentiation on cellularity became apparent at Day 14. Generally, chondrogenic preculture resulted in decreased cellularity at intermediate culture times. However, the influence of chondrogenic pre-differentiation on the cellularity of co-cultured OS cells in the subchondral was quite the inverse. Particularly, observed differences in the DNA content between groups for the subchondral layer showed that CG cells effected an increase in the cellularity, and therefore, induced the proliferation of OS cells via paracrine signaling. In addition, higher DNA content at Day 14 for OS cells co-cultured with CG14 cells as compared to those co-cultured with CG7 cells suggested that committed MSCs of greater chondrogenic maturity conferred a stronger effect on the proliferation of OS cells perhaps via the exchange of either more or stronger paracrine factors. These results align with a previous study demonstrating the stimulatory paracrine effects of chondrogenic cells on the proliferation of osteoblasts in transwell co-cultures [49]. While the paracrine secretion profile of undifferentiated MSCs have been documented to include growth factors such as hepatocyte growth factor, vascular endothelial growth factor, and interleukin-6 that can enhance the proliferation of co-cultured cells [50, 51], it is very likely that the composition of paracrine secretions from the more mature CG14 cells more reflected that of mature chondrocytes, which typically contain potent biochemical signals like TGF-β, insulin-like growth factors (IGF), and bone morphogenetic proteins (BMP) [52].
Analyses of the synthetic activity and the composition of the synthesized ECM were also performed in order to characterize the chondrogenic differentiation of cells encapsulated within the chondral layers of bilayered OPF hydrogels. Previous reports of GAG production in OPF hydrogel systems documented levels similar to those initially observed in the present study [24, 37]. However, bilayered hydrogel constructs that were fabricated using OPF macromers with higher molecular weight PEG units in the current study supported GAG production that exceeded previous levels for the pre-differentiated groups (Figure 5a). Such marked differences in synthetic activity between groups became discernible during intermediate culture times. Specifically, constructs containing CG7 cells displayed the highest level of GAG production at Day 14 when compared to other groups, suggesting that MSCs subjected to shorter durations of chondrogenic pre-differentiation remained the most chondrogenic after 3D cell encapsulation. Of the four groups tested, only constructs encapsulating CG cells in the chondral layer displayed increases in GAG production over time, suggesting a combinatory effect of chondrogenic pre-differentiation and spherical cellular morphology on synthetic activity. Interestingly, measured GAG production levels decreased after Day 14 for CG7 cells of Group 3 (Figure 5a). Given the observation of some hydrogel degradation during culture, the removal of degraded hydrogel fragments containing accumulated GAGs during routine media change could potentially explain this result.
While total GAG deposition is commonly accepted as an indirect biochemical marker of chondrogenesis [53, 54], evaluating the composition of the deposited ECM is also important. In particular, the GAG/HYP ratio relays information concerning the respective amounts of GAG and collagen that have accumulated within engineered constructs. During fetal-to-skeletal maturation, compositional changes to the structural matrix of articular cartilage mainly involve increases in collagen content with little-to-no change in accumulated GAG content [55]. This increased deposition of collagen content during development eventually bestows the mechanical integrity and tensile stability that are characteristic of adult articular cartilage. By complete maturation, hyaline articular cartilage typically comprises GAG and collagen at a ratio of approximately 2-to-1 with GAG being the major component. Hence, the GAG/HYP ratio can be employed as both an indicator of chondrogenic differentiation and chondrogenic maturity. Generally, tissue engineered cartilage constructs cultured in vitro result in net GAG amounts that exceed those of collagen [56], which is an observation confirmed by our results. As shown in Figure 5b, GAG/HYP ratios between formulations vary significantly. GAG/HYP ratios for hydrogels containing CG7 cells, while already high at Day 7, increased further by later time points. While this finding resulted mainly from increases in GAG production, it was also accompanied by negligible changes in HYP amounts (data not shown). When compared to the similar levels of GAG production but lower GAG/HYP ratios (due to increased collagen content) in CG14 cells, this suggests that CG7 cells remained chondrogenically immature in phenotype when compared to CG14 cells even after 3D encapsulation. Although the present study demonstrated the ability to obtain bilayered constructs encapsulating cells of varying chondrogenic maturities in vitro, the effect of varying chondrogenic maturity on osteochondral tissue regeneration in vivo remains poorly understood and warrants future investigation.
Although CG cells displayed differing levels of chondrogenic maturities in bilayered hydrogels, both CG7 and CG14 cells maintained their differentiated state after encapsulation within the chondral layers of bilayered OPF hydrogels without TGF-β3. This was confirmed by the up-regulation of both type II collagen and aggrecan gene expression and the down-regulation of type I collagen gene expression, where such changes in the gene expression profile have been previously utilized to indicate chondrogenic differentiation [24, 27]. Additionally, significant increases in the type II collagen and aggrecan expression and in the type II collagen/type I collagen expression ratio of Group 2 MSCs in the chondral layer over time as compared to Group 1 MSCs verified the chondrogenic effects of OS cells that were previously reported by our laboratory [32, 37]. Indeed, previous studies in our laboratory have shown that the paracrine secretion profile of osteogenically precultured rat marrow-derived MSCs consisted of various factors including TGF-β1, BMP-2, IGF-1, and fibroblastic growth factor-2 that have proven effects on MSC chondrogenesis in vitro [57, 58]. Interestingly, chondrogenically pre-differentiated cells in the chondral layer did not undergo hypertrophic changes after hydrogel encapsulation as suggested by the inability to detect (below the detection limit) type X collagen gene expression. This indicates that while cells pre-differentiated for 7 or 14 days differed in chondrogenic maturity, these durations of TGF-β3 exposure were not enough to elicit hypertrophy.
With regard to the continued osteogenic differentiation of cells encapsulated within the subchondral layer, ALP enzyme activity and Ca2+ mineralization were analyzed. In the literature, ALP activity is commonly regarded as an early biomarker of osteogenic differentiation [59], where peaks in activity typically align with cellular proliferation and precede Ca2+ mineralization [60]. In the current study, the ALP activity of undifferentiated MSCs from Group 1 was significantly higher than most groups early on (with the exception of Group 3 at Day 14). The decreased level of ALP activity in groups containing OS cells in the subchondral layer could be explained by the possibility that OS cells already achieved peaks in ALP activity because of the additional 2D osteogenic preculture. An increased level of Ca2+ mineralization, which indicates late-stage osteogenic differentiation [61], for groups containing OS cells (as seen in Figure 9) further corroborates this explanation. Intriguingly, previous findings using similar bilayered osteochondral constructs showed that the inclusion of undifferentiated MSCs and TGF-β3 in the chondral layer actually delayed the osteogenic differentiation of precultured MSCs [37]. However, the absence of any significant difference in Ca2+ deposition between MSC/OS, CG7/OS, and CG14/OS suggests a lack of an effect of chondrogenic pre-differentiation on the osteoblastic maturation of OS cells.
5. Conclusion
In the current work, osteochondral constructs were generated by encapsulating chondrogenically and osteogenically pre-differentiated MSCs within the respective chondral and subchondral layers of a bilayered hydrogel composite in a spatially controlled manner. Before cell encapsulation, chondrogenic pre-differentiation periods of 7 and 14 days allowed for the generation of distinct chondrogenic cell populations according to their unique gene expression profiles. Once encapsulated into bilayered hydrogel composites, the respective phenotypes of both chondrogenically and osteogenically pre-differentiated cells were maintained for 28 days in vitro without the need for additional growth factor treatment. Furthermore, the continued chondrogenic differentiation of cells in the chondral layer reflected different chondrogenic maturities and stimulated the proliferation of OS cells in the subchondral layer as determined by the duration of chondrogenic pre-differentiation prior to encapsulation. Collectively, the results outline the exciting potential of cell-laden hydrogel constructs for the in situ generation of osteochondral tissue constructs.
6. Acknowledgements
This study was supported by the National Institutes of Health (R01 AR048756).
List of Abbreviations
- 2D
Two-dimensional
- 3D
Three-dimensional
- ACT
Autologous chondrocyte transplantation
- ALP
Alkaline phosphatase
- APS
Ammonium persulfate
- BMP-2
Bone morphogenetic protein-2
- Ca2+
Calcium
- CG14
Chondrogenic pre-differentiation for 14 days
- CG7
Chondrogenic pre-differentiation for 7 days
- ddH2O
Distilled, deionized water
- DMEM
Dulbecco's modified Eagle's medium
- ECM
Extracellular matrix
- EO
Ethylene oxide
- GAG
Glycosaminoglycans
- GAPDH
Glyceraldehyde-3-phosphatase dehydrogenase
- GMP
Gelatin microparticle
- HYP
Hydroxyproline
- IGF-1
Insulin-like growth factor-1
- MSC
Mesenchymal stem cell
- OPF
Oligo(poly(ethylene glycol) fumarate)
- OS
Osteogenic pre-differentiation for 6 days
- PBS
Phosphate-buffered saline
- PEG
Poly(ethylene glycol)
- PEG-DA
Poly(ethylene glycol) diacrylate
- PSF
Penicillin/streptomycin/fungizone
- RT-PCR
Reverse transcriptase polymerase chain reaction
- TEMED
N,N,N',N'-tetramethylethylenediamine
- TGF-β1
Transforming growth factor-beta 1
- TGF-β3
Transforming growth factor-beta 3
Footnotes
Publisher's Disclaimer: This is a PDF file of an unedited manuscript that has been accepted for publication. As a service to our customers we are providing this early version of the manuscript. The manuscript will undergo copyediting, typesetting, and review of the resulting proof before it is published in its final citable form. Please note that during the production process errors may be discovered which could affect the content, and all legal disclaimers that apply to the journal pertain.
References
- 1.Curl WW, Krome J, Gordon ES, Rushing J, Smith BP, Poehling GG. Cartilage injuries: a review of 31,516 knee arthroscopies. Arthroscopy. 1997;13:456–60. doi: 10.1016/s0749-8063(97)90124-9. [DOI] [PubMed] [Google Scholar]
- 2.Widuchowski W, Widuchowski J, Trzaska T. Articular cartilage defects: study of 25,124 knee arthroscopies. Knee. 2007;14:177–82. doi: 10.1016/j.knee.2007.02.001. [DOI] [PubMed] [Google Scholar]
- 3.Spiller KL, Maher SA, Lowman AM. Hydrogels for the repair of articular cartilage defects. Tissue Eng Part B Rev. 2011;17:281–99. doi: 10.1089/ten.teb.2011.0077. [DOI] [PMC free article] [PubMed] [Google Scholar]
- 4.Mithoefer K, McAdams T, Williams RJ, Kreuz PC, Mandelbaum BR. Clinical efficacy of the microfracture technique for articular cartilage repair in the knee: an evidence-based systematic analysis. Am J Sports Med. 2009;37:2053–63. doi: 10.1177/0363546508328414. [DOI] [PubMed] [Google Scholar]
- 5.Hangody L, Vasarhelyi G, Hangody LR, Sukosd Z, Tibay G, Bartha L, et al. Autologous osteochondral grafting--technique and long-term results. Injury. 2008;39(Suppl 1):S32–9. doi: 10.1016/j.injury.2008.01.041. [DOI] [PubMed] [Google Scholar]
- 6.Tetta C, Busacca M, Moio A, Rinaldi R, Delcogliano M, Kon E, et al. Knee osteochondral autologous transplantation: long-term MR findings and clinical correlations. Eur J Radiol. 2010;76:117–23. doi: 10.1016/j.ejrad.2009.05.011. [DOI] [PubMed] [Google Scholar]
- 7.Marcacci M, Filardo G, Kon E. Treatment of cartilage lesions: what works and why? Injury. 2013;44(Suppl 1):S11–5. doi: 10.1016/S0020-1383(13)70004-4. [DOI] [PubMed] [Google Scholar]
- 8.Brittberg M. Autologous chondrocyte implantation--technique and long-term follow-up. Injury. 2008;39(Suppl 1):S40–9. doi: 10.1016/j.injury.2008.01.040. [DOI] [PubMed] [Google Scholar]
- 9.Brittberg M, Lindahl A, Nilsson A, Ohlsson C, Isaksson O, Peterson L. Treatment of deep cartilage defects in the knee with autologous chondrocyte transplantation. N Engl J Med. 1994;331:889–95. doi: 10.1056/NEJM199410063311401. [DOI] [PubMed] [Google Scholar]
- 10.Kon E, Verdonk P, Condello V, Delcogliano M, Dhollander A, Filardo G, et al. Matrix-assisted autologous chondrocyte transplantation for the repair of cartilage defects of the knee: systematic clinical data review and study quality analysis. Am J Sports Med. 2009;37(Suppl 1):156S–66S. doi: 10.1177/0363546509351649. [DOI] [PubMed] [Google Scholar]
- 11.Hwang NS, Elisseeff J. Application of stem cells for articular cartilage regeneration. J Knee Surg. 2009;22:60–71. doi: 10.1055/s-0030-1247728. [DOI] [PubMed] [Google Scholar]
- 12.Kon E, Filardo G, Roffi A, Andriolo L, Marcacci M. New trends for knee cartilage regeneration: from cell-free scaffolds to mesenchymal stem cells. Curr Rev Musculoskelet Med. 2012;5:236–43. doi: 10.1007/s12178-012-9135-x. [DOI] [PMC free article] [PubMed] [Google Scholar]
- 13.Wakitani S, Goto T, Pineda SJ, Young RG, Mansour JM, Caplan AI, et al. Mesenchymal cell-based repair of large, full-thickness defects of articular cartilage. J Bone Joint Surg Am. 1994;76:579–92. doi: 10.2106/00004623-199404000-00013. [DOI] [PubMed] [Google Scholar]
- 14.Caplan AI, Elyaderani M, Mochizuki Y, Wakitani S, Goldberg VM. Principles of cartilage repair and regeneration. Clin Orthop Relat Res. 1997:254–69. [PubMed] [Google Scholar]
- 15.Filardo G, Madry H, Jelic M, Roffi A, Cucchiarini M, Kon E. Mesenchymal stem cells for the treatment of cartilage lesions: from preclinical findings to clinical application in orthopaedics. Knee Surg Sports Traumatol Arthrosc. 2013 doi: 10.1007/s00167-012-2329-3. [DOI] [PubMed] [Google Scholar]
- 16.Zscharnack M, Hepp P, Richter R, Aigner T, Schulz R, Somerson J, et al. Repair of chronic osteochondral defects using pre-differentiated mesenchymal stem cells in an ovine model. Am J Sports Med. 2010;38:1857–69. doi: 10.1177/0363546510365296. [DOI] [PubMed] [Google Scholar]
- 17.Marquass B, Schulz R, Hepp P, Zscharnack M, Aigner T, Schmidt S, et al. Matrix-associated implantation of pre-differentiated mesenchymal stem cells versus articular chondrocytes: in vivo results of cartilage repair after 1 year. Am J Sports Med. 2011;39:1401–12. doi: 10.1177/0363546511398646. [DOI] [PubMed] [Google Scholar]
- 18.Grayson WL, Bhumiratana S, Grace Chao PH, Hung CT, Vunjak-Novakovic G. Spatial regulation of human mesenchymal stem cell differentiation in engineered osteochondral constructs: effects of pre-differentiation, soluble factors and medium perfusion. Osteoarthritis Cartilage. 2010;18:714–23. doi: 10.1016/j.joca.2010.01.008. [DOI] [PMC free article] [PubMed] [Google Scholar]
- 19.Guarino V, Gloria A, Raucci MG, Ambrosio L. Hydrogel-Based Platforms for the Regeneration of Osteochondral Tissue and Intervertebral Disc. Polymers. 2012;4:1590–612. [Google Scholar]
- 20.Nooeaid P, Salih V, Beier JP, Boccaccini AR. Osteochondral tissue engineering: scaffolds, stem cells and applications. J Cell Mol Med. 2012;16:2247–70. doi: 10.1111/j.1582-4934.2012.01571.x. [DOI] [PMC free article] [PubMed] [Google Scholar]
- 21.Jo S, Shin H, Shung AK, Fisher JP, Mikos AG. Synthesis and characterization of oligo(poly(ethylene glycol) fumarate) macromer. Macromolecules. 2001;34:2839–44. [Google Scholar]
- 22.Kinard LA, Kasper FK, Mikos AG. Synthesis of oligo(poly(ethylene glycol) fumarate) Nat Protoc. 2012;7:1219–27. doi: 10.1038/nprot.2012.055. [DOI] [PMC free article] [PubMed] [Google Scholar]
- 23.Park H, Temenoff JS, Holland TA, Tabata Y, Mikos AG. Delivery of TGF-beta1 and chondrocytes via injectable, biodegradable hydrogels for cartilage tissue engineering applications. Biomaterials. 2005;26:7095–103. doi: 10.1016/j.biomaterials.2005.05.083. [DOI] [PubMed] [Google Scholar]
- 24.Park H, Temenoff JS, Tabata Y, Caplan AI, Raphael RM, Jansen JA, et al. Effect of dual growth factor delivery on chondrogenic differentiation of rabbit marrow mesenchymal stem cells encapsulated in injectable hydrogel composites. J Biomed Mater Res A. 2009;88:889–97. doi: 10.1002/jbm.a.31948. [DOI] [PubMed] [Google Scholar]
- 25.Park H, Guo X, Temenoff JS, Tabata Y, Caplan AI, Kasper FK, et al. Effect of swelling ratio of injectable hydrogel composites on chondrogenic differentiation of encapsulated rabbit marrow mesenchymal stem cells in vitro. Biomacromolecules. 2009;10:541–6. doi: 10.1021/bm801197m. [DOI] [PMC free article] [PubMed] [Google Scholar]
- 26.Park H, Temenoff JS, Tabata Y, Caplan AI, Mikos AG. Injectable biodegradable hydrogel composites for rabbit marrow mesenchymal stem cell and growth factor delivery for cartilage tissue engineering. Biomaterials. 2007;28:3217–27. doi: 10.1016/j.biomaterials.2007.03.030. [DOI] [PMC free article] [PubMed] [Google Scholar]
- 27.Guo X, Park H, Young S, Kretlow JD, van den Beucken JJ, Baggett LS, et al. Repair of osteochondral defects with biodegradable hydrogel composites encapsulating marrow mesenchymal stem cells in a rabbit model. Acta Biomater. 2010;6:39–47. doi: 10.1016/j.actbio.2009.07.041. [DOI] [PMC free article] [PubMed] [Google Scholar]
- 28.Lim CT, Ren X, Afizah MH, Tarigan-Panjaitan S, Yang Z, Wu Y, et al. Repair of Osteochondral Defects with Rehydrated Freeze-Dried Oligo[Poly(Ethylene Glycol) Fumarate] Hydrogels Seeded with Bone Marrow Mesenchymal Stem Cells in a Porcine Model. Tissue Eng Part A. 2013 doi: 10.1089/ten.TEA.2012.0621. [DOI] [PubMed] [Google Scholar]
- 29.Holland TA, Tabata Y, Mikos AG. In vitro release of transforming growth factor-beta 1 from gelatin microparticles encapsulated in biodegradable, injectable oligo(poly(ethylene glycol) fumarate) hydrogels. J Control Release. 2003;91:299–313. doi: 10.1016/s0168-3659(03)00258-x. [DOI] [PubMed] [Google Scholar]
- 30.Holland TA, Tessmar JK, Tabata Y, Mikos AG. Transforming growth factor-beta 1 release from oligo(poly(ethylene glycol) fumarate) hydrogels in conditions that model the cartilage wound healing environment. J Control Release. 2004;94:101–14. doi: 10.1016/j.jconrel.2003.09.007. [DOI] [PubMed] [Google Scholar]
- 31.Solchaga LA, Gao J, Dennis JE, Awadallah A, Lundberg M, Caplan AI, et al. Treatment of osteochondral defects with autologous bone marrow in a hyaluronan-based delivery vehicle. Tissue Eng. 2002;8:333–47. doi: 10.1089/107632702753725085. [DOI] [PubMed] [Google Scholar]
- 32.Guo X, Park H, Liu G, Liu W, Cao Y, Tabata Y, et al. In vitro generation of an osteochondral construct using injectable hydrogel composites encapsulating rabbit marrow mesenchymal stem cells. Biomaterials. 2009;30:2741–52. doi: 10.1016/j.biomaterials.2009.01.048. [DOI] [PMC free article] [PubMed] [Google Scholar]
- 33.Kim K, Lam J, Lu S, Spicer PP, Lueckgen A, Tabata Y, et al. Osteochondral tissue regeneration using a bilayered composite hydrogel with modulating dual growth factor release kinetics in a rabbit model. J Control Release. 2013;168:166–78. doi: 10.1016/j.jconrel.2013.03.013. [DOI] [PMC free article] [PubMed] [Google Scholar]
- 34.Schmittgen TD, Livak KJ. Analyzing real-time PCR data by the comparative C(T) method. Nat Protoc. 2008;3:1101–8. doi: 10.1038/nprot.2008.73. [DOI] [PubMed] [Google Scholar]
- 35.Farndale RW, Buttle DJ, Barrett AJ. Improved quantitation and discrimination of sulphated glycosaminoglycans by use of dimethylmethylene blue. Biochim Biophys Acta. 1986;883:173–7. doi: 10.1016/0304-4165(86)90306-5. [DOI] [PubMed] [Google Scholar]
- 36.Meretoja VV, Dahlin RL, Wright S, Kasper FK, Mikos AG. The effect of hypoxia on the chondrogenic differentiation of co-cultured articular chondrocytes and mesenchymal stem cells in scaffolds. Biomaterials. 2013;34:4266–73. doi: 10.1016/j.biomaterials.2013.02.064. [DOI] [PMC free article] [PubMed] [Google Scholar]
- 37.Guo X, Liao J, Park H, Saraf A, Raphael RM, Tabata Y, et al. Effects of TGF-beta3 and preculture period of osteogenic cells on the chondrogenic differentiation of rabbit marrow mesenchymal stem cells encapsulated in a bilayered hydrogel composite. Acta Biomater. 2010;6:2920–31. doi: 10.1016/j.actbio.2010.02.046. [DOI] [PMC free article] [PubMed] [Google Scholar]
- 38.Lieb E, Vogel T, Milz S, Dauner M, Schulz MB. Effects of transforming growth factor beta1 on bonelike tissue formation in three-dimensional cell culture. II: Osteoblastic differentiation. Tissue Eng. 2004;10:1414–25. doi: 10.1089/ten.2004.10.1414. [DOI] [PubMed] [Google Scholar]
- 39.Moioli EK, Hong L, Guardado J, Clark PA, Mao JJ. Sustained release of TGFbeta3 from PLGA microspheres and its effect on early osteogenic differentiation of human mesenchymal stem cells. Tissue Eng. 2006;12:537–46. doi: 10.1089/ten.2006.12.537. [DOI] [PMC free article] [PubMed] [Google Scholar]
- 40.Mackie EJ, Trechsel U. Stimulation of bone formation in vivo by transforming growth factor-beta: remodeling of woven bone and lack of inhibition by indomethacin. Bone. 1990;11:295–300. doi: 10.1016/8756-3282(90)90083-b. [DOI] [PubMed] [Google Scholar]
- 41.Noda M, Camilliere JJ. In vivo stimulation of bone formation by transforming growth factor-beta. Endocrinology. 1989;124:2991–4. doi: 10.1210/endo-124-6-2991. [DOI] [PubMed] [Google Scholar]
- 42.Simmons CA, Alsberg E, Hsiong S, Kim WJ, Mooney DJ. Dual growth factor delivery and controlled scaffold degradation enhance in vivo bone formation by transplanted bone marrow stromal cells. Bone. 2004;35:562–9. doi: 10.1016/j.bone.2004.02.027. [DOI] [PubMed] [Google Scholar]
- 43.Hinz B. Formation and function of the myofibroblast during tissue repair. J Invest Dermatol. 2007;127:526–37. doi: 10.1038/sj.jid.5700613. [DOI] [PubMed] [Google Scholar]
- 44.Hinz B, Phan SH, Thannickal VJ, Galli A, Bochaton-Piallat ML, Gabbiani G. The myofibroblast: one function, multiple origins. Am J Pathol. 2007;170:1807–16. doi: 10.2353/ajpath.2007.070112. [DOI] [PMC free article] [PubMed] [Google Scholar]
- 45.Chen WH, Lai MT, Wu AT, Wu CC, Gelovani JG, Lin CT, et al. In vitro stage-specific chondrogenesis of mesenchymal stem cells committed to chondrocytes. Arthritis Rheum. 2009;60:450–9. doi: 10.1002/art.24265. [DOI] [PubMed] [Google Scholar]
- 46.Barry F, Boynton RE, Liu B, Murphy JM. Chondrogenic differentiation of mesenchymal stem cells from bone marrow: differentiation-dependent gene expression of matrix components. Exp Cell Res. 2001;268:189–200. doi: 10.1006/excr.2001.5278. [DOI] [PubMed] [Google Scholar]
- 47.Mehlhorn AT, Schmal H, Kaiser S, Lepski G, Finkenzeller G, Stark GB, et al. Mesenchymal stem cells maintain TGF-beta-mediated chondrogenic phenotype in alginate bead culture. Tissue Eng. 2006;12:1393–403. doi: 10.1089/ten.2006.12.1393. [DOI] [PubMed] [Google Scholar]
- 48.Mueller MB, Fischer M, Zellner J, Berner A, Dienstknecht T, Prantl L, et al. Hypertrophy in mesenchymal stem cell chondrogenesis: effect of TGF-beta isoforms and chondrogenic conditioning. Cells Tissues Organs. 2010;192:158–66. doi: 10.1159/000313399. [DOI] [PMC free article] [PubMed] [Google Scholar]
- 49.Nakaoka R, Hsiong SX, Mooney DJ. Regulation of chondrocyte differentiation level via coculture with osteoblasts. Tissue Eng. 2006;12:2425–33. doi: 10.1089/ten.2006.12.2425. [DOI] [PubMed] [Google Scholar]
- 50.Weil BR, Markel TA, Herrmann JL, Abarbanell AM, Meldrum DR. Mesenchymal stem cells enhance the viability and proliferation of human fetal intestinal epithelial cells following hypoxic injury via paracrine mechanisms. Surgery. 2009;146:190–7. doi: 10.1016/j.surg.2009.03.031. [DOI] [PubMed] [Google Scholar]
- 51.Wu L, Leijten JC, Georgi N, Post JN, van Blitterswijk CA, Karperien M. Trophic effects of mesenchymal stem cells increase chondrocyte proliferation and matrix formation. Tissue Eng Part A. 2011;17:1425–36. doi: 10.1089/ten.TEA.2010.0517. [DOI] [PubMed] [Google Scholar]
- 52.Liu X, Sun H, Yan D, Zhang L, Lv X, Liu T, et al. In vivo ectopic chondrogenesis of BMSCs directed by mature chondrocytes. Biomaterials. 2010;31:9406–14. doi: 10.1016/j.biomaterials.2010.08.052. [DOI] [PubMed] [Google Scholar]
- 53.Salinas CN, Cole BB, Kasko AM, Anseth KS. Chondrogenic differentiation potential of human mesenchymal stem cells photoencapsulated within poly(ethylene glycol)-arginine-glycine-aspartic acid-serine thiol-methacrylate mixed-mode networks. Tissue Eng. 2007;13:1025–34. doi: 10.1089/ten.2006.0126. [DOI] [PubMed] [Google Scholar]
- 54.Freed LE, Hollander AP, Martin I, Barry JR, Langer R, Vunjak-Novakovic G. Chondrogenesis in a cell-polymer-bioreactor system. Exp Cell Res. 1998;240:58–65. doi: 10.1006/excr.1998.4010. [DOI] [PubMed] [Google Scholar]
- 55.Williamson AK, Chen AC, Sah RL. Compressive properties and function-composition relationships of developing bovine articular cartilage. J Orthop Res. 2001;19:1113–21. doi: 10.1016/S0736-0266(01)00052-3. [DOI] [PubMed] [Google Scholar]
- 56.Asanbaeva A, Masuda K, Thonar EJ, Klisch SM, Sah RL. Mechanisms of cartilage growth: modulation of balance between proteoglycan and collagen in vitro using chondroitinase ABC. Arthritis Rheum. 2007;56:188–98. doi: 10.1002/art.22298. [DOI] [PubMed] [Google Scholar]
- 57.Gomes OA, Castelucci P, de Vasconcellos Fontes RB, Liberti EA. Effects of pre- and postnatal protein deprivation and postnatal refeeding on myenteric neurons of the rat small intestine: a quantitative morphological study. Auton Neurosci. 2006;126-127:277–84. doi: 10.1016/j.autneu.2006.03.003. [DOI] [PubMed] [Google Scholar]
- 58.Pham QP, Kasper FK, Scott Baggett L, Raphael RM, Jansen JA, Mikos AG. The influence of an in vitro generated bone-like extracellular matrix on osteoblastic gene expression of marrow stromal cells. Biomaterials. 2008;29:2729–39. doi: 10.1016/j.biomaterials.2008.02.025. [DOI] [PubMed] [Google Scholar]
- 59.Temenoff JS, Park H, Jabbari E, Sheffield TL, LeBaron RG, Ambrose CG, et al. In vitro osteogenic differentiation of marrow stromal cells encapsulated in biodegradable hydrogels. J Biomed Mater Res A. 2004;70:235–44. doi: 10.1002/jbm.a.30064. [DOI] [PubMed] [Google Scholar]
- 60.Lian JB, Stein GS. Concepts of osteoblast growth and differentiation: basis for modulation of bone cell development and tissue formation. Crit Rev Oral Biol Med. 1992;3:269–305. doi: 10.1177/10454411920030030501. [DOI] [PubMed] [Google Scholar]
- 61.Castano-Izquierdo H, Alvarez-Barreto J, van den Dolder J, Jansen JA, Mikos AG, Sikavitsas VI. Pre-culture period of mesenchymal stem cells in osteogenic media influences their in vivo bone forming potential. J Biomed Mater Res A. 2007;82:129–38. doi: 10.1002/jbm.a.31082. [DOI] [PubMed] [Google Scholar]


