

Abstract
Protein–protein interactions (PPIs) have been identified as a vital regulator of cellular pathways and networks. However, the determinants that control binding affinity and specificity at protein surfaces are incompletely characterized and thus unable to be exploited for the purpose of developing PPI inhibitors to control cellular pathways in disease states. One of the key factors in intermolecular interactions that remains poorly understood is the role of water molecules and in particular the importance of solvent entropy. This factor is expected to be particularly important at protein surfaces, and the release of water molecules from hydrophobic regions is one of the most important drivers of PPIs. In this work, we have studied the protein surface of a mutant of the protein RadA to quantify the thermodynamics of surface water molecules. RadA and its human homologue RAD51 function as recombinases in the process of homologous recombination. RadA binds to itself to form oligomeric structures and thus contains a well-characterized protein–protein binding surface. Similarly, RAD51 binds either to itself to form oligomers or to the protein BRCA2 to form filaments. X-ray crystallography has determined that the same interface functions in both interactions. Work in our group has generated a partially humanized mutant of RadA, termed MAYM, which has been crystallized in the apo form. We studied this apo form of MAYM using a combination of molecular dynamics (MD) simulations and inhomogeneous fluid solvation theory (IFST). The method locates a number of the hydration sites observed in the crystal structure and locates hydrophobic sites where hydrophobic species are known to bind experimentally. The simulations also highlight the importance of the restraints placed on the protein in determining the results. Finally, the results identify a correlation between the predicted entropy of water molecules at a given site and the solvent-accessible surface area and suggest that correlations between water molecules only need to be considered for water molecules separated by less than 3.2 Å. The combination of MD and IFST has been used previously to study PPIs and represents one of the few existing methods to quantify solvent thermodynamics. This is a vital aspect of molecular recognition and one which we believe must be developed.
Introduction
Protein–protein interactions (PPIs) are essential in controlling cellular networks and play an important role in many disease states.1 Significant efforts are now being focused on understanding the nature of the intermolecular interactions in PPIs, and computational methods are a key aspect of increasing our understanding.2,3 In addition, PPIs are now increasingly being targeted for drug development, and computational methods are commonly combined with structural data in virtual screening and lead optimization for PPI targets.4 One aspect of molecular interactions that is particularly important for understanding PPIs is hydrophobic association driven by desolvation of nonpolar protein surfaces. Water molecules form significant hydrogen bonding interactions in bulk water and are somewhat ordered. Conversely, water molecules at a hydrophobic surface have reduced hydrogen bonding interactions and have differing levels of order, dependent upon the environment. The balance of these components is one of the key factors that controls the thermodynamics of binding. This has been proposed as the principal driving force for binding in a number of systems and also impacts protein folding and stability.5 In this study, we apply solvation thermodynamics to a prototypical PPI surface.
Recombinase Biology
Recombinases such as RadA and RAD51 are key factors in the process of homologous recombination (HR) to repair broken double strand breaks (DSBs) in DNA.6 The human RAD51 recombinase is known to form an oligomeric structure in the cell, where it is sequestered until needed for HR. Shortly after DNA replication, RAD51 is loaded onto DNA around DSBs by association with the so-called BRC repeats of the regulatory BRCA2 protein.7 RadA, the archaeal homologue of RAD51, is sequestered in oligomeric structure in the cell but appears to bind DNA as a helical filament without the presence of a regulatory protein.8 The interface for oligomerization has been identified in RadA and RAD51 by crystallography.9,10 The key determinant of binding is the presence of a hydrophobic pocket on the surface that binds a phenylalanine residue.11 Another smaller pocket is found in close proximity and binds an alanine residue. These pockets are termed the phenylalanine pocket and the alanine pocket. RadA and RAD51 oligomerize by bringing together their hydrophobic surfaces with an FMRA and an FTTA sequence, respectively. The BRC repeats of BRCA2 also exploit these pockets to bind RAD51 with a conserved FXXA motif.12 In addition, these pockets are surrounded by a surface dotted with hydrophobic patches, as shown in Figure 1a for MAYM and Figure 1b for RAD51. This surface is thus typical of a PPI and provides a good test case to explore the thermodynamics of solvation and how it contributes to protein–protein association.
Figure 1.
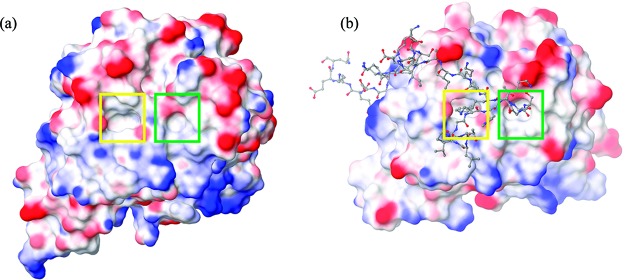
(a) The molecular surface of RAD51 in complex with the BRC4 peptide from PDBID 1N0W. (b) The molecular surface of MAYM. RAD51 and MAYM are colored by electrostatic potential and BRC4 is displayed as atom colored balls and sticks. The phenylalanine and alanine pockets are boxed in yellow and green, respectively.
Inhomogeneous Fluid Solvation Theory
Inhomogeneous fluid solvation theory (IFST) was developed by Lazaridis as a method to study hydrophobic hydration13 by calculating interactions and correlations between water molecules through an analysis of molecular dynamics (MD) or Monte Carlo (MC) simulations. IFST was initially used to study pure water,14 but the theory was then extended to consider small hydrophobic solutes15 and then to consider protein binding sites.16 In IFST, bulk water is considered as a reference state, and other molecules perturb this state, resulting in a change in enthalpy and entropy.17 This is quantified by calculating the interaction energies and the correlation functions between the water molecules and the solute.15 Regions of high water density are identified and then analyzed to compare the enthalpy and entropy with water molecules in bulk solvent. The methodology is described in detail below. IFST has been used to analyze a number of ligand binding sites to elucidate the role of water molecules.16,18,19 IFST has also shown success in predicting binding affinities and has recently been implemented in Schrodinger’s WaterMap software.20,21 WaterMap has also been applied to explain binding affinities and specificities for PDZ domain22 and for the polo-box domain of the mitotic kinase PLK1.23 It has also been employed recently by Zielkiewicz to study water molecules around simple polypeptides.24
Here, we apply IFST to the protein surface of the RadA MAYM mutant and explore the thermodynamic properties of water molecules at a PPI interface. This analysis quantifies the intermolecular interactions that underlie PPIs and allows the identification of potential binding hotspot regions.
Materials and Methods
We performed MD simulations of bulk water and of the apo MAYM protein using NAMD25 using a number of simulation protocols.
Crystallography
The crystal structure of RadA was taken from a protein construct of Pyrococcus furiosus RadA (accession number AF052597) containing residues 108–349 (Marsh et al., unpublished). Residues 288–300 in the L2 loop were replaced by a single Asn residue, and residues 108–286, 304–329, and 336–349 have assigned density. The MAYM form of RadA has four humanizing mutations: I169M, Y201A, V202Y, K221M. The crystal structure contains one DMSO solvent molecule and one phosphate group. This protein construct lacks an N-terminal domain and thus does not oligomerize. However, the N-terminal domain is located over 15 Å from the phenylalanine and alanine pockets9,26 and is thus unlikely to affect the properties of this surface.
Structure Preparation
The protein structure was initially prepared as follows. Atom coordinates for the protein and the water molecules were taken from the X-ray crystal structure. The DMSO solvent molecule and the phosphate group were deleted from the structure. The hydrogen-atom positions for the protein and the water molecules were then built using the PSFGEN mode of VMD27 with the CHARMM27 energy function.28,29 Histidine residues were then manually checked for protonation state. His210, His243, and His269 were assigned as epsilon protonated. All remaining histidines were assigned as delta protonated. The residues lysine, arginine, aspartate, glutamate, cysteine, and tyrosine were also analyzed to check their protonation state. There was no evidence of any unusual protonation states, and thus all lysine and arginine residues were assigned as positively charged, all aspartate and glutamate residues were assigned as negatively charged, and all cysteine and tyrosine residues were assigned as neutral. The terminal residues 304 and 336 were patched with an N-acetyl group, and the terminal residues 286 and 329 were patched with an N-methyl amide group. The atomic charges were assigned from the CHARMM27 forcefield.28,29 All water molecules were modeled with the TIP4P/2005 water model.30 The next stage was to solvate the protein with water molecules. All the water molecules observed in the crystal structure were retained. Solvation was performed with the SOLVATE program31 version 1.0 from the Max Planck Institute to generate a solvation sphere of radius 50 Å around the center of the protein. No ions were included in the solution, as the protein has a net charge of zero. The system was then cut to form a rhombic dodecahedron (RHDO) with an edge length of 60 Å using the CHARMM program (version 34b1).32
Equilibration
During all simulations with the RHDO, the protein atoms were fixed, the RHDO was treated using periodic boundary conditions, and the electrostatics were modeled using the particle mesh Ewald method.33 The water molecules in the RHDO were first subjected to energy minimization for 10 000 steps using NAMD. This was followed by MD equilibration for 100 ps in an NPT ensemble and then MD equilibration for 100 ps in an NVT ensemble. This stage of preparation was undertaken to equilibrate the density of the water molecules at the surface. The density of the water molecules plays an important role in IFST and is thus important to converge accurately. We ensured that the system was brought to equilibrium before continuing our simulations by verifying that the system reached a point where the energy fluctuations were stable. In the next stage, the RHDO was cut to form a sphere of water molecules around the binding pocket of interest using the CHARMM program. The solvent sphere of radius 20 Å was centered at the coordinates of the CA atom of Ala201. This is defined as the centroid of the solvent sphere. The resulting system containing the protein and a sphere of water molecules was then treated with three protocols. For each protocol, the system was subjected to MD equilibration for 100 ps using NAMD with spherical boundary conditions.34 Again, we ensured that the system was brought to equilibrium before beginning the MD simulation by verifying that the system reached a point where the energy fluctuations were stable for each protocol. The three protocols are as follows:
-
(1)
Fixed: All protein atoms were kept fixed.
-
(2)
Restrained: All atoms of any residue partially or completely outside the 20 Å sphere were fixed in place. All heavy atoms of any residue completely inside the 20 Å sphere were restrained using a 1.0 kcal/mol/Å2 harmonic force.
-
(3)
Free: All atoms of any residue partially or completely outside the 20 Å sphere were fixed in place. All atoms of any residue completely inside the 20 Å sphere were not constrained.
Molecular Dynamics
Production simulations were performed for 10.0 ns at 300 K. All MD simulations were performed using the NAMD program version 2.7b332 with the CHARMM27 force field28,29 using an MD time step of 2.0 fs. Electrostatic interactions were modeled with a uniform dielectric and a dielectric constant of 1.0 throughout the setup and production runs. Van der waals interactions were truncated at 12.0 Å with switching from 8.0 Å. Bulk solvent was simulated as a periodic box of edge length 25 Å for a period of 8 ns using the same methods, parameters, and equilibration procedures detailed above.
Clustering
The 10.0 ns MD runs were first analyzed to cluster the water molecules into distinct spherical regions of high number density. These regions have been termed hydration sites in previous work using IFST,20 and we retain this terminology here. We employed a radius of 1.2 Å for these hydration sites, in line with prior work.18 The hydration sites were selected by sampling 1000 snapshots from the MD trajectory. All 1000 snapshots were superposed to generate a profile of the water density. Within the complete water density profile, we identified the oxygen atom of the water molecule with the largest number of water molecules within a 1.2 Å radius. The 1.2 Å sphere around the position of this oxygen atom was defined as a hydration site. This water molecule and all of its neighboring water molecules within 1.2 Å from any snapshot were excluded from further consideration. The process was then repeated to identify more hydration sites, allowing no new hydration sites within 1.2 Å of a previously defined hydration site. This iteration was terminated once when the density of an identified hydration sites fell below 1.5 times the number density of bulk water, which corresponds to an occupancy of 0.36 in the sphere of radius 1.2 Å. Only hydration sites within 12.0 Å of the solvation sphere center were considered. The resultant set of hydration sites was then subjected to energy and entropy calculations using IFST.
Energy Calculations
The interaction energy of each hydration site was calculated by sampling 5000 snapshots, taken every 2 ps from the 10.0 ns simulation. For each snapshot, we computed the average interaction energy with both the protein and all the other water molecules with VMD version 1.8.7 using the namdenergy plugin. This was then compared with the interaction energy of a water molecule determined from the bulk water simulation (−23.62 kcal/mol) to calculate the energy difference ΔE shown in eq 1.
| 1 |
In this equation, ΔE is the energy difference, E̅water/proteinsurface is the mean interaction energy between a water molecule in the hydration site and the protein, E̅water/water is the mean interaction energy between a water molecule in the hydration site and all of the other water molecules, and E̅water/waterbulk is the mean total interaction energy of a water molecule in bulk.
Entropy Calculations
The entropy of each hydration site was calculated by sampling 100 000 snapshots, taken every 100 fs from the 10.0 ns simulation. The entropy difference between a water molecule at a hydration site and in bulk was calculated from the contributions of the protein–water term (Spw), the water–water reorganization term (Sww), and a term arising from the change in density (Sdensity).35 These terms can be calculated by integrating over the protein–water gpw(r,ω) and water–water gww(r,ω,r′,ω′) correlation functions, where the variable r represents the position of the water molecule with respect to the center of the hydration site, and the Euler angles ω represent the orientation of the water molecule in the fixed protein reference frame. As in previous work, only correlations between two species were considered.18,20 The protein–water correlations function were calculated using a bin size of 0.06 Å for the radial component and 18° for the angular components. The protein–water and contribution to the entropy of changing the number density35 can be calculated for each hydration site using eqs 2 and 3, where k is Boltzmann’s constant, ρ is the number density of bulk solvent, ρsite is the number density of the hydration site being considered, and Ω is the integral over the Euler angles ω.
 |
As in previous work, the protein–water term was separated into translational, Stranspw, and orientational, Spw, entropic contributions, and the orientational distributions were assumed to be independent of the position of the water molecules within the sites.18 The entropies were calculated using eqs 4 and 5, where gtranspw(r) and gpw(ω) are the translational and orientational correlation functions.
 |
The water–water reorganization term was calculated for each pair of hydration sites within a distance of 3.5 Å. This distance corresponds to water molecules in the first solvation shell of a water molecule in bulk. The water–water correlation functions were calculated using a bin size of 0.1 Å for the radial component and 18° for the angular components. For a given hydration site, the total reorganization entropy was calculated as the sum of the pairs of proximal sites. This term was then compared with the entropy of a water molecule from the bulk water simulation due to other water molecules within 3.5 Å (11.24 cal/mol/K). The entropies were calculated using eq 6.
| 6 |
ΔSww is the water–water entropy change, Sw,w′ is the pair entropy between a water molecule in the hydration site and a water molecule in another hydration site and Sbulkww is the pair entropy of a water molecule in bulk. The contribution to the enthalpy from water–water correlations was also split into translational and orientational contributions. However, because of the vast amount of data required to accurately calculate the multidimensional water–water correlation functions, we employed two approximations first proposed by Li and Lazaridis.18 The first is that the water–water correlation functions can be treated as dependent only on the relative orientation of the two water molecules and the distance between the centers of the two hydration sites. This correlation function can, in turn, be separated into translational and orientational contributions.
In these equations, gww are the water–water correlation functions, r′ represents the position of the second water molecule with respect to the center of its hydration site, ω′ represents the orientation of the second water molecule in the fixed protein reference frame, the variable R is the distance between the centers of the two hydration sites, and ωrel|R is the relative orientation of two water molecules at a distance R. The second approximation is that the water–water correlation functions for the bound waters are the same as the water–water correlation functions in bulk water. This leads to eqs 9, 10, and 11, where the variables θ1, θ2, χ1, χ2, and φ are the five angles that specify the relative orientation of two water molecules.14
 |
Application of these approximations leads to eqs 12 and 13.
 |
The water–water correlation functions were calculated from the 8 ns simulation of bulk water, using all available water pairs. All calculations were performed using the Darwin Supercomputer of the University of Cambridge High Performance Computing Service (http://www.hpc.cam.ac.uk/) and were funded by the EPSRC under grant EP/F032773/1. All MD simulations were performed using NAMD compiled for use with CUDA-accelerated GPUs.
Results
The initial stage of the analysis was to cluster the water molecules from the MD trajectories to identify the hydration sites. To assess the predictions, we compared the positions of the hydration sites to the experimental positions of the oxygen atoms of water molecules from the crystal structure. The experimental sites should represent regions of high water density. We counted the number of predictions where the hydration sites were within 1.2 Å of the crystal structure oxygen atom position. Density was assigned to 38 water molecules in the crystal structure of apo MAYM within 12 Å of the site centroid. Each MD methodology produced a different number of hydration sites. This data can be found in Table 1. The fixed protein simulation predicts the largest number of hydration sites (78) and identifies the largest number of water molecules from the crystal structure.21 The sites are predicted with an rmsd of 0.62 Å from the crystal structure positions. However, the restrained simulation also performs well, identifying 65 hydration site and 20 water molecules from the crystal structure with an rmsd of 0.64 Å. The correctly predicted hydration sites (blue) and crystal structure water molecules (red) for the restrained simulation are shown in Figure 2. Some water molecules and some hydration sites lie under the surface and thus do not appear in the figure. The water molecules labeled A, B, and C are in close proximity to neighboring crystal units in the X-ray structure (3.60, 5.27, and 4.74 Å to the closest heavy atoms, respectively), and their positions may thus be affected. The free simulation compares less favorably with the crystal structure, identifying 18 water molecules from the crystal structure with an rmsd of 0.76 Å and 52 hydration sites in total. It is important to note that the two metrics of the number of crystal structure water molecules identified and the rmsd of the water molecules are reliant on assigning X-ray density to specific points, which is an artifact of crystallography.
Table 1. Effect of the MD Protocol on the Predictionsa.
| MD Scheme | free | restrained | fixed |
|---|---|---|---|
| total sites predicted | 52 | 65 | 78 |
| crystal waters matched (within 1.2 Å) | 18 | 20 | 21 |
| percentage of predictions correct (%) | 34.62 | 30.77 | 26.92 |
| percentage crystal waters matched (%) | 47.37 | 52.63 | 55.26 |
| rmsd of matches (Å) | 0.76 | 0.64 | 0.62 |
The effect of the MD protocol on the hydration site clustering and the accuracy with respect to the crystal structure water molecules. The percentage of predictions correct is the percentage of predictions made that are correct. The percentage crystal waters matched is the percentage of the crystal water molecules that were correctly identified.
Figure 2.
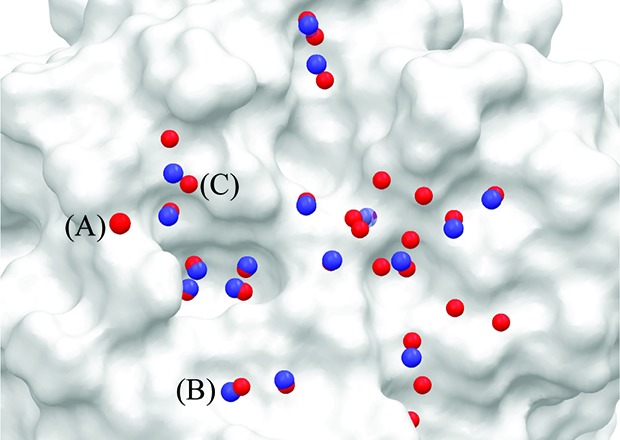
The molecular surface of the MAYM mutant showing the positions of water molecules in the crystal structure and the predicted hydration sites from the restrained protein simulation. The oxygen atoms of the crystal structure water molecules are colored red and the correctly predicted hydration sites are colored blue.
In addition to comparing the positions of the hydration sites with the crystal structure, we calculated the effect of the three schemes on the calculated occupancy and thermodynamic properties of the hydration sites. The results of this analysis can be seen in Table 2, which details the calculated properties of five hydration sites. In general, despite small differences in the number of predicted sites and their position and occupancy, the fixed and restrained schemes agree reasonably well on the majority of the hydration sites. However, the free scheme yields quite different results, with markedly lower occupancies for all the hydration sites. There is also a key disparity that it is interesting to note. When restraints on the protein are removed, the hydrophobic phenylalanine pocket is filled by two methionine residues for a significant portion of the simulation. These two methionine residues form one side of the phenylalanine pocket. This reduces the apparent occupancy of the four water molecules within the pocket to an average of 0.19 in the free simulation. This low occupancy means that they are not identified as hydration sites under the clustering protocol. These four sites have appreciable occupancies of 0.94 and 0.90 on average from the fixed and restrained simulations. This prediction is not completely unexpected, as the opening and closing of hydrophobic pockets on protein surfaces has been observed.36 Furthermore, these two methionines have relatively high average B-factors of 15.99 Å2 and 11.93 Å2, suggesting high mobility. Because of the limitations of MD and of crystallography, it is difficult to assess whether the phenylalanine pocket spends an appreciable time in a closed conformation. However, as this clearly affects the MD simulations and the subsequent IFST analysis, it is a very important consideration. If the protein structure is treated as fully flexible, the energy function must be accurate or the predictions of IFST will be misleading. Previous implementations of this methodology have treated the protein as fixed18 or as restrained.21 We predict that this can have a significant effect on the location and occupancies of hydration sites. It also has a significant effect on the calculated thermodynamic properties, as can be seen in Table 2 and Table 3. Table 2 details the interaction energy, entropy, and free energy for the three different MD protocols for ten hydration sites. For many of the hydration sites, the three schemes agree both qualitatively and quantitatively. However, some hydration sites are predicted to have different thermodynamic properties in the three schemes. This is true for sites A and F in Table 2, where the predictions for the free energies vary by 1.80 and 2.23 kcal/mol, respectively. Such a difference impacts the conclusions of the modeling and would affect any quantitative treatment of the results. Table 2 shows that the hydrophobic sites C, D, and G have a free energy with respect to bulk of +4.62, +4.19, and +6.33 kcal/mol. This agrees very well with previous applications of IFST to hydrophobic sites, where the maximum free energy with respect to bulk was approximately 5 kcal/mol.20,21 Table 3 provides more specific details on the thermodynamic properties for the hydration site lying within the alanine pocket. The protein–water entropy decreases from the free scheme to the restrained scheme and then to the fixed scheme. This trend occurs throughout the results. Fixing or restraining the protein also restrains the surrounding water molecules, and this has a direct effect on the entropies.
Table 2. Effect of the MD Protocol on Specific Hydration Sitesa.
| occupancy |
ΔE (kcal mol-1) |
–TΔS (kcal mol-1) |
ΔF (kcal mol-1) |
|||||||||
|---|---|---|---|---|---|---|---|---|---|---|---|---|
| site | free | rest | fix | free | rest | fix | free | rest | fix | free | rest | fix |
| A | 0.79 | 0.93 | 0.98 | –0.05 | 0.94 | 1.49 | 0.92 | –0.16 | 1.09 | 0.87 | 0.78 | 2.58 |
| B | NA | 0.73 | 0.85 | NA | –1.37 | –0.99 | NA | 0.50 | 0.77 | NA | –0.87 | –0.22 |
| C | NA | 0.95 | 0.99 | NA | 3.65 | 3.57 | NA | 0.98 | 0.41 | NA | 4.62 | 3.98 |
| D | NA | 0.98 | 0.97 | NA | 3.51 | 5.2 | NA | 0.68 | 2.10 | NA | 4.19 | 7.30 |
| E | NA | 0.94 | 0.94 | NA | 2.41 | 1.01 | NA | 1.09 | 2.27 | NA | 3.50 | 3.28 |
| F | 0.66 | 0.90 | 0.96 | –1.05 | 0.06 | –0.01 | –1.00 | –0.16 | 0.19 | –2.05 | –0.10 | 0.18 |
| G | 0.53 | 0.91 | 0.98 | 5.40 | 6.27 | 7.69 | –1.65 | 0.07 | 0.33 | 3.75 | 6.33 | 8.02 |
| H | 0.68 | 0.77 | 0.85 | –0.52 | –0.14 | –0.73 | –0.80 | –0.50 | –0.81 | –1.32 | –0.65 | –1.54 |
| I | 0.68 | 0.82 | 0.88 | 1.10 | 1.65 | 1.22 | 0.12 | 0.99 | 0.91 | 1.22 | 2.64 | 2.13 |
| J | 0.70 | 0.85 | 0.95 | –0.12 | 0.27 | –0.17 | –0.99 | 1.52 | 1.79 | –1.11 | 1.79 | 1.62 |
The effect of the MD protocol on ten hydration sites on the surface of MAYM for the free, restrained (rest), and fixed (fix) schemes. E is the interaction energy, and F is the free energy.
Table 3. Calculated Thermodynamic Properties for the Hydration Site Lying within the Alanine Pocketa.
| MD scheme | free (kcal mol-1) | restrained (kcal mol-1) | fixed (kcal mol-1) |
|---|---|---|---|
| occupancy | 0.77 | 0.82 | 0.88 |
| E (pw) | –13.41 | –13.98 | –13.79 |
| E (ww) | –9.11 | –7.99 | –8.61 |
| E (total) | –22.52 | –21.97 | –22.40 |
| ΔE | +1.10 | +1.65 | +1.22 |
| TS (density) | 0.68 | 0.72 | 0.76 |
| TS (pw, trans) | 0.12 | 0.16 | 0.26 |
| TS (pw, orient) | 1.83 | 2.03 | 2.28 |
| TS (pw) | 1.94 | 2.19 | 2.54 |
| TS (ww, trans) | 0.01 | 0.01 | 0.01 |
| TS (ww, orient) | 0.84 | 1.42 | 0.95 |
| TS (ww) | 0.85 | 1.43 | 0.96 |
| TS (total) | 3.47 | 4.34 | 4.26 |
| –TΔS | +0.12 | +0.99 | +0.91 |
| ΔF | +1.22 | +2.64 | +2.13 |
Details on the thermodynamic properties for the hydration site lying within the alanine pocket, calculated using the restrained MD scheme. The protein–water terms are denoted pw, and the water–water terms are denoted ww. The translational contributions are denoted trans, and the orientational contributions are denoted orient. E is the interaction energy, and F is the free energy.
The ten hydration sites shown in Table 2 are illustrated in Figure 3. For the hydration site labeled A, the three schemes agree closely with one another in position and also agree with the crystal structure position. However, the fixed scheme has a markedly different thermodynamic profile from the other schemes. This is due to the increased order in the fixed scheme at this hydration site, with the resulting decreased entropy leading to a less favorable free energy with respect to bulk. Hydration sites B, C, D, and E lie in the phenylalanine pocket and form a conserved square network with few hydrogen bonds per water. This is most marked for hydration sites C and D at the base of the pocket, which have very reduced interaction energies with respect to bulk. However, these hydration sites do not have a high overall entropy with respect to bulk water because of the reduction in water–water correlations in the pocket. Hydration site G lies on the surface of the protein in the same location as the DMSO solvent molecule in the crystal structure. The highly unfavorable free energy for this hydration site may explain why a DMSO molecule is found there in the apo state. Hydration site H also lies on the protein surface above a backbone amide group but is mostly exposed to solvent. It has a more favorable interaction energy than in bulk due to hydrogen bonding, and the reduced water–water correlations at the surface also lead to a favorable entropy with respect to bulk. Displacement of a water molecule from this hydration site by a ligand is predicted to contribute unfavorably to the binding free energy. Formation of a strong hydrogen bond between the ligand and the backbone amide group at this site could lead to a net favorable contribution to the binding free energy whereas a hydrophobic group would lead to a net unfavorable contribution. Hydration site I lies in the alanine pocket, and water molecules within this site have a strong degree of orientational ordering due to the formation of hydrogen bonds with two backbone carbonyls. Hydration site J is on a flat hydrophobic surface and makes weak interactions with the protein. However, its overall interaction energy is only 0.27 kcal/mol higher than in bulk water due to favorable interactions with other water molecules. However, these interactions lead to a strong degree of order and unfavorable protein–water entropy (+1.79 kcal/mol) and water–water entropy (+1.77 kcal/mol) terms. The property of increased ordering around hydrophobic solutes to yield favorable interactions has been likened to the formation clathrate cages and has been used previously to explain the hydrophobic effect.37 The surface of RadA along with the predicted hydration sites from the restricted simulation can be seen in Figure 4. The sites are colored by hydrophobicity from hydrophobic in blue to hydrophilic in red. Such a view has been used previously to study protein binding sites and to explain binding affinity and selectivity.22,23 Here it can be used to identify binding hotspot regions and provide a quantitative comparison. The phenylalanine and alanine pockets are clearly visible with blue hydrophobic sites on the left- and right-hand sides, respectively.
Figure 3.
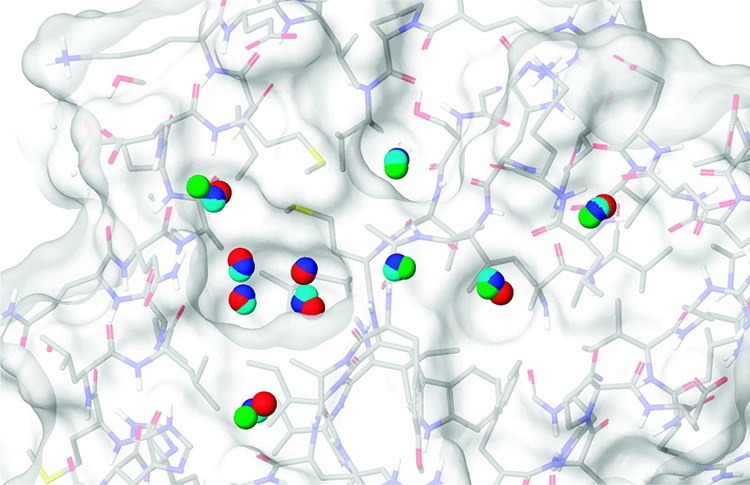
The molecular surface of the MAYM mutant showing the positions of ten water molecules in the crystal structure and the predicted hydration sites from the three simulation schemes. The oxygen atoms of the crystal structure water molecules are colored red, the hydration sites from the free simulation are colored green, the hydration sites from the restrained simulation are colored dark blue, and the hydration sites from the fixed simulation are colored cyan.
Figure 4.
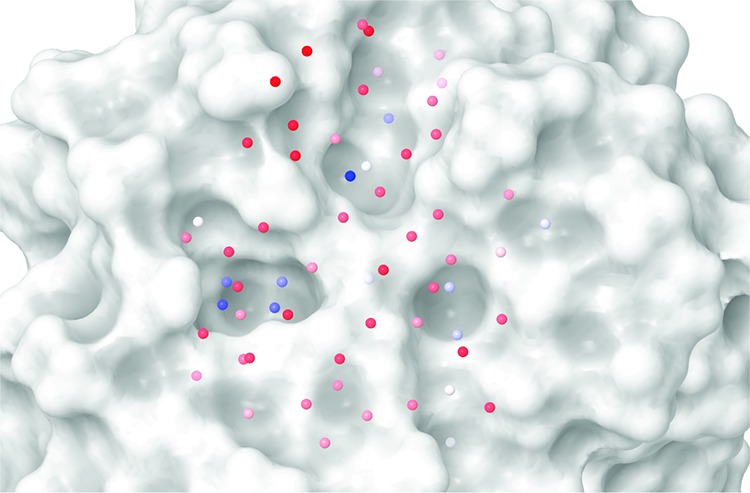
The molecular surface of the MAYM mutant showing the predicted hydration sites from the restricted simulation. The hydration sites are colored by free energy with respect to bulk water from more positive in blue to more negative in red.
As well as studying the effect of the three simulation schemes, we have also considered the effect of other computational parameters in the IFST methodology. In this study we only considered water–water entropies for pairs of hydration sites up to 3.5 Å apart, because of the high computational cost of considering a large number of pairs. We thus looked at the correlation in the water–water pair distance and the water–water pair entropy. A graph of the water–water pair distance against the water–water pair entropy for the restrained scheme can be seen in Figure 5. Because of the dependence on the radial distribution function in bulk, the significant pair entropies are found when the distance between the hydration sites is similar to the maximum in the radial distribution function (2.7 Å). No significant pair entropies are found for hydration sites separated by more than 3.2 Å using this methodology. The majority of the pair entropies result from the orientational term, with the largest translational term being only 0.006 kcal/mol. With sufficient data, it would be very instructive to repeat this calculation without the approximations to the correlation functions.
Figure 5.
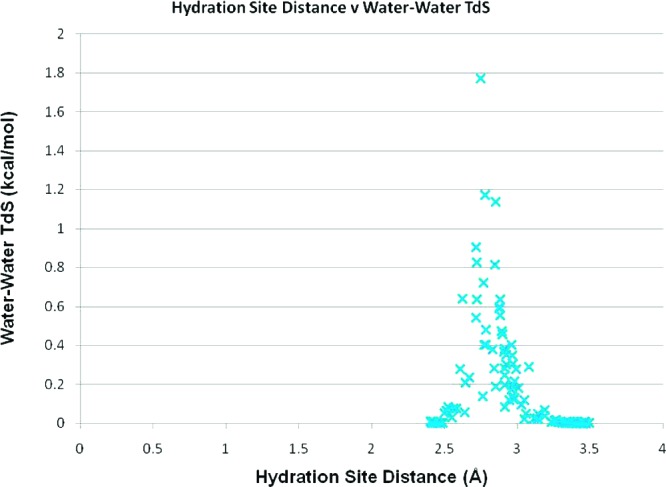
A plot of the distance between two hydration sites against the calculated water–water entropic contribution to the free energy of that site (TΔS), predicted by the restrained simulation.
As a final test, we also calculated the change in solvent-accessible surface area (ΔSASA) of a carbon atom placed at the centroid of each hydration site. The ΔSASA upon binding is commonly employed as an estimate of the contribution of the hydrophobic effect to binding, so we were interested in how it correlates with the thermodynamic properties of the hydration sites. Figure 6 shows the plot of ΔSASA against the entropic contribution to the free energy (−TΔS) for all 65 hydration sites in the restrained simulation. The coefficient of determination between ΔSASA and −TΔS is 0.52, suggesting a reasonable correlation, with buried sites tending to have more negative entropies and thus more unfavorable contributions to the free energies. The coefficients of determination for ΔSASA with the interaction energy (0.06) and the total free energy (0.31) were not as high. The ΔSASA for a shape comprised of all 65 hydration spheres was 2167.46, and the sum of the entropic contributions to the free energies for the 65 sites was 62.14 kcal/mol. This corresponds to a value of 28.67 cal/mol/Å2, which is consistent with previous estimates used in MMPBSA (38) and MMGBSA(39) of between 5.0 and 50.0 cal/mol/Å2.
Figure 6.
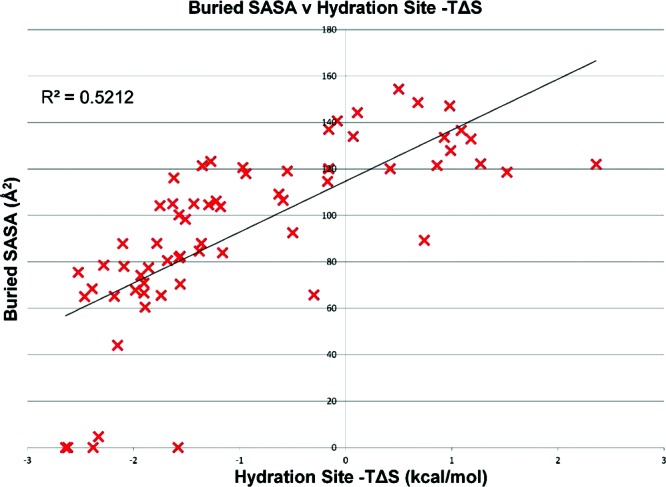
A plot of the change in SASA when a carbon atom is placed at each of the 56 hydration sites predicted by the restrained simulation against the calculated total −TΔS of that site with respect to bulk water.
In summary, the results of this study highlight the importance of the molecular dynamics scheme on the results of IFST and illustrate how the predictions from IFST can be used to understand the thermodynamics of hydration at a protein surface.
Discussion
This paper describes the application of IFST to a prototypical PPI surface. In particular, we studied the effect of freezing or restraining the protein structure during the simulation. This approximation has been applied previously, and we were interested in the effect. The free, fixed, and restrained schemes perform comparably in terms of correctly predicting the location of water molecules in the crystal structure. The fixed and restrained schemes identify the primary hotspot in the phenylalanine binding site as three hydration sites that are entropically unfavorable and strongly enthalpically unfavorable. However, these sites are not identified in the free simulation, as the protein shifts to close the pocket with two methionine residues. This may be due to inaccuracies in the forcefield, but it may, however, represent a lowly populated state of the apo protein that is incorrectly scored and thus overly populated. It may also be due to incorrect pressure in the MD simulation. Creation of the spherical boundary region and simulation in an NVT ensemble are likely to affect the pressure and the density of the water, which could lead to cavitation. All three schemes predict a secondary hotspot in the alanine binding site and also locate a third hotspot, which is filled by a solvent DMSO molecule in the crystal structure.
In general, the locations of the hydration sites are very similar with the three schemes. However, the results predict that fixing the protein significantly restricts movement of water molecules at the surface, and this impacts the predicted density and thermodynamic properties of the hydration sites. In particular, the protein–water entropies decrease when the protein is frozen, and this leads to less favorable free energies with respect to bulk water. Incorporating at least some protein flexibility into the simulation seems to be very important, and this is consistent with recent implementations of IFST.20,21 However, the effect of the degree and nature of the restraints have not been fully explored, and this remains as an important task for future work. In particular, quantifying hydration thermodynamics in highly flexible protein regions is a significant challenge but a very important one. The findings of our study also suggest that water–water pair entropies need only be calculated for pairs that are less than 3.5 Å apart for this implementation of IFST, as contributions from more distant pairs were found to be negligible. However, due to the dependence on the radial distribution function in bulk, this may not be true in a more complete treatment of water–water pair correlations and should be investigated in further work. It is also interesting that the degree of burial of a hydration site correlates to some degree with the entropy but not with the interaction energy. This suggests that the surface area term of MMGBSA and MMPBSA approaches to calculating binding free energy captures some aspects of solvent entropy changes.
IFST is one of the most important methods to quantify solvent thermodynamics, and it has numerous important potential applications. As shown here, it is ideally suited to scanning a protein surface to locate binding hotspots, and it can also be used to predict PPI surfaces on proteins of unknown function. When combined with a scoring function to compute protein–ligand interactions, it can also be applied to molecular docking and the computation of protein–ligand binding affinities.21,35 This also allows it to be applied to molecular design algorithms for increasing binding affinities. However, in common with other methodologies that utilize MD, this method is highly sensitive to implementation details. This work details one aspect of the implementation that is very important and suggests a number of others. The utility of the method depends on using accurate forcefields, water models, restraints, and simulation parameters. However, the potential of IFST to greatly improve prediction of protein–ligand binding affinities makes the development of this method a very important goal of computational modeling.
Acknowledgments
The authors thank Marko Hyvonen, Tom Blundell, Bracken King, Nate Silver, Duncan Scott, Chris Abell, Ashok Venkitaraman, and John Skidmore for helpful discussions. We also thank Stuart Rankin for technical help and the Cambridge HPCS for use of the CUDA-accelerated GPUs. We are grateful for financial support from the MRC, Wellcome Trust, and EPSRC. We also acknowledge financial support from the Wellcome Trust Translation Award GR080083 (2006-2010), as the structural work from this paper builds upon work from that project.
This article was published ASAP on October 5, 2011. Changes have been made to Figure 6 and its caption, and to the penultimate paragraph of the Results section. The correct version was published on November 8, 2011.
References
- Shoemaker B. A.; Panchenko A. R. Deciphering protein-protein interactions. Part I. Experimental techniques and databases. PLoS Comput. Biol. 2007, 33337–344. [DOI] [PMC free article] [PubMed] [Google Scholar]
- Massova I.; Kollman P. A. Computational alanine scanning to probe protein–protein interactions: A novel approach to evaluate binding free energies. J. Am. Chem. Soc. 1999, 121368133–8143. [Google Scholar]
- Shoemaker B. A.; Panchenko A. R. Deciphering protein-protein interactions. Part II. Computational methods to predict protein and domain interaction partners. PLoS Comput. Biol. 2007, 34595–601. [DOI] [PMC free article] [PubMed] [Google Scholar]
- Wells J. A.; McClendon C. L. Reaching for high-hanging fruit in drug discovery at protein-protein interfaces. Nature 2007, 45071721001–1009. [DOI] [PubMed] [Google Scholar]
- Tsai C. J.; Lin S. L.; Wolfson H. J.; Nussinov R. Studies of protein-protein interfaces: A statistical analysis of the hydrophobic effect. Protein Sci. 1997, 6153–64. [DOI] [PMC free article] [PubMed] [Google Scholar]
- West S. C. Molecular views of recombination proteins and their control. Nat. Rev. Mol. Cell Biol. 2003, 46435–445. [DOI] [PubMed] [Google Scholar]
- Davies A. A.; Masson J. Y.; Mcllwraith M. J.; Stasiak A. Z.; Stasiak A.; Venkitaraman A. R.; West S. C. Role of BRCA2 in control of the RAD51 recombination and DNA repair protein. Mol. Cell 2001, 72273–282. [DOI] [PubMed] [Google Scholar]
- Yang S. X.; Yu X.; Seitz E. M.; Kowalczykowski S. C.; Egelman E. H. Archaeal RadA protein binds DNA as both helical filaments and octameric rings. J. Mol. Biol. 2001, 31451077–1085. [DOI] [PubMed] [Google Scholar]
- Shin D. S.; Pellegrini L.; Daniels D. S.; Yelent B.; Craig L.; Bates D.; Yu D. S.; Shivji M. K.; Hitomi C.; Arvai A. S.; Volkmann N.; Tsuruta H.; Blundell T. L.; Venkitaraman A. R.; Tainer J. A. Full-length archaeal Rad51 structure and mutants: mechanisms for RAD51 assembly and control by BRCA2. EMBO J. 2003, 22174566–4576. [DOI] [PMC free article] [PubMed] [Google Scholar]
- Conway A. B.; Lynch T. W.; Zhang Y.; Fortin G. S.; Fung C. W.; Symington L. S.; Rice P. A. Crystal structure of a Rad51 filament. Nat. Struct. Mol. Biol. 2004, 118791–796. [DOI] [PubMed] [Google Scholar]
- Rajendra E.; Venkitaraman A. R. Two modules in the BRC repeats of BRCA2 mediate structural and functional interactions with the RAD51 recombinase. Nucleic Acids Res. 2010, 38182–96. [DOI] [PMC free article] [PubMed] [Google Scholar]
- Pellegrini L.; Yu D. S.; Lo T.; Anand S.; Lee M.; Blundell T. L.; Venkitaraman A. R. Insights into DNA recombination from the structure of a RAD51-BRCA2 complex. Nature 2002, 4206913287–93. [DOI] [PubMed] [Google Scholar]
- Lazaridis T.; Paulaitis M. E. Entropy of Hydrophobic Hydration - a New Statistical Mechanical Formulation. Fluid Phase Equilib. 1993, 83, 43–49. [Google Scholar]
- Lazaridis T.; Karplus M. Orientational correlations and entropy in liquid water. J. Chem. Phys. 1996, 105104294–4316. [Google Scholar]
- Lazaridis T. Solvent reorganization energy and entropy in hydrophobic hydration. J. Phys. Chem. B 2000, 104204964–4979. [Google Scholar]
- Li Z.; Lazaridis T. Thermodynamic contributions of the ordered water molecule in HIV-1 protease. J. Am. Chem. Soc. 2003, 125226636–6637. [DOI] [PubMed] [Google Scholar]
- Lazaridis T. Inhomogeneous fluid approach to solvation thermodynamics. 1. Theory. J. Phys. Chem. B 1998, 102183531–3541. [Google Scholar]
- Li Z.; Lazaridis T. Thermodynamics of buried water clusters at a protein–ligand binding interface. J. Phys. Chem. B 2006, 11031464–1475. [DOI] [PubMed] [Google Scholar]
- Li Z.; Lazaridis T. The effect of water displacement on binding thermodynamics: concanavalin A. J. Phys. Chem. B 2005, 1091662–70. [DOI] [PubMed] [Google Scholar]
- Young T.; Abel R.; Kim B.; Berne B. J.; Friesner R. A. Motifs for molecular recognition exploiting hydrophobic enclosure in protein–ligand binding. Proc. Natl. Acad. Sci. U.S.A. 2007, 1043808–13. [DOI] [PMC free article] [PubMed] [Google Scholar]
- Abel R.; Young T.; Farid R.; Berne B. J.; Friesner R. A. Role of the active-site solvent in the thermodynamics of factor Xa ligand binding. J. Am. Chem. Soc. 2008, 13092817–31. [DOI] [PMC free article] [PubMed] [Google Scholar]
- Beuming T.; Farid R.; Sherman W. High-energy water sites determine peptide binding affinity and specificity of PDZ domains. Protein Sci. 2009, 1881609–19. [DOI] [PMC free article] [PubMed] [Google Scholar]
- Huggins D. J.; McKenzie G.; Robinson D.; Narváez A.; Hardwick B.; Roberts-Thomson M.; Venkitaraman A.; Grant G.; Payne M., Computational Analysis of Phosphopeptide Binding to the Polo-Box Domain of the Mitotic Kinase PLK1 Using Molecular Dynamics Simulation. PLoS Comput. Biol. 2010, 6 (8). [DOI] [PMC free article] [PubMed] [Google Scholar]
- Czapiewski D.; Zielkiewicz J. Structural properties of hydration shell around various conformations of simple polypeptides. J. Phys. Chem. B 2010, 114134536–50. [DOI] [PubMed] [Google Scholar]
- Phillips J. C.; Braun R.; Wang W.; Gumbart J.; Tajkhorshid E.; Villa E.; Chipot C.; Skeel R. D.; Kale L.; Schulten K. Scalable molecular dynamics with NAMD. J. Comput. Chem. 2005, 26161781–1802. [DOI] [PMC free article] [PubMed] [Google Scholar]
- Chen L. T.; Ko T. P.; Chang Y. C.; Lin K. A.; Chang C. S.; Wang A. H. J.; Wang T. F. Crystal structure of the left-handed archaeal RadA helical filament: identification of a functional motif for controlling quaternary structures and enzymatic functions of RecA family proteins. Nucleic Acids Res. 2007, 3561787. [DOI] [PMC free article] [PubMed] [Google Scholar]
- Humphrey W.; Dalke A.; Schulten K. VMD: Visual molecular dynamics. J. Mol. Graph. 1996, 14133–&. [DOI] [PubMed] [Google Scholar]
- MacKerell A. D.; Bashford D.; Bellott M.; Dunbrack R. L.; Evanseck J. D.; Field M. J.; Fischer S.; Gao J.; Guo H.; Ha S.; Joseph-McCarthy D.; Kuchnir L.; Kuczera K.; Lau F. T. K.; Mattos C.; Michnick S.; Ngo T.; Nguyen D. T.; Prodhom B.; Reiher W. E.; Roux B.; Schlenkrich M.; Smith J. C.; Stote R.; Straub J.; Watanabe M.; Wiorkiewicz-Kuczera J.; Yin D.; Karplus M. All-atom empirical potential for molecular modeling and dynamics studies of proteins. J. Phys. Chem. B 1998, 102183586–3616. [DOI] [PubMed] [Google Scholar]
- Mackerell A. D.; Feig M.; Brooks C. L. Extending the treatment of backbone energetics in protein force fields: Limitations of gas-phase quantum mechanics in reproducing protein conformational distributions in molecular dynamics simulations. J. Comput. Chem. 2004, 25111400–1415. [DOI] [PubMed] [Google Scholar]
- Abascal J. L. F.; Vega C., A general purpose model for the condensed phases of water: TIP4P/2005. J. Chem. Phys. 2005, 123 (23), -. [DOI] [PubMed] [Google Scholar]
- Grubmüller H.Solvate: A Program to Create Atomic Solvent Models, 1996.
- Brooks B. R.; Bruccoleri R. E.; Olafson B. D.; States D. J.; Swaminathan S.; Karplus M. Charmm - a Program for Macromolecular Energy, Minimization, and Dynamics Calculations. J. Comput. Chem. 1983, 42187–217. [Google Scholar]
- Darden T.; York D.; Pedersen L. Particle Mesh Ewald - an N.Log(N) Method for Ewald Sums in Large Systems. J. Chem. Phys. 1993, 981210089–10092. [Google Scholar]
- Brooks C. L. III; Brunger A.; Karplus M. Active site dynamics in protein molecules: a stochastic boundary molecular-dynamics approach. Biopolymers 1985, 245843–65. [DOI] [PubMed] [Google Scholar]
- Abel R.; Wang L.; Friesner R. A.; Berne B. J. A Displaced-Solvent Functional Analysis of Model Hydrophobic Enclosures. J. Chem. Theory Comput. 2010, 692924–2934. [DOI] [PMC free article] [PubMed] [Google Scholar]
- Eyrisch S.; Helms V. Transient pockets on protein surfaces involved in protein–protein interaction. J. Med. Chem. 2007, 50153457–3464. [DOI] [PubMed] [Google Scholar]
- Head-Gordon T. Is Water-Structure around Hydrophobic Groups Clathrate-Like. Proc. Natl. Acad. Sci. U.S.A. 1995, 92188308–8312. [DOI] [PMC free article] [PubMed] [Google Scholar]
- Huggins D. J.; Altman M. D.; Tidor B. Evaluation of an inverse molecular design algorithm in a model binding site. Proteins 2009, 751168–186. [DOI] [PMC free article] [PubMed] [Google Scholar]
- Fogolari F.; Brigo A.; Molinari H. Protocol for MM/PBSA molecular dynamics simulations of proteins. Biophys. J. 2003, 851159–66. [DOI] [PMC free article] [PubMed] [Google Scholar]