Abstract
Breast cancer (BC) ranks second in the cancer fatality rate among females worldwide. Mammogram, ultrasound, magnetic resonance imaging (MRI), blood testing, and fine needle aspiration biopsy are usually applied to discriminate BC patients from normal persons. False-negative results, undetectable calcifications, movement-incurred blurry image, infection, and sampling error are commonly associated with these traditional means of diagnosis. Traditional Chinese medicine (TCM) covers a broad range of medical practices sharing common theoretical concepts. Tongue diagnosis plays an important role in TCM. Organ conditions, properties, and variation of pathogens can be revealed through observation of tongue. In light of this observation, this paper investigates discriminating tongue features to distinguish between BC patients and normal people, and establishes differentiating index to facilitate the non-invasive detection of BC. The tongue features for 60 BC patients and 70 normal persons were extracted by the Automatic Tongue Diagnosis System (ATDS). The Mann-Whitney test showed that the amount of tongue fur (P = 0.007), tongue fur in the spleen-stomach area, maximum covering area of tongue fur, thin tongue fur, the number of tooth marks, the number of red dots, red dot in the spleen-stomach area, red dot in the liver-gall-left area, red dot in the liver-gall-right area, and red dot in the heart-lung area demonstrated significant differences (P < 0.05). The tongue features of the testing group were employed to test the power of significant tongue features identified in predicting BC. An accuracy of 80% was reached by applying the seven significant tongue features obtained through Mann–Whitney test. To the best of our knowledge, this is the first attempt in applying TCM tongue diagnosis to the discrimination of BC patients and normal persons.
Keywords: Automatic tongue diagnosis system, Breast cancer, Logistic regression, Mann–Whitney test
INTRODUCTION
Breast cancer (BC) occurs when breast cells develop abnormally and grow out of control, forming a malignant tumor that can spread to other parts of the body.[1] BC that started off in the lobules is known as lobular carcinoma, while the one that developed from the ducts is called ductal carcinoma.[2] Mammogram, ultrasound, magnetic resonance imaging (MRI), blood testing, and fine needle aspiration biopsy are usually applied to discriminate BC patients (BCPs) from normal persons (NPs).[3,4] However, other than being invasive or radioactive, some disadvantages are associated with these traditional BC diagnoses, for example, false-negative results of mammogram, undetectability of breast calcifications with ultrasound, unclear image caused by movement during MRI scanning, infection of blood testing, and cancer missing in fine needle aspiration biopsy if the needle is not placed among the cancer cells. Due to the above pitfalls, the early diagnosis of BC may be difficult.
Nicolao et al., (2010) reported that the traditional Chinese medicine (TCM) practices, such as acupuncture and phytotherapy, are considered as the most popular disciplines requested by both medical experts and students in Switzerland.[5] They have received wider acceptance from western medicine in recent years. The essence of TCM hinges on “correct differentiation of symptoms for proper means of treatment.” Correct diagnosis is a prerequisite for effective medical treatment. TCM diagnosis is generally based on four standard but not validated approaches, that is, observation, smelling/listening, inquiry, and palpation. Observation tops the four ways of TCM diagnosis and the tongue corresponds to the major subject of focus during observation.[6] Therefore, tongue diagnosis plays an important role in TCM.[7]
It is widely believed that the tongue is connected to the internal organs through meridians; thus, the conditions of organs, qi, blood, and body fluids, as well as the degree and progression of disease are all reflected on the tongue.[8,9] Organ conditions, properties, and variations of pathogens can be found through observation of tongue. For example, changes in the tongue property primarily reflect organ status and the flow of qi and blood; variations in tongue fur can be employed to determine the impact of exogenous pathogenic factors and the flow of stomach qi. In clinical practice of TCM, practitioners observe the characteristics of tongue, such as the color, shape, and the amount of saliva, before deducing the primary ailment of a patient. However, observation diagnosis is often biased by subjective judgment, originating from personal knowledge, experience, thinking patterns, diagnostic skills, and color perception or interpretation. There are no precise or quantifiable standards existing. Different practitioners may pass varying judgments on the same tongue, while a practitioner may even reach inconsistent diagnoses on the identical tongue if examined at different time.
Previous studies that have been conducted on the issue regarding consistency of TCM diagnosis[10,11,12,13,14,15,16,17,18,19,20] as well as herbal prescription or treatment[14,15,17] indicated that inter- and intra-observer agreements are low. The inconsistency of subjective diagnosis and treatment can be improved by the development of validated instruments such as standard questionnaire for inquiries[6] and manual for guiding treatments.[21] Recently, experiments on intra- and inter-observer agreements of the automatic tongue diagnosis system (ATDS) and TCM practitioners have been conducted in our laboratory.[20] The results demonstrate that the ATDS is very consistent even in the face of variations of environmental lighting and extruding tongue, with an intra-observer agreement being significantly higher than that of the TCM doctors, while the inter-observer agreements between the ATDS and a group of TCM doctors and among the TCM doctors are both moderate.[20,22,23,24] ATDS serves not only as clinical equipment in providing doctors with consistent tongue features of patients but also as feasible teaching and evaluation means for students learning tongue diagnosis.
This paper investigates discriminating tongue features to distinguish between BCPs and normal people, and establishes differentiating index to facilitate the non-invasive detection of BC. Nine tongue features, namely tongue color, tongue quality, tongue fissure, tongue fur, red dot, ecchymosis, tooth mark, saliva, and tongue shape, were extracted for BCPs and NPs by the ATDS.[22,23,24] Features identified were further subdivided according to the areas located (i.e., spleen-stomach, liver-gall-left, liver-gall-right, kidney, and heart-lung area) as shown in Figure 1. The Mann–Whitney test was performed based on the data collected to induce significant tongue features (P < 0.05) to discriminate BCPs from NPs.[25,26] Ten tongue features with significant differences, identified by the Mann-Whitney test, were further employed as factors in the logistic regression to derive features with independently significant meaning. Three logistic regression models were constructed to predict the probability of getting BC. An accuracy of 80%, 80%, and 67% was achieved, respectively. To the best of our knowledge, this is the first attempt in applying TCM tongue diagnosis to the discrimination of BCPs from NPs.
Figure 1.
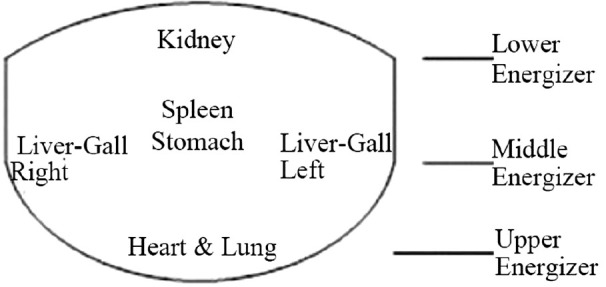
The tongue is subdivided into areas corresponding to different internal organs
MATERIALS AND METHODS
Participants
Two groups of the tongue images, that is, experimental and control groups, were collected through the outpatients of Department of Traditional Chinese Medicine of Changhua Christian Hospital (CCH) in Taiwan (IRB no. 120512). The tongue features for 60 BCPs in the experimental group and 70 NPs in the control group were extracted by the ATDS, respectively. The inclusion and exclusion criteria for the subjects of the experimental group are as follows:
-
Inclusion criteria
- Diagnosed as BCP (ICD-9-CM 174-174.9) by a specialist
- Both males and females were included
- Patients who had signed IRB agreement.
-
Exclusion criteria
- Patients who had not signed IRB agreement
- Pregnant women
- Patients with acute infection
- Cognitive impaired, for example, imbecility dementia or delirium, caused by cancer metastasis to brain
- Patients unable to protrude the tongue stably.
Figure 2 shows the exemplary tongue images of the BCPs and NPs recruited.
Figure 2.

Tongue images of breast cancer patients and normal persons
Automatic tongue diagnosis system
As shown in Figure 3a, the ATDS was developed to capture the tongue images and extract features reliably to assist the diagnosis of TCM practitioners.[20] Figure 3b demonstrates the steps in three major functions, that is, image capturing and color calibration, tongue areas’ segmentation, and tongue feature extraction, included in the ATDS.[20,23]
Figure 3a.
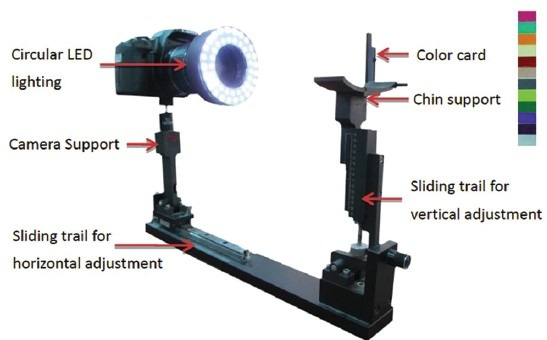
Components of the ATDS
Figure 3b.
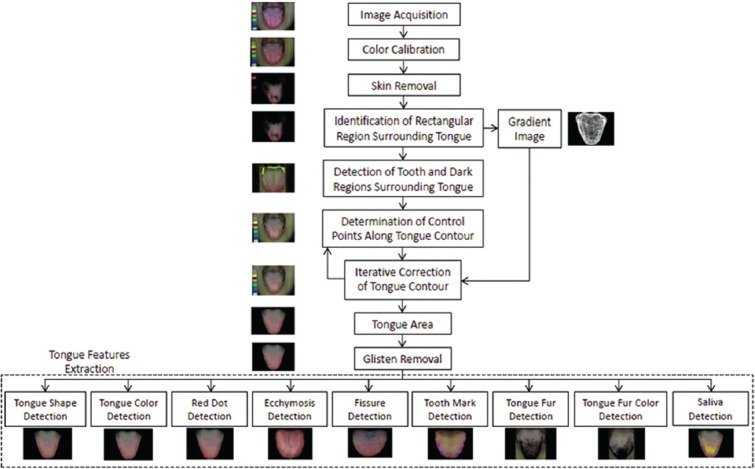
The processing steps of ATDS analysis
Variations in background lighting may change the color and brightness of the acquired images, greatly affecting the consistency and stability of the extracted tongue features. The consistency and stability of the tongue images captured and the features extracted were achieved by calibrating brightness and color to compensate the variations in intensity and color temperature of the light source and the imaging hardware. The ATDS developed can automatically correct lighting and color deviation caused by the change of background lighting with a color bar placed beside the subject. Color calibration utilizes the information provided by the color bar to make sure the image quality is consistent even when taken in different circumstances. Figure 4a and b displays the images taken at T1 before and after color calibration, respectively, whereas Figure 4c demonstrates the image taken at T2 after calibration. The second and third rows show the color bars clipped from the tongue images and their corresponding histograms. ATDS automatically compensates the color deviation of the original image [Figure 4a, with a mean gray level 59.5] to allow colors in images taken at different time intervals consistent with each other [Figure 4b and c, with mean gray levels 66.1 and 67.3, respectively].
Figure 4.
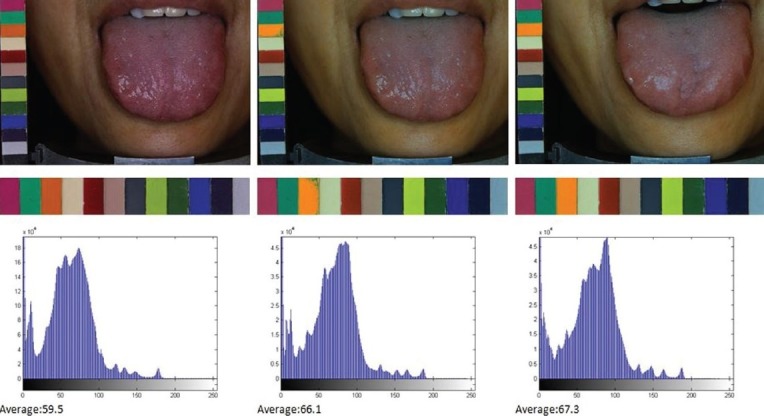
Calibration of image color using the color bar accompanying the subject to make the image quality consistent for images taken in different circumstances; a) T1 before color calibration, and the corresponding color bar histogram; b) T1 after color calibration, and the corresponding color bar histogram; c) T2 after calibration, and the corresponding color bar histogram
Tongue images were analyzed by first isolating the tongue region within an image to eliminate irrelevant lower facial portions and background surrounding the tongue, thereby facilitating feature identification and extraction, and then extracting the tongue features by employing criteria such as the aspect ratio, color composition, location, shape, and color distribution of the tongue, as well as the values of neighboring pixels. Nine primary features including tongue color, fur color, fur thickness, saliva, tongue shape, tongue fissure, red dot, ecchymosis, and tooth marks were extracted to generate detailed information regarding length, area, moisture, and the number of fissures, tooth marks, and red dots to be employed in tongue diagnosis, as depicted in [Figure 5].[18] Features identified were further subdivided according to the areas located (i.e., spleen-stomach, liver-gall-left, liver-gall-right, kidney, and heart-lung area), as shown in Figure 1.
A complete listing of the tongue features extracted is summarized below:
Tongue color: Includes slightly white, slightly red, red, dark red, and dark purple
Tongue shape: Includes shape (thin and small, moderate, fat and large) and tongue body (normal, tilted to the left, tilted to the right)
Saliva: Includes total area and the amount of saliva (none, little, normal, excessive)
Tongue fur: Includes fur color (white, yellow, dye), amount, average covering area, maximum covering area, minimum covering area, degree of thickness (none, thin, thick), and organs corresponding to the covering area (spleen-stomach, liver-gall-left, liver-gall-right, kidney, heart-lung areas)
Tongue quality: Organs corresponding to the covering area (spleen-stomach, liver-gall-left, liver-gall-right, kidney, heart-lung areas)
Tongue fissure: Includes amount, average covering area, shortest length, longest length
Ecchymosis: Amount, average coving area, maximum covering area, minimum covering area, and organs corresponding to the covering area (spleen-stomach, liver-gall-left, liver-gall-right, kidney, heart-lung areas)
Tooth mark: Includes number, average covering area, maximum covering area, minimum covering area, and organs corresponding to the covering area (spleen-stomach, liver-gall-left, liver-gall-right, kidney, heart-lung areas)
-
Red dot: Includes number, average covering area, maximum covering area, minimum covering area, and organs corresponding to the covering area (spleen-stomach, liver-gall-left, liver-gall-right, kidney, heart-lung areas).
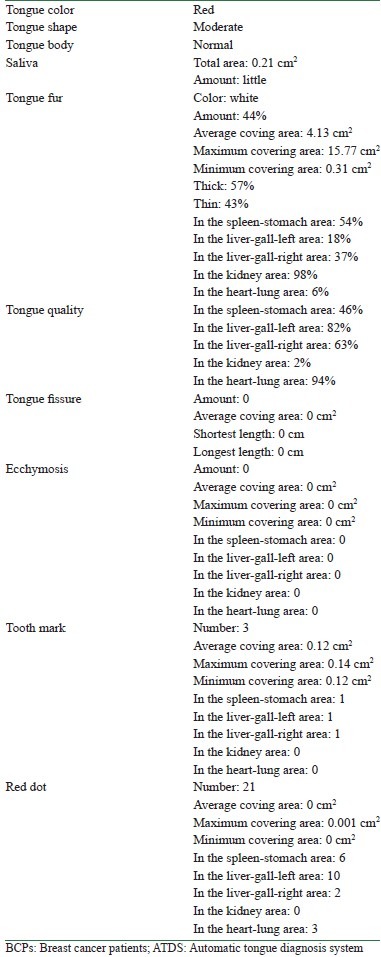
The tongue features of BCP 1 are given in Table 1.
Table 1.
Tongue features of BCP 1 in Figure 2, extracted by ATDS
Statistical analysis
The tongue features of the subjects participating in the study were extracted by ATDS. The Mann-Whitney test was performed on the data sets acquired in the experimental and control groups to identify the features with significant difference (P < 0.05). The Mann–Whitney test is a non-parametric test used to compare two independent groups of sampled data and without the condition of normal distributions. The test statistic for the Mann–Whitney test is U. This value is compared to a table of critical values for U based on the sample size of each group.
Besides, in classifying two distinct groups, logistic regression can be used to predict the outcome of a categorical dependent variable based on one or more predictor variables.[27] It is used with data in which there is a binary (success-failure) outcome. Let P be the predicted probability of success using covariate x, i.e.,

where f(x)=β0+ β1x1+ β2x2+...+ βkxkand βi,i∈Z,i≥0 are the corresponding coefficients. The statistical analysis of this study is twofold: First, to conduct Mann–Whitney test, with respect to the tongue features, for the BC group and the normal group to select significant variables for the following logistic regression and second, to conduct logistic regression based on the selection of the variables in the former Mann–Whitney test to obtain a predicting equation for the probability of with/without BC.
EXPERIMENTAL RESULTS
The tongue features for 60 BCPs and 70 NPs were extracted by the ATDS.[22,23,24] The purpose focuses on inducing significant tongue features (P < 0.05) to discriminate BCPs from NPs. The results obtained by applying Mann-Whitney test are listed in Table 2, with 10 features, namely, the amount of tongue fur (P = 0.007), tongue fur in the spleen-stomach area (P = 0.020), maximum covering area of tongue fur (P = 0.002), thin tongue fur (P = 0.000), the number of tooth marks (P = 0.050), the number of red dots (P = 0.000), red dot in the spleen-stomach area (P = 0.000), red dot in the liver-gall-left area (P = 0.002), red dot in the liver-gall-right area (P = 0.000), red dot in the heart-lung area (P = 0.003), demonstrating significant differences.
Table 2.
Significant tongue features identified by applying Mann-Whitney test to the data sets acquired from the group of normal persons and the group of breast cancer patients

Next, the data collected were classified into two groups. The training group consisted of 55 BCPs and 60 NPs, while the testing group was composed of 5 BCPs and 10 NPs. The logistic regression by utilizing these 10 tongue features with significant differences in Mann–Whitney test as factors was performed. Table 3 lists the results obtained.
Table 3.
The results of applying the logistic regression by utilizing 10 tongue features with significant differences identified in Mann-Whitney test as factors

Model I
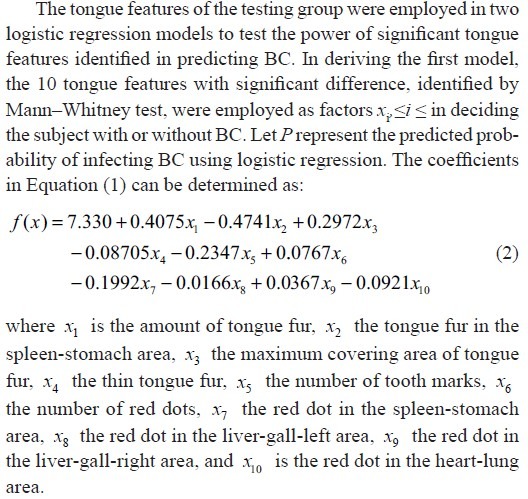
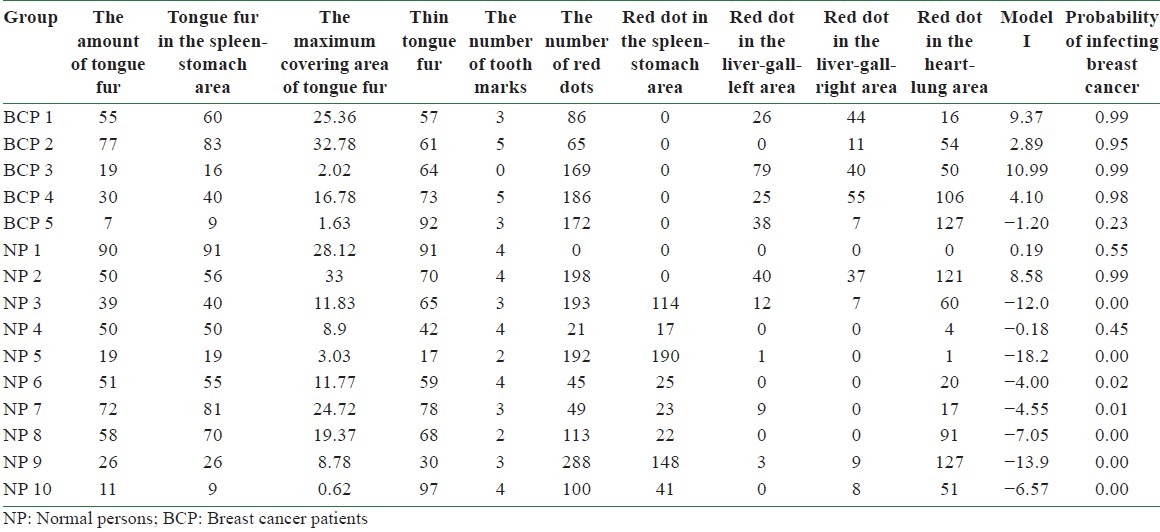
The accuracy of Model I in predicting BC can be tested by substituting the values of tongue features extracted from the testing group into Equation (2). According to Equation (1), the probability of infecting BC P is determined once the value of f(x) is given. A predicted probability larger than 0.5 corresponds to tongue features of a BCP, while that smaller than 0.5 represents those of an NP. Table 4 lists the probability of infecting BC for 5 BCPs and 10 NPs in the testing group according to Model I. Among them, the probability of infecting BC is larger than 0.5 for BCPs 1, 2, 3, and 4 and smaller than 0.5 for NPs 3, 4, 5, 6, 7, 8, 9, and 10. Correct diagnoses are reached for these 12 cases out of a total of 15 ones. An accuracy of 80% is reached by employing Model I in predicting BC through tongue diagnosis.
Table 4.
The probability of infecting breast cancer by employing Model I to the tongue features of 5 breast cancer patients and 10 normal persons in the testing group
Model II
Table 3 lists the results by employing logistic regression to analyze the relationship between dependent and independent variables, under the hypothesis of infecting BC or not. We removed one of the 10 tongue features which did not show the most significant difference (P > 0.05) and performed logistic regression three times. Tables 5–7 lists the final results obtained. Among them, the amount of tongue fur (P = 0.011), the tongue fur in the spleen-stomach area (P = 0.006), the maximum covering area of tongue fur (P = 0.003), thin tongue fur (P = 0.019), the number of red dots (P = 0.017), red dot in the spleen-stomach area (P = 0.002), and red dot in the heart-lung area (P = 0.016) exhibit significant differences (P = 0.05). Let P represent the probability of infecting BC. Considering the significant variables in the above logistic regression, we consider the following model:
Table 5.
The first results of removing the most insignificant differences of 10 tongue features in Table 3 and applying the logistic regression

Table 7.
The third results of removing the most insignificant differences of eight tongue features in Table 6 and applying the logistic regression

Table 6.
The second results of removing the most insignificant differences of nine tongue features in Table 5 and applying the logistic regression

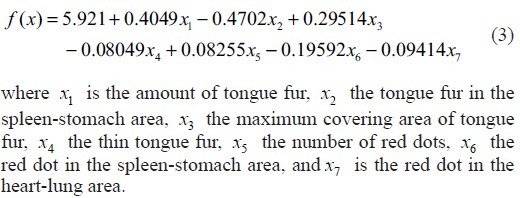
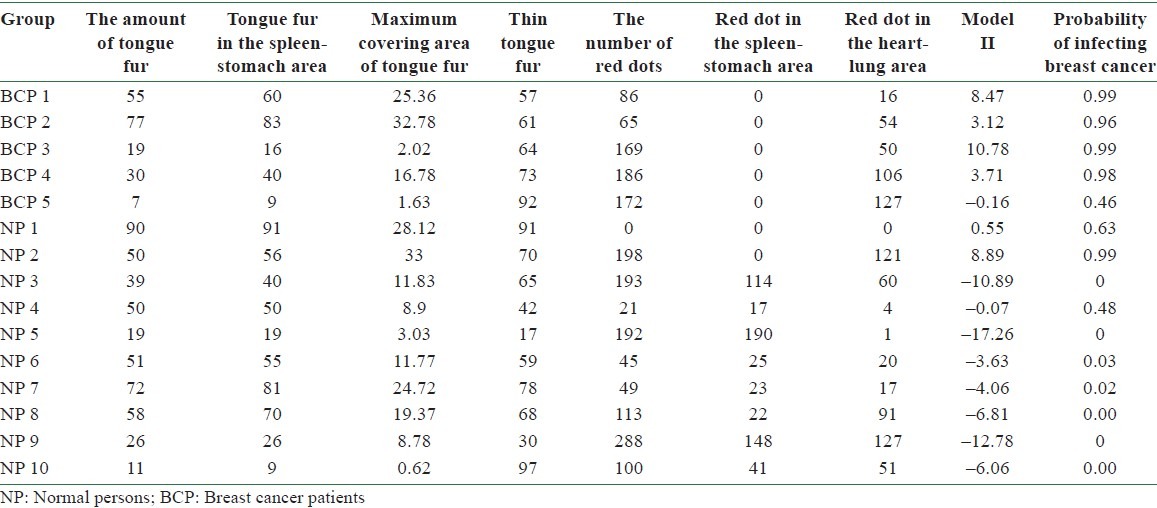
The accuracy of using Model II in predicting BC can be tested by substituting the values of tongue features extracted from the testing group into Equation (3). According to Equation (1), the probability of infecting BC P is determined once the value of f(x) is given. A predicted probability larger than 0.5 corresponds to tongue features of a BCP, while that smaller than 0.5 represents those of an NP. Table 8 lists the probability of infecting BC for 5 BCPs and 10 NPs in the testing group according to Model II. Among them, the probability of infecting BC is larger than 0.5 for BCPs 1, 2, 3, and 4 and smaller than 0.5 for NPs 3, 4, 5, 6, 7, 8, 9, and 10. Correct diagnoses are reached for these 12 cases out of a total of 15 ones. An accuracy of 80% is reached by employing Model II in predicting BC through tongue diagnosis.
Table 8.
The probability of infecting breast cancer by employing Model II to the tongue features of 5 breast cancer patients and 10 normal persons in the testing group
Model III
Table 7 lists the results by employing logistic regression to analyze the relationship between dependent and independent variables, under the hypothesis of infecting BC or not. We removed the least significant differences, thin tongue fur (P = 0.019), of seven tongue features and performed logistic regression. Table 9 lists the final results obtained. Among them, the amount of tongue fur (P = 0.037), tongue fur in the spleen-stomach area (P = 0.005), the maximum covering area of tongue fur (P = 0.001), the number of red dots (P = 0.008), red dot in the spleen-stomach area (P = 0.002), and red dot in the heart-lung area (P = 0.005) exhibit significant difference (P = 0.05). Let P represent the probability of infecting BC. Considering the significant variables in the above logistic regression, we consider the following model:
Table 9.
The results of removing the least significant differences of seven tongue features in Table 7 and applying the logistic regression


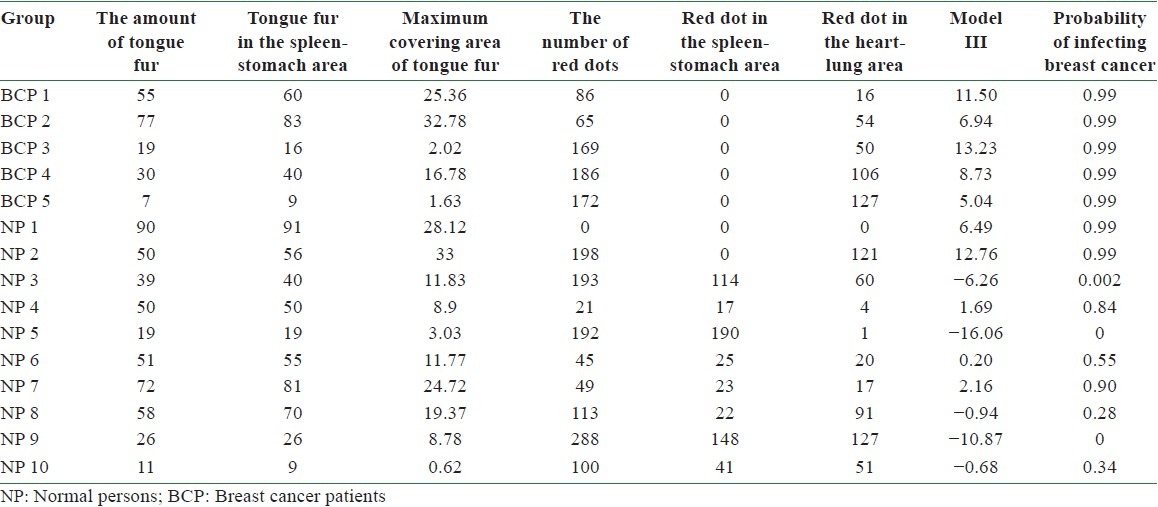
The accuracy of using Model III in predicting BC can be tested by substituting the values of tongue features extracted from the testing group into Equation (4). According to Equation (1), the probability of infecting BC P is determined once the value of f(x) is given. A predicted probability larger than 0.5 corresponds to the tongue features of a BCP, while that smaller than 0.5 represents those of an NP. Table 10 lists the probability of infecting BC for 5 BCPs and 10 NPs in the testing group according to Model II. Among them, the probability of infecting BC is larger than 0.5 for BCPs 1, 2, 3, 4, and 5 and smaller than 0.5 for NPs 3, 5, 8, 9, and 10. Correct diagnoses are reached for these 10 cases out of a total of 15 ones. An accuracy of 67% is reached by employing Model III in predicting BC through tongue diagnosis.
Table 10.
The probability of infecting breast cancer by employing Model III to the tongue features of 5 breast cancer patients and 10 normal persons in the testing group
CONCLUSIONS
This study investigates discriminating tongue features to distinguish between BCPs and normal people, and establishes differentiating index to facilitate the non-invasive detection of BC. The Mann–Whitney test showed that the amount of tongue fur (P = 0.007), tongue fur in the spleen-stomach area (P = 0.020), maximum covering area of tongue fur (P = 0.002), thin tongue fur (P = 0.000), the number of tooth marks (P = 0.050), the number of red dots (P = 0.000), red dot in the spleen-stomach area (P = 0.000), red dot in the liver-gall-left area (P = 0.002), red dot in the liver-gall-right area (P = 0.000), and red dot in the heart-lung area (P = 0.003) demonstrated significant differences. Next, logistic regression by utilizing these 10 tongue features with significant differences in Mann–Whitney test as factors was performed. We removed one of the 10 tongue features which did not show the most significant differences (P > 0.05) and performed logistic regression three times. Among them, the amount of tongue fur (P = 0.011), tongue fur in the spleen-stomach area (P = 0.006), the maximum covering area of tongue fur (P = 0.003), thin tongue fur (P = 0.019), the number of red dots (P = 0.017), red dot in the spleen-stomach area (P = 0.002), and red dot in the heart-lung area (P = 0.016) revealed independently significant meaning. The tongue features of the testing group were employed in two logistic regression models to test the predicting accuracy of significant tongue features identified in predicting BC. An accuracy of 80% was reached through the first logistic regression model by applying the 10 significant tongue features obtained through Mann-Whitney test. For the second model employing seven tongue features obtained by logistic regression with independently significant meaning, 80% accuracy was achieved. The TCM tongue diagnosis can serve as a preliminary screening procedure in early detection of BC in light of its simple and non-invasive nature, followed by other more accurate testing process. To the best of our knowledge, this is the first attempt in applying non-invasive TCM tongue diagnosis to the discrimination of BCPs and NPs.
ACKNOWLEDGMENTS
We are grateful to Y. E. Kao for his assistance of compiling the BC data.
REFERENCES
- 1.McCartney M. How useful are lifetime risks of disease? BMJ. 2011;342:d1046. doi: 10.1136/bmj.d1046. [DOI] [PubMed] [Google Scholar]
- 2.Wasif N, Maggard MA, Ko CY, Giuliano AE. Invasive lobular vs.ductal breast cancer: A stage-matched comparison of outcomes. Ann Surg Oncol. 2010;17:1862–9. doi: 10.1245/s10434-010-0953-z. [DOI] [PubMed] [Google Scholar]
- 3.Armstrong K, Handorf EA, Chen J, Bristol Demeter MN. “Breast cancer risk prediction and mammography biopsy decisions: A model-based study. Am J Prev Med. 2013;44:15–22. doi: 10.1016/j.amepre.2012.10.002. [DOI] [PMC free article] [PubMed] [Google Scholar]
- 4.Meade E, Dowling M. Early breast cancer: Diagnosis, treatment and survivorship. Br J Nurs. 2012;21:S4–7. doi: 10.12968/bjon.2012.21.Sup17.S4. [DOI] [PubMed] [Google Scholar]
- 5.Nicolao M, Täuberand MG, Heusser P. How should complementary and alternative medicine be taught to medical students in Switzerland? A survey of medical experts and students. Med Teach. 2010;32:50–5. doi: 10.3109/01421590902825123. [DOI] [PubMed] [Google Scholar]
- 6.Zhang GG, Lee W, Bausell B, Lao L, Handwerger B, Berman B. Variability in the Traditional Chinese Medicine (TCM) diagnoses and herbal prescriptions provided by three TCM practitioners for 40 patients with rheumatoid arthritis. J Altern Complement Med. 2005;11:415–21. doi: 10.1089/acm.2005.11.415. [DOI] [PubMed] [Google Scholar]
- 7.Kaptchuk T. Chinese Medicine: The web that has no weaver. 2nd ed. London: Rider; 2000. [Google Scholar]
- 8.Wiseman N, Ellis A. Zhong Yi XueJi Chu. Brookline, MA: Paradigm Publications; 1996. Fundamentals of Chinese Medicine. [Google Scholar]
- 9.Kirschbaum B. Atlas of Chinese Tongue Diagnosis. Seattle: Eastland Press; 2000. [Google Scholar]
- 10.O’Brien KA, Abbas E, Zhang J, Guo ZX, Luo R, Bensoussan A, et al. An investigation into the reliability of Chinese medicine diagnosis according to Eight Guiding Principles and Zang-Fu Theory in Australians with hypercholesterolemia. J Altern Complement Med. 2009;15:259–66. doi: 10.1089/acm.2008.0204. [DOI] [PubMed] [Google Scholar]
- 11.O’Brien KA, Abbas E, Movsessian P, Hook M, Komesaroff PA, Birch S. Investigating the reliability of Japanese Toyohari Meridian therapy diagnosis. J Altern Complement Med. 2009;15:1099–105. doi: 10.1089/acm.2009.0020. [DOI] [PubMed] [Google Scholar]
- 12.Mist S, Ritenbaugh C, Aickin M. Effects of questionnaire-based diagnosis and training on inter-rater reliability among practitioners of traditional Chinese medicine. J Altern Complement Med. 2009;15:703–9. doi: 10.1089/acm.2008.0488. [DOI] [PMC free article] [PubMed] [Google Scholar]
- 13.O’Brien KA, Birch S. A review of the reliability of Traditional East Asian Medicine diagnoses. J Altern Complement Med. 2009;15:353–66. doi: 10.1089/acm.2008.0455. [DOI] [PubMed] [Google Scholar]
- 14.Coeytaux RR, Chen W, Lindemuth CE, Tan Y, Reilly AC. Variability in the diagnosis and point selection for persons with frequent headache by traditional Chinese acupuncture. J Altern Complement Med. 2006;12:863–72. doi: 10.1089/acm.2006.12.863. [DOI] [PubMed] [Google Scholar]
- 15.Sung JJ, Leung WK, Ching JY, Lao L, Zhang G, Wu JC, et al. Agreements among traditional Chinese medicine practitioners in the diagnosis and treatment of irritable bowel syndrome. Aliment Pharmacol Ther. 2004;20:1205–10. doi: 10.1111/j.1365-2036.2004.02242.x. [DOI] [PubMed] [Google Scholar]
- 16.Zell B, Hirata J, Marcus A, Ettinger B, Pressman A, Ettinger KM. Diagnosis of symptomatic postmenopausal women by traditional Chinese medicine practitioners. Menopause. 2000;7:129–34. doi: 10.1097/00042192-200007020-00010. [DOI] [PubMed] [Google Scholar]
- 17.Zhang GG, Lee WL, Lao L, Bausell B, Berman B, Handwerger B. The variability of TCM pattern diagnosis and herbal prescription on rheumatoid arthritis patients. Altern Ther Health Med. 2004;10:58–63. [PubMed] [Google Scholar]
- 18.Zhang GG, Singh B, Lee W, Handwerger B, Lao L, Berman B. Improvement of agreement in TCM diagnosis among TCM practitioners for persons with the conventional diagnosis of Rheumatoid Arthritis: Effect of training. J Altern Complement Med. 2008;14:381–6. doi: 10.1089/acm.2007.0712. [DOI] [PubMed] [Google Scholar]
- 19.Kim M, Cobbin D, Zaslawski C. Traditional Chinese Medicine tongue inspection: An examination of inter- and intra-practitioner reliability for specific tongue characteristics. J Altern Complement Med. 2008;14:527–36. doi: 10.1089/acm.2007.0079. [DOI] [PubMed] [Google Scholar]
- 20.Lo LC, Chen YF, Chen WJ, Cheng TL, Chiang JY. The study on the agreement between automatic tongue diagnosis system and traditional Chinese medicine practitioners. Evid Based Complement Alternat Med. 2012;2012:505063. doi: 10.1155/2012/505063. [DOI] [PMC free article] [PubMed] [Google Scholar]
- 21.Schnyer RN, Allen JJ. Bridging the gap in complementary and alternative medicine research: Manualization as a means of promoting standardization and flexibility of treatment in clinical trials of acupuncture. J Altern Complement Med. 2002;8:623–34. doi: 10.1089/107555302320825147. [DOI] [PubMed] [Google Scholar]
- 22.Lo LC, Chen CY, Chiang JY, Cheng TL, Lin HJ, Chang HH. Tongue diagnosis of traditional chinese medicine for rheumatoid arthritis. Afr J Tradit Complement Alternat Med. doi: 10.4314/ajtcam.v10i5.24. (In press) [DOI] [PMC free article] [PubMed] [Google Scholar]
- 23.Hsu YC, Chen YC, Lo L, Chiang JY. “Automatic Tongue Feature Extraction”. Proc. Int’l Computer Symp. (ICS2010), Tainan, Taiwan. 2010 Dec 16-18;:936–41. [Google Scholar]
- 24.Lo LC, Mark Chun-cheng Hou, Chen YL, Chiang JY, Shyu JJ. “Automatic Tongue Diagnosis System”. Proc. 2nd Int’l Conf. on BioMedical Engineering and Informatics (BMEI’09), Tianjin, China. 2009 Ocober;:140–4. [Google Scholar]
- 25.Fay MP, Proschan MA. Wilcoxon-Mann-Whitney or t-test? On assumptions for hypothesis tests and multiple interpretations of decision rules. Stat Surv. 2010;4:1–39. doi: 10.1214/09-SS051. [DOI] [PMC free article] [PubMed] [Google Scholar]
- 26.Siegel R, Naishadham D, Jemal A. Cancer statistics, 2012. CA Cancer J Clin. 2012;62:10–29. doi: 10.3322/caac.20138. [DOI] [PubMed] [Google Scholar]
- 27.van der Heijden H. Decision support for selecting optimal logistic regression models. Expert Syst Appl. 2012;39:8573–83. [Google Scholar]


