

Abstract
Background and Purpose
Although the stoichiometry of the major synaptic αβγ subunit-containing GABAA receptors has consensus support for 2α:2β:1γ, a clear view of the stoichiometry of extrasynaptic receptors containing δ subunits has remained elusive. Here we examine the subunit stoichiometry of recombinant α4β3δ receptors using a reporter mutation and a functional electrophysiological approach.
Experimental Approach
Using site-directed mutagenesis, we inserted a highly characterized 9′ serine to leucine mutation into the second transmembrane (M2) region of α4, β3 and δ subunits that increases receptor sensitivity to GABA. Whole-cell, GABA-activated currents were recorded from HEK-293 cells co-expressing different combinations of wild-type (WT) and/or mutant α4(L297S), β3(L284S) and δ(L288S) subunits.
Key Results
Recombinant receptors containing one or more mutant subunits showed increased GABA sensitivity relative to WT receptors by approximately fourfold, independent of the subunit class (α, β or δ) carrying the mutation. GABA dose–response curves of cells co-expressing WT subunits with their respective L9′S mutants exhibited multiple components, with the number of discernible components enabling a subunit stoichiometry of 2α, 2β and 1δ to be deduced for α4β3δ receptors. Varying the cDNA transfection ratio by 10-fold had no significant effect on the number of incorporated δ subunits.
Conclusions and Implications
Subunit stoichiometry is an important determinant of GABAA receptor function and pharmacology, and δ subunit-containing receptors are important mediators of tonic inhibition in several brain regions. Here we demonstrate a preferred subunit stoichiometry for α4β3δ receptors of 2α, 2β and 1δ.
Keywords: GABAA receptor, stoichiometry, δ subunit, extrasynaptic
Introduction
GABAA receptors are the main class of inhibitory ligand-gated ion channels in the mammalian CNS (receptor nomenclature follows Alexander et al., 2013). They are hetero-pentameric complexes forming a central anion-conducting channel. To date, eight classes of GABAA receptor subunits have been identified, with half of these exhibiting multiple isoforms: α(1–6), β(1–3), γ(1–3), δ, ε, θ, π and ρ(1–3). Although GABAA receptors exhibit distinct regional and developmental expression patterns in the CNS, γ2-containing receptors are considered the dominant subtype found at GABAergic inhibitory synapses (Somogyi et al., 1996). By contrast, δ-containing receptors are thought to be exclusively found at extrasynaptic sites, where they play an important role in mediating tonic inhibition (Farrant and Nusser, 2005). Extrasynaptic α4βδ receptors have been identified in several neuronal cell types, including dentate gyrus granule cells and thalamic relay neurons (Sur et al., 1999; Peng et al., 2002). In addition, extrasynaptic α6δ and α1δ pairs have been identified in cerebellar granule cells (Jones et al., 1997) and hippocampal interneurons (Glykys et al., 2007), respectively, together with extrasynaptic α5βγ and α1β assemblies identified in the hippocampus (Mortensen and Smart, 2006; Glykys et al., 2008).
The subunit composition of GABAA receptors is an important determinant of their functional properties as demonstrated by the type of α subunit and presence of the γ2 subunit affecting, for example, receptor sensitivity to benzodiazepines (Korpi et al., 2002). Given that orthosteric and many allosteric binding sites on GABAA receptors are interfacial (Sieghart et al., 2012), it becomes important to understand whether there are preferred subunit stoichiometries that will critically define the nature of these subunit interfaces and thus the receptor's response to ligand binding. Compared with αβγ receptors, we know least about δ subunit-containing GABAA receptors, which play an important role mediating tonic inhibition in several brain regions (Brickley et al., 2001; Porcello et al., 2003; Farrant and Nusser, 2005; Santhakumar et al., 2010). To address this deficit, we have employed a pharmacological analysis, in combination with a reporter mutation, to better understand the structural properties of δ-containing receptors using heterologous expression systems (e.g. HEK-293 and Xenopus laevis oocytes). Previous reports note that some functional discrepancies have been observed for αβδ receptors, such as EC50 values for GABA and ethanol sensitivity (Wallner et al., 2003), which have been postulated to arise, in part, from differences in subunit stoichiometry (Borghese et al., 2006; Wagoner and Czajkowski, 2010). Although the stoichiometry of major synaptic αβγ GABAA receptor isoforms has broad consensus support for 2α:2β:1γ (Backus et al., 1993; Chang et al., 1996; Tretter et al., 1997), an unequivocal view of the stoichiometry for extrasynaptic δ-containing receptors remains elusive. Although atomic force microscopy of recombinant α4β3δ receptors has suggested a stoichiometry of 2α:2β:1δ (Barrera et al., 2008), biochemical analysis of recombinant α4β2δ receptors indicates that more than one δ can be incorporated into the receptor complex (Wagoner and Czajkowski, 2010). Moreover, it was recently demonstrated on the basis of using α1β3δ (Kaur et al., 2009) and α6β3δ concatemers (Baur et al., 2009) that more than one δ subunit can be incorporated into functional channels, although for the former subtype, a constrained conformation of 2α:2β:1δ most closely resembled the pharmacological profile of unconstrained recombinant α1β3δ receptors (Kaur et al., 2009).
In this study, we have examined the subunit stoichiometry of functional recombinant α4β3δ receptors, utilizing polar substitutions of a highly conserved leucine residue within the second transmembrane region (M2) of GABAA receptors. This residue exchange acts as a reporter mutation causing a profound increase in agonist potency consequently displacing the agonist dose–response curve (Chang et al., 1996; Chang and Weiss, 1999), as also observed for nicotinic ACh receptors (nAChRs) (Filatov and White, 1995; Labarca et al., 1995) and 5-HT3 receptors (Yakel et al., 1993). The extent of the curve shift is correlated with the number of polar substitutions per ion channel complex, and this has been used to deduce the subunit stoichiometry of recombinant α1β2γ2 GABAA receptors (Chang et al., 1996). By inserting this highly characterized 9′ serine to leucine (L9′S) mutation into α4, β3 and δ subunits, we derive a subunit stoichiometry of 2α:2β:1δ for functional α4β3δ GABAA receptors. Furthermore, our data indicate that for three different, but commonly used, cDNA transfection ratios, the number of incorporated δ subunits seemingly remains fixed at one.
Methods
Site-directed mutagenesis
Inverse PCR was used to introduce the M2 leucine-to-serine substitutions into murine α4 and β3, and rat δ subunits. The δ subunit was tagged at the N-terminus (between residues 13 and 14 of the mature protein) with a super ecliptic phluorin. The mutagenic oligonucleotides used to make α4(L297S), β3(L284S) and δ(L288S) were 5′-CACGATGACCACCCTAAGCATC-3′ (sense), 5′-CCACCATGACAACCATCAACACTC-3′ (sense) and 5′-CGACAATGACCACACTCATGGTTA-3′ (sense) respectively. Successful mutations were verified by full DNA sequencing.
Transient receptor expression in HEK-293 cells
HEK-293 cells were cultured in DMEM supplemented with 10% v/v fetal calf serum, 2 mM glutamine, 100 u·mL−1 penicillin G and 100 μg·mL−1 streptomycin, and were incubated at 37°C in humidified 95% air and 5% CO2. HEK cells were plated on poly-L-lysine-coated coverslips and transfected using a calcium phosphate protocol. Briefly, cDNA encoding wild-type (WT) and/or mutant α4, β3 and δ subunits, in transfection ratios of 1:1:1, 1:1:10 or 10:1:10, were mixed with 340 mM CaCl2, and an equal volume of HBSS (50 mM HEPES, 280 mM NaCl and 2.8 mM Na2HPO4, pH 7.2) to form a precipitate. The total amount of cDNA used for each transfection was 4 μg. The DNA–calcium phosphate suspension was applied to HEK cells, which were incubated overnight, and used for electrophysiology 16–24 h after transfection. For the co-expression experiments, WT subunits and their respective L9′S mutants were co-expressed in equal amounts, with an overall transfection ratio remaining at 10α:1β:10δ.
Electrophysiological recordings
Transfected HEK cells were placed in a recording chamber and viewed with a Nikon Diaphot microscope (Nikon, Kingston-upon-Thames, UK) and phase contrast optics. Cells were continuously perfused with Krebs solution containing (in mM) 140.0 NaCl, 4.7 KCl, 1.2 MgCl2, 2.52 CaCl2, 11.0 glucose and 5.0 HEPES, adjusted to pH 7.4 with 1 M NaOH. Patch pipettes were fire polished to 2–4 MΩ and filled with an intracellular solution containing (in mM) 120 KCl, 1 MgCl2, 11 EGTA, 10 HEPES, 1 CaCl2 and 2 ATP, adjusted to pH 7.2 with 1 M NaOH.
Whole-cell agonist-activated currents were recorded with an Axopatch 200B amplifier (Molecular Devices, Sunnyvale, CA, USA). Cells were voltage clamped between −20 and −60 mV, depending on peak current size. Whole-cell currents were filtered at 5 kHz (−36 dB), digitized at 50 kHz via a Digidata 1332A (Molecular Devices) and recorded to disk (Dell Pentium Dual Core Optiplex 960; Dell, Berks, UK). Series resistances were monitored throughout each experiment and deviations >20% resulted in the data being excluded from further analysis.
Data analysis
Currents (IGABA) activated by concentrations of GABA ([A]) were normalized to the maximal current caused by a saturating concentration of GABA (IMax,GABA). The normalized concentration–response curves were fitted with the following equation using a non-linear least-squares method:
where EC50 is the GABA concentration inducing a half-maximal current, n is the nH, i is the number of components where j = 1 – 3.
For WT α4β3 and α4β3δ receptors, the level of inhibition exhibited by 1 μM Zn2+ on GABA EC50 responses for each receptor subtype was also assessed.
The spontaneous channel activity exhibited by each mutant was calculated by expressing the outward current induced by the blocker picrotoxin (IPTX; 1 mM) as a percentage of the maximum current, defined as the sum of IMax,GABA and IPTX. No spontaneous activity (SA) was observed for WT α4β3δ receptors. The level of SA was quantified according to:
All data are expressed as mean ± SEM. Where appropriate, statistical analyses were performed using an unpaired Student's t-test or a one-way anova.
Materials
GABA (Sigma, Dorset, UK) and zinc chloride (BDH Biochemical, Poole, UK) solutions were prepared from 1 M stocks (in water), whereas 1 mM picrotoxin (Sigma) was dissolved in extracellular Krebs solution containing 0.05% v/v dimethyl sulfoxide (Sigma). Drugs were applied via a U-tube application system (Mortensen and Smart, 2007).
Results
Functional expression of WT and L9′S mutant α4, β3 and δ subunits
The highly conserved 9′ leucine residues in α4, β3 and δ subunits (Figure 1) were mutated to serines, producing α4(L297S), β3(L284S) and δ(L288S). These mutated subunits are referred to as αm, βm and δm, whereas their WT counterparts are designated as α, β and δ. WT αβδ, and mutant αβδm, αmβδ and αβmδ-expressing cells (Figure 2A), demonstrated a dose-dependent sensitivity to GABA (Figure 2A). Notably, GABA whole-cell currents of mutant subunit-expressing cells exhibited prolonged deactivation phases compared with those for WT αβδ receptors (Figure 2A).
Figure 1.

Primary sequence alignment of the second transmembrane region (M2) of α4, β3 and δ subunits. Prime notation (red) denotes the amino acids comprising the ion channel pore. The conserved hydrophobic 9′ leucine residues are indicated and boxed for α4, β3 and δ subunits, with their numbering in the mature subunit proteins.
Figure 2.
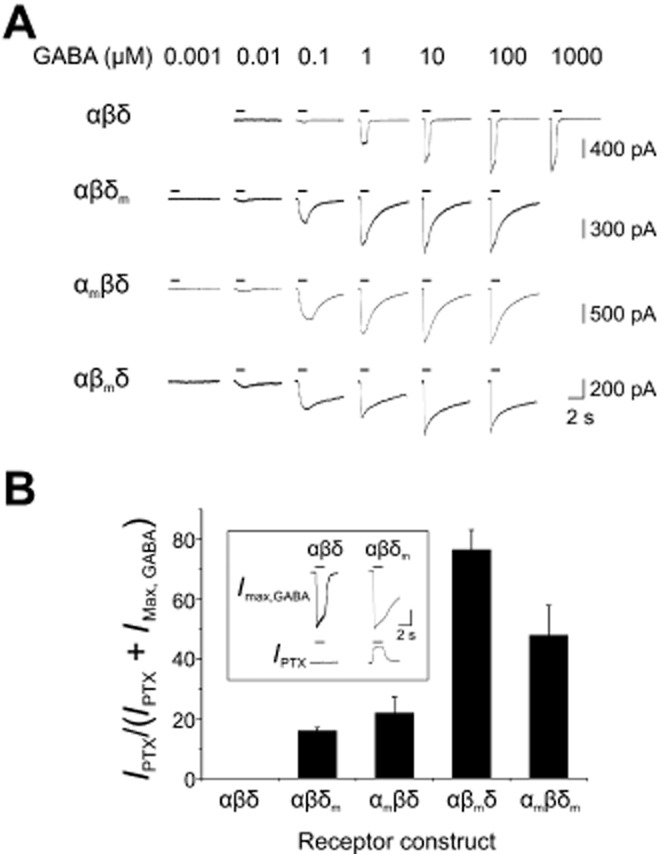
Functional expression of WT and L9′S mutant α4, β3 and δ subunits. In this and subsequent figures, WT α4, β3 and δ subunits are labelled as α, β and δ, whereas mutated α4(L297S), β3(L284S) and δ(L288S) subunits are designated as αm, βm and δm. (A) Examples of whole-cell currents elicited by increasing concentrations of GABA on HEK cells expressing recombinant αβδ, αβδm, αmβδ and αβmδ receptors. A transfection ratio of 10α:1β:10δ was used. Note the increased GABA sensitivity and prolonged deactivation kinetics exhibited by mutant-expressing cells. (B) Bar graph of SA for αβδ, αβδm, αmβδ, αβmδ and αmβδm receptors. Values were calculated by expressing the outward current induced by the Cl− channel blocker picrotoxin (IPTX; 1 mM) as a percentage of the maximum current, defined as the sum of IMax,GABA and IPTX (n = 4–11; mean ± SEM). No SA (= 0%) was observed for WT α4β3δ receptors. The inset shows example GABA-activated and picrotoxin-sensitive currents (IMax,GABA and IPTX) for αβδ and αβδm receptors. Current calibration bars: 300 pA (αβδ); 400 pA (αβδm).
With regard to channel gating αβδm, αmβδ and αβmδ, but not αβδ receptors, exhibited spontaneous activation in the absence of exogenously applied GABA, which was blocked by the chloride channel blocker, picrotoxin (1 mM; Figure 2B). Expressed as a proportion of the total GABA-activated plus spontaneous current [IPTX/(IPTX + IMax,GABA; Figure 2B inset)], the levels of spontaneous receptor activation for αmβδ and αβδm receptors were 21.9 ± 5.3 and 16 ± 1% respectively. The highest level of spontaneous activation was exhibited by αβmδ-expressing cells (76.6 ± 6.5%) relative to αβδm (P < 0.001) and αmβδ (P < 0.05) receptors (non-parametric anova – Kruskal–Wallis test). The increased degree of spontaneous receptor activation observed for the β mutant is likely to reflect the predominant role this subunit plays in stabilizing open-shut GABA channel conformation(s). It is also noteworthy that β homomers can form spontaneously opening ion channels (Krishek et al., 1996; Davies et al., 1997; Wooltorton et al., 1997; Cestari et al., 2000) unlike their α, γ or δ subunit counterparts.
Both the SA and distinctive deactivation profiles exhibited by mutant subunit-expressing cells confirmed that each mutant was efficiently co-assembled into functional αβδ receptors.
L9′S mutations in α4, β3 and δ subunits increase GABA sensitivity
By compiling GABA dose–response curves for cells expressing the subunit combinations, αβδ, αβδm, αmβδ, αβmδ and αmβδm, those containing δm, αm or βm subunits exhibited an increased GABA sensitivity compared with WT αβδ receptors, manifest by a leftward shift in the curves for mutant receptor-expressing cells (Figure 3A). Whereas WT αβδ receptors had a GABA EC50 of 1.91 ± 0.47 μM, single mutant subunit-containing receptors possessed lower EC50 values of 0.46 ± 0.11 μM (αβδm), 0.12 ± 0.03 μM (αmβδ) and 0.11 ± 0.04 μM (αβmδ; Table 1). Notably, the nH obtained for αβmδ receptors (0.63 ± 0.06; Table 1) was significantly lower than those obtained for αβδm (1.41 ± 0.12) and αmβδ (1.18 ± 0.19) receptors (Welch's t-test: P = 0.02 and P = 0.03 respectively). Although we cannot simply transpose the change in nH to any physical attribute, it is possible that the L9′S mutations altered the gating kinetics of the receptor, which may account for the changes in nH. Moreover, the effects on gating kinetics may be highly dependent on the subunit in which the mutation is inserted.
Figure 3.

L9′S mutations in α4, β3 and δ subunits increase GABA sensitivity. (A) GABA concentration–response curves for αβδ, αβδm, αmβδ, αβmδ and αmβδm receptors. Data represent the mean ± SEM from n = 5–9. Each data set was fitted to the Hill equation (continuous lines) using a non-linear least-squares method. Parameters from these fits are provided in Table 1. (B) Relationship between the number of mutant receptors incorporated into the receptor pentamer (assuming a stoichiometry of 2α:2β:1δ) and the average GABA EC50 values.
Table 1.
GABA concentration–response curve parameters for WT and L9′S mutant containing αβδ receptors
| Subunit combination | GABA EC50 (μM) | nH | No. of mutants* |
|---|---|---|---|
| αβδ | 1.91 ± 0.47 | 1.06 ± 0.04 | 0 |
| αβδm | 0.46 ± 0.11 | 1.41 ± 0.12 | 1 |
| αβmδ | 0.11 ± 0.04 | 0.63 ± 0.06 | 2 |
| αmβδ | 0.12 ± 0.03 | 1.18 ± 0.19 | 2 |
| αmβδm | 0.08 ± 0.02 | 0.95 ± 0.07 | 3 |
Number of mutants within the pentamer assuming a 2α:2β:1δ stoichiometry. GABA dose–response curves were obtained from five to nine HEK cells expressing αβδ, αβδm, αβmδ, αmβδ or αmβδm receptors. The Hill equation was fitted to each data set, and the mean values for GABA potency (EC50) and the Hill slope (nH) are shown in the table as mean ± SEM.
The αβδm receptors exhibited an approximately fourfold (4.15) increase in GABA sensitivity, relative to αβδ receptors. The increased sensitivity of αβδm was not attributable to a large population of αβ receptors being expressed as the EC50 for αβ receptors (1.01 ± 0.13 μM; data not shown) is similar to that for αβδ receptors (1.91 ± 0.47 μM; Welch's t-test: P = 0.13). By comparison, the GABA sensitivities of αmβδ and αβmδ receptors were higher compared with δm-containing receptors, causing shifts of 16 (15.91) and 17 (17.36)-fold, respectively, in the GABA EC50 (Figure 3).
If we assume each subunit mutation has an equivalent effect on GABA potency, independent of the subunit class in which the L9′S mutation is inserted, and if we further assume that the receptor contains two α subunits, then we would expect the shift in EC50 by the 9′ mutation to be approximately the square of the change due to a single α subunit. Thus a shift of 15.91 predicts a single α subunit would cause a 3.99-fold change in EC50. Similarly for the β subunit, a 17.36-fold shift indicates each β subunit (if two copies are present in the receptor) should cause a 4.17-fold change. These are equivalent to that caused by the δ subunit (4.15) and the findings therefore suggest that relative to the δ subunit, twice the number of α4 and β3 subunits are likely to exist in each receptor complex. Thus, because GABAA receptors are assumed to form pentameric complexes, αmβδ, αβmδ and αβδm probably contained 2αm, 2βm and 1δm subunits.
Increasing GABA sensitivity with the number of co-assembled L9′S mutant subunits
For heteromeric muscle nAChRs, each 9′ polar substitution within the ion channel confers an additional ∼10-fold increase in agonist sensitivity (Filatov and White, 1995; Labarca et al., 1995). However, such a linear relationship has not been observed for recombinant α1β2γ2S GABAA receptors (Chang and Weiss, 1999), where mutations in α, β and γ subunits contributed unequally to the increased GABA sensitivity, thus prohibiting an estimate of receptor stoichiometry (Chang and Weiss, 1999). By contrast, for our α, β and δ subunit receptors, the shifts appeared more consistent, with each mutation contributing an approximately fourfold increase in GABA sensitivity. We therefore investigated the relationship between GABA potency and the number of mutant substitutions in δ-containing GABAA receptors with αmβδm-expressing cells.
Based on our predictions, αmβδm receptors would be expected to contain three mutant subunits (i.e. two αs and one δ), and thus exhibit even greater sensitivity to GABA, than either αmβδ (double mutant) or αβδm (single mutant) receptors.
For αmβδm receptors an EC50 of 0.08 ± 0.02 μM (Table 1) was determined, which equates to a 23.87-fold increase in GABA sensitivity, which is greater than that for αmβδ and αβmδ receptors and approximates to a threefold shift (2.88) per mutant subunit. Based on the double mutant receptors, we predicted an approximately fourfold shift per subunit, and thus for three mutant subunits, we might have expected a 64-fold increase in GABA sensitivity. The discrepancy between the predicted and actual shift observed for αmβδm could arise from the δm subunit being absent from αmβδm receptor-expressing cells, leaving cell surface receptors mainly composed of αβ receptors containing just two mutant αm subunits. However, this seemed unlikely given that for αmβδm-expressing cells, there was clear evidence of cell surface δm–GFP fluorescence. Furthermore, αmβδm-expressing cells exhibited a level of SA (49.4 ± 8.4%) that was comparable with the combined spontaneous activities of αmβδ (21.9 ± 5.3%) and αβδm receptors (15.7 ± 1.3%; Figure 2B). Taken together, these data suggest that both αm and δm subunits were efficiently incorporated into functional αmβδm receptors. Our predicted shift of 64-fold for αmβδm receptors was predicated on the assumption that each additional mutant subunit within the receptor complex acts independently. Although this holds for receptors with two mutant subunits, it is conceivable that with three such substitutions, some degree of interaction between adjacent mutant subunits might cause deviations from the predicted curve shifts.
cDNA transfection ratio has no effect on α4β3δ receptor stoichiometry
Recently, using an imaging approach based on inserting bungarotoxin binding sites into GABAA receptor subunits that could be subsequently labelled by fluorescent bungarotoxin, it was demonstrated that the number of δ subunits incorporated into the α4β2δ receptor complex could vary with the cDNA transfection ratio (Wagoner and Czajkowski, 2010). We therefore investigated this possibility using our functional approach with HEK cells transfected with one of the following three commonly used α : β : δ cDNA ratios – 1:1:1, 1:1:10 or 10:1:10 (Borghese et al., 2006; Stórustovu and Ebert, 2006; Barrera et al., 2008; Hoestgaard-Jensen et al., 2010).
First, we ascertained the sensitivity of αβδ-expressing cells to the GABAA receptor subtype–selective blocker Zn2+ (Smart et al., 1991; Nagaya and Macdonald, 2001; Hosie et al., 2003) to assess if binary αβ constructs were present as 1 μM Zn2+ selectively inhibits αβ to a far greater extent than αβδ receptors (Krishek et al., 1998; Hosie et al., 2003; Stórustovu and Ebert, 2006). Accordingly, 1 μM Zn2+ inhibited the GABA EC50 response of αβ receptors by 75.5 ± 5.7% (Figure 4A). By contrast, the Zn2+ sensitivity of αβδ-expressing cells did not vary significantly with the αβδ transfection ratio (13.1 ± 3.4, 17.0 ± 3.9 and 17.6 ± 0.7%; one-way anova – Bonferroni: P = 0.5), but all were significantly reduced compared with Zn2+ inhibition of αβ receptors (Figure 4A; one-way anova – Dunnett's: P < 0.0001). These data also confirmed the likelihood of efficient incorporation of δ subunits into functional αβδ receptors, for all three transfection ratios used.
Figure 4.
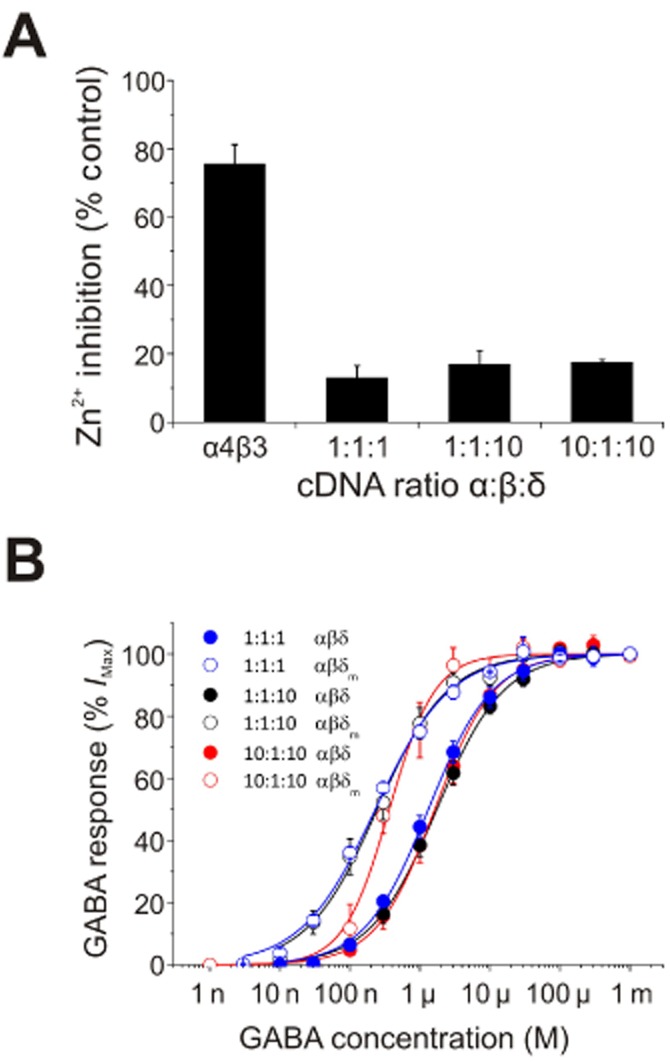
cDNA transfection ratio has no effect on α4β3δ receptor stoichiometry. (A) Inhibition by 1 μM Zn2+ of GABA EC50 currents for αβ or αβδ receptors expressed following transfection with one of three α:β:δ cDNA ratios: 1:1:1, 1:1:10 and 10:1:10 (n = 4–5; mean ± SEM). The total amount of cDNA used for each transfection was 4 μg. (B) GABA concentration–response curves for αβδ (filled circles) or αβδm (open circles) transfected with the α:β:δ cDNA ratios: 1:1:1, 1:1:10 and 10:1:10. The Hill equation was fitted to each data set using a non-linear least-squares method (continuous lines).
We next studied the effect of varying the transfection ratio on GABA sensitivities of αβδ and αβδm receptors. For WT αβδ receptors, altering the transfection ratio had no effect on GABA sensitivity (1.38 ± 0.20, 1.88 ± 0.32 and 1.91 ± 0.47 μM for αβδ ratios of 1:1:1, 1:1:10 and 10:1:10, respectively; one-way anova – Bonferroni: P = 0.56). Similarly, the GABA dose–response curves for αβδm-expressing cells transfected with different ratios were also indistinguishable (Figure 4B), and their GABA EC50 values (0.23 ± 0.01, 0.31 ± 0.08 and 0.46 ± 0.11 μM for αβδm ratios of 1:1:1, 1:1:10 and 10:1:10, respectively) did not differ significantly (one-way anova – Bonferroni: P = 0.20). Although there appears to be a trend for αβδm-expressing cells transfected with a 10:1:10 ratio to have higher nH (1.4 ± 0.2; Figure 4B) than those transfected with either a 1:1:1 (0.82 ± 0.03) or 1:1:10 (0.9 ± 0.2) transfection ratio, this was not significant (Welch's t-test: P = 0.09 and P = 0.17 respectively).
Overall, altering the transfection ratio had no significant effect on the relative GABA EC50 shifts between δ-and δm-expressing cells (Figure 4B), suggesting that at least for these three transfection ratios, the number of δ subunits incorporated into α4β3δ receptors remains relatively constant.
Co-expressing WT and mutant subunits confirms α4β3δ receptor stoichiometry
Our deductions so far are based on the assumption that each subunit mutation has an equivalent effect on GABA potency, regardless of the subunit in which the L9′S mutation is inserted. Although this holds for our α4β3δ receptors, some deviation may occur when the number of mutant subunits per receptor is increased, as noted for α1β2γ2S GABAA receptors (Chang et al., 1996) and heteromeric nAChRs (Labarca et al., 1995). To overcome this methodological limitation, Chang et al. (1996) proposed an alternative approach for deducing subunit stoichiometry that does not rely on the relative EC50 shifts induced by different classes of mutant subunits, but instead relied on co-expressing WT and L9′S mutants to generate multiple populations of receptors expressed in the same cells (Chang et al., 1996).
In principle, the co-expression of WT subunits with their respective L9′S mutants (e.g. α and αm) should introduce discrete and discernible components into the GABA dose–response curve of expressing cells. For example, assuming there are two α subunits per receptor pentamer, these components would represent distinct GABAA receptors of ααβδ, αmαmβδ and ααmβδ and its equivalent, αmαβδ. Thus, the GABA sensitivity that is attributable to an individual receptor population would be observed by an inflection in the dose–response curve. This analysis was used to infer the subunit stoichiometry for α1β2γ2S GABAA receptors (Chang et al., 1996).
Taking a similar approach for α4β3δ receptors, we generated GABA dose–response curves for cells co-transfected with β, δ and equal amounts of α and αm cDNAs. The ααmβδ GABA dose–response curve exhibited three discernible components, which were described by the sum of three Hill equations (Figure 5A). The first and third components accounted for 34.0 ± 3.3 and 17.5 ± 2.7% of the total receptor population, with GABA EC50 values of 0.023 ± 0.005 and 5.72 ± 0.90 μM respectively (Table 2). These EC50 values are in close proximity to those for αmβδ (0.46 ± 0.11 μM) and αβδ (1.9 ± 0.47 μM) receptors, suggesting these two components to the dose–response curves of ααmβδ (Figure 5A) are attributable to αmβδ and αβδ receptors. Moreover, the appearance of an intermediary component with an EC50 of 0.30 ± 0.03 μM (48.7 ± 5.6%) suggested the expression of receptor pentamers containing one WT and one mutant subunit (i.e. ααmβδ or αmαβδ). Similar to ααmβδ-expressing cells, the GABA dose–response curves of αββmδ-expressing cells revealed three distinct components (Figure 5B). The first component (24.7 ± 3.5%) had an EC50 of 0.03 ± 0.01 μM, corresponding to the αβmδ receptor population. Approximately 31.5 ± 2.6% of receptors exhibited an EC50 of 4.68 ± 0.74 μM attributable to αβδ receptors. Again, the appearance of an intermediary component with an EC50 of 0.31 ± 0.05 μM (43.9 ± 3.5%) was indicative of a third receptor population containing both β subtypes (i.e. β and βm).
Figure 5.
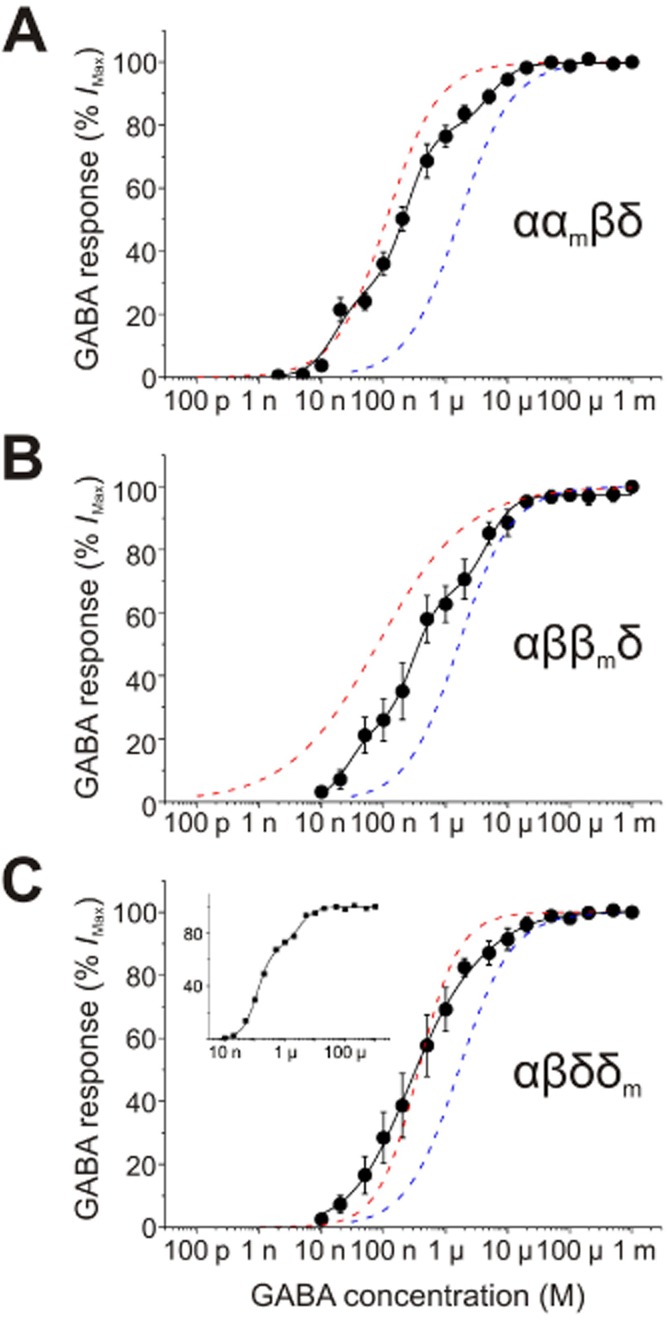
Co-expression of WT and mutant L9′S α4, β3 and δ subunits. GABA concentration–response curves (black continuous lines) for (A) ααmβδ (n = 6), (B) αββmδ (n = 6) and (C) αβδδm (n = 10), fitted using a two or three component Hill equation (see Methods section). Also shown for each receptor class are the Hill equation fits for the GABA concentration–response curves of WT αβδ receptors (blue dashed lines) and their respective L9′S mutants (red dashed lines): αmβδ (A), αβmδ (B) and αβδm (C). For αβδδm, the GABA dose–response curves of 7/10 cells exhibited two discernible components. The inset is an example of GABA dose–response curve from a cell exhibiting two such components. The total amount of cDNA used for each transfection was 4 μg, and equal amounts of WT and their respective L9′S mutant cDNA were used. Data points are shown as mean ± SEM.
Table 2.
GABA concentration–response curve components for WT and L9′S mutant containing αβδ receptors
| First component | Second component | Third component | |||||
|---|---|---|---|---|---|---|---|
| Receptor subunits | EC50 (μM) | Proportion % | EC50 (μM) | Proportion % | EC50 (μM) | Proportion % | nH |
| ααmβδ | 0.023 ± 0.005 | 34.0 ± 3.3 | 0.30 ± 0.03 | 48.7 ± 5.6 | 5.72 ± 0.90 | 17.5 ± 2.7 | 1.58 ± 0.36 |
| αββmδ | 0.03 ± 0.01 | 24.7 ± 3.5 | 0.31 ± 0.05 | 43.9 ± 3.5 | 4.68 ± 0.74 | 31.5 ± 2.6 | 2.06 ± 0.31 |
| αβδδm | 0.21 ± 0.01 | 75.8 ± 3.0 | – | – | 2.14 ± 0.48 | 24.2 ± 2.8 | 0.94 ± 0.09 |
GABA concentration–response curve parameters derived from curve fitting data from 6 to 10 HEK cells expressing ααmβδ, αββmδ or αβδδm. Individual cells expressing ααmβδ, αββmδ or αβδδm were fitted using a two or three component Hill equation. The relative component proportions (%) and GABA EC50 values are expressed as mean ± SEM. Cells were transfected with a cDNA transfection ratio of 10:1:10.
By contrast, the mean GABA dose–response curve for αβδδm receptors did not exhibit obvious multiple components (Figure 5C). However, detailed analysis of individual dose–response curves revealed that for most cells sampled (7/10), two components were discerned (Figure 5C inset). For those cells exhibiting two components, the majority of receptors (75.8 ± 3.0%) exhibited a GABA EC50 of 0.21 ± 0.01 μM, whereas 24.2 ± 2.8% of receptors exhibited an EC50 of 2.14 ± 0.48 μM. The GABA sensitivities of these two components are similar to the observed EC50s for αβδm and αβδ receptors respectively (Table 2). Although the remaining cells (3/10) did not overtly display multiple components, their GABA sensitivities were intermediary to those of αβδ-and αβδm-expressing cells. The absence of a third component suggested that αβδδm-expressing cells exhibit only two receptor populations, αβδ and αβδm, and thus it follows that each receptor complex is most likely to contain only one δ subunit.
Collectively, these data demonstrate that αβδ receptors are most likely to contain two αs, two βs and one δ subunit.
Discussion
Although the stoichiometry of synaptic α1β2γ2 subunit-containing GABAA receptors has consensus support for 2α:2β:1γ (Backus et al., 1993; Chang et al., 1996; Tretter et al., 1997), the stoichiometry of extrasynaptic δ-containing receptors remains unclear and potentially variable with a dependence on experimental conditions. This may reflect a difference in the co-assembly properties of δ, with different α and β subunits (Baur et al., 2009; Kaur et al., 2009; Wagoner and Czajkowski, 2010). We used an alternative approach to probe α4β3δ stoichiometry by introducing a well-characterized 9′ leucine-to-serine mutation into the M2 domains of α4, β3 and δ subunits. Each polar substitution increased the GABA sensitivity of mutant subunit-containing receptors (by approximately fourfold) in relative proportion with the number of mutant subunits assembled in the receptor. This, in conjunction with data derived from cells co-expressing mutant and respective WT subunits, revealed a relatively consistent subunit stoichiometry, by these methods, of 2α, 2β and 1δ.
Assumptions and limitations
Our deductions regarding α4β3δ GABAA receptor stoichiometry are predicated on the assumption that the L9′S mutations do not perturb the ‘normal’ subunit stoichiometry of these receptors. Because N-terminal motifs have been established as the key determinants of GABAA receptor subunit assembly (Connolly et al., 1996; Taylor et al., 1999; Klausberger et al., 2001), it seemed unlikely that a point mutation within the ion channel-lining M2 region would alter receptor subunit stoichiometry. However, it is intriguing that for most αβδδm-expressing cells, the component that was attributable to αβδm receptors was larger than that for αβδ receptors (∼75 and 24%, respectively), suggesting that δm might be more efficiently incorporated into functional receptors than δ.
Given the M2 location of the point mutation, a more likely explanation for the disproportionate percentage components is that the mutation may affect the gating kinetics of the receptor. For nAChRs (Filatov and White, 1995) and GABAA α1β3γ2L receptors (Bianchi and Macdonald, 2001), it has been demonstrated that 9′ mutant-containing receptors can exhibit altered single-channel conductances and/or open probabilities. This could cause the apparent percentage components of αβδ and αβδm to vary (Chang et al., 1996). Nevertheless, because our conclusions rely on the number of observable components in the dose–response curves and not on the relative contribution of each individual component, our conclusion that α4β3δ receptors contain only one δ subunit still remains valid.
Comparison with previous studies
To date, only two studies have investigated the subunit stoichiometry of unconstrained recombinant α4β2/3δ receptors. Although atomic force microscopy has revealed a subunit stoichiometry of 2α4:2β3:1δ (Barrera et al., 2008), the immunopurification of cell surface α4β2δ receptors suggested that by increasing the relative abundance of δ, more than one δ can be incorporated into the receptor complex (Wagoner and Czajkowski, 2010). Moreover, a study using receptor expression in oocytes reported that increasing relative amounts of δ cRNA increased the GABA EC50 and decreased the Hill slopes for α4β3δ GABA dose–response curves (You and Dunn, 2007).
Although a change in stoichiometry may account for altered receptor function, it is also equally plausible, from studies using concatemers and thus constrained subunit positions, that δ subunits may assume various locations within a functional receptor pentamer, and also potentially contribute to an agonist-binding site (Kaur et al., 2009; Sigel et al., 2009). Thus the previously described effects on receptor function may also have arisen from the rearrangement of subunits within the receptor. Indeed, for concatemeric α1β3δ receptors, those with an βαβαδ (anticlockwise) subunit arrangement appear to be ∼26-fold less sensitive to GABA than receptors with the βαβδα (anticlockwise) subunit arrangement (Kaur et al., 2009), demonstrating the functional importance of subunit location within a receptor pentamer.
Our data indicate that, at least for three commonly used α : β : δ transfection ratios 1:1:1, 1:1:10 or 10:1:10 (Borghese et al., 2006; Stórustovu and Ebert, 2006; Barrera et al., 2008; Hoestgaard-Jensen et al., 2010), the number of incorporated δ subunits seemingly remains fixed at one. Moreover, we found no significant effect of altering cDNA transfection ratio on α4β3δ receptor function. In accordance with our findings, another oocyte study had demonstrated no significant effect of altering cRNA transfection ratio on the sensitivity of WT α4β3δ receptors to GABA or Zn2+ (Borghese and Harris, 2007).
Although the discrepancy between our observations and those previously reported remain unclear, one difference may be the use of different expression systems. Alternatively, the use of different β isoforms may also give rise to these discrepancies. Given that β2 and β3 subunits have been demonstrated to have distinctive assembly properties (Taylor et al., 1999), this might have important implications for their oligomerization with δ subunits.
Subunit positioning
Although we demonstrate a stoichiometry of 2α:2β:1δ for α4β3δ receptors, our data give little indication of subunit arrangement, which could be an important determinant of αβδ receptor function (Baur et al., 2009; Kaur et al., 2009). The subunit positional arrangement of α1βγ2 receptors is widely accepted to be βαβαγ (anticlockwise) (Baumann et al., 2001; 2002,; Baur et al., 2006; Smart and Paoletti, 2012). Given the conflicting evidence regarding the number of incorporated δ subunits, it is unsurprising that the subunit arrangement of recombinant αβδ remains undefined. For α4β3δ receptors with a stoichiometry of 2α:2β:1δ, structural microscopic analysis has revealed a predominant βαβαδ anticlockwise arrangement (Barrera et al., 2008), suggesting δ can assume the position of the γ2 subunit in an αβγ receptor. However, in the same study, a minority of receptors (∼21%) were found to have an alternative βαβδα subunit arrangement, indicating more than one arrangement may be possible (Barrera et al., 2008). Indeed it has been recently demonstrated that δ can assume multiple positions when constrained within αβδ concatemers (Baur et al., 2009; Kaur et al., 2009). Intriguingly, concatemeric α4β2δ receptors with the βαβαδ conformation (Shu et al., 2012) form functional receptors with similar pharmacological profiles to unconstrained recombinant α4β2δ receptors (Stórustovu and Ebert, 2006), whereas α1β3δ receptors formed from the alternative βαβδα anticlockwise arrangement exhibit similar GABA and Zn2+ sensitivities to non-concatenated receptors (Kaur et al., 2009). These findings suggest that the arrangement of recombinant and native δ-containing receptors is still open to question.
To conclude, we demonstrate that the subunit stoichiometry of heterologously expressed α4β3δ receptors is 2α:2β:1δ. This stoichiometry remains unchanged even with varying cDNA transfection ratios, which may reflect that this is the preferred, dominant subunit assembly for this important extrasynaptic GABAA receptor subtype that underlies tonic inhibition in some areas of the brain.
Acknowledgments
This work was supported by the MRC. We are grateful to Damian Bright for his helpful comments on the manuscript.
Glossary
- M2
second transmembrane region
- nAChRs
nicotinic acetylcholine receptors
- PTX
picrotoxin
- SA
spontaneous channel activity
- WT
wild-type
Conflict of interest
None.
References
- Alexander SPH, Benson HE, Faccenda E, Pawson AJ, Sharman JL, Catterall WA, Spedding M, Peters JA, Harmar AJ, Collaborators CGTP. The Concise Guide to PHARMACOLOGY 2013/14: Overview. Br J Pharmacol. 2013;170:1449–1867. [Google Scholar]
- Backus KH, Arigoni M, Drescher U, Scheurer L, Malherbe P, Möhler H, et al. Stoichiometry of a recombinant GABAA receptor deduced from mutation-induced rectification. Neuroreport. 1993;5:285–288. doi: 10.1097/00001756-199312000-00026. [DOI] [PubMed] [Google Scholar]
- Barrera NP, Betts J, You H, Henderson RM, Martin IL, Dunn SMJ, et al. Atomic force microscopy reveals the stoichiometry and subunit arrangement of the α4β3δ GABAA receptor. Mol Pharmacol. 2008;73:960–967. doi: 10.1124/mol.107.042481. [DOI] [PubMed] [Google Scholar]
- Baumann SW, Baur R, Sigel E. Subunit arrangement of γ-aminobutyric acid type A receptors. J Biol Chem. 2001;276:36275–36280. doi: 10.1074/jbc.M105240200. [DOI] [PubMed] [Google Scholar]
- Baumann SW, Baur R, Sigel E. Forced subunit assembly in α1β2γ2 GABAA receptors: insight into the absolute arrangement. J Biol Chem. 2002;277:46020–46025. doi: 10.1074/jbc.M207663200. [DOI] [PubMed] [Google Scholar]
- Baur R, Minier F, Sigel E. A GABAA receptor of defined subunit composition and positioning: concatenation of five subunits. FEBS Lett. 2006;580:1616–1620. doi: 10.1016/j.febslet.2006.02.002. [DOI] [PubMed] [Google Scholar]
- Baur R, Kaur KH, Sigel E. Structure of α6β3δ GABAA receptors and their lack of ethanol sensitivity. J Neurochem. 2009;111:1172–1181. doi: 10.1111/j.1471-4159.2009.06387.x. [DOI] [PubMed] [Google Scholar]
- Bianchi MT, Macdonald RL. Mutation of the 9′ leucine in the GABAA receptor γ2L subunit produces an apparent decrease in desensitization by stabilizing open states without altering desensitized states. Neuropharmacology. 2001;41:737–744. doi: 10.1016/s0028-3908(01)00132-0. [DOI] [PubMed] [Google Scholar]
- Borghese CM, Harris RA. Studies of ethanol actions on recombinant δ-containing γ-aminobutyric acid type A receptors yield contradictory results. Alcohol. 2007;41:155–162. doi: 10.1016/j.alcohol.2007.03.006. [DOI] [PMC free article] [PubMed] [Google Scholar]
- Borghese CM, Stórustovu SI, Ebert B, Herd MB, Belelli D, Lambert JJ, et al. The δ subunit of γ-aminobutyric acid type A receptors does not confer sensitivity to low concentrations of ethanol. J Pharmacol Exp Ther. 2006;316:1360–1368. doi: 10.1124/jpet.105.092452. [DOI] [PubMed] [Google Scholar]
- Brickley SG, Revilla V, Cull-Candy SG, Wisden W, Farrant M. Adaptive regulation of neuronal excitability by a voltage-independent potassium conductance. Nature. 2001;409:88–92. doi: 10.1038/35051086. [DOI] [PubMed] [Google Scholar]
- Cestari IN, Min KT, Kulli JC, Yang J. Identification of an amino acid defining the distinct properties of murine β1 and β3 subunit-containing GABAA receptors. J Neurochem. 2000;74:827–838. doi: 10.1046/j.1471-4159.2000.740827.x. [DOI] [PubMed] [Google Scholar]
- Chang Y, Weiss DS. Allosteric activation mechanism of the α1β2γ2 γ-aminobutyric acid type A receptor revealed by mutation of the conserved M2 leucine. Biophys J. 1999;77:2542–2551. doi: 10.1016/s0006-3495(99)77089-x. [DOI] [PMC free article] [PubMed] [Google Scholar]
- Chang Y, Wang R, Barot S, Weiss DS. Stoichiometry of a recombinant GABAA receptor. J Neurosci. 1996;16:5415–5424. doi: 10.1523/JNEUROSCI.16-17-05415.1996. [DOI] [PMC free article] [PubMed] [Google Scholar]
- Connolly CN, Wooltorton JR, Smart TG, Moss SJ. Subcellular localization of γ-aminobutyric acid type A receptors is determined by receptor β subunits. Proc Natl Acad Sci U S A. 1996;93:9899–9904. doi: 10.1073/pnas.93.18.9899. [DOI] [PMC free article] [PubMed] [Google Scholar]
- Davies PA, Kirkness EF, Hales TG. Modulation by general anaesthetics of rat GABAA receptors comprised of α1β3 and β3 subunits expressed in human embryonic kidney 293 cells. Br J Pharmacol. 1997;120:899–909. doi: 10.1038/sj.bjp.0700987. [DOI] [PMC free article] [PubMed] [Google Scholar]
- Farrant M, Nusser Z. Variations on an inhibitory theme: phasic and tonic activation of GABAA receptors. Nat Rev Neurosci. 2005;6:215–229. doi: 10.1038/nrn1625. [DOI] [PubMed] [Google Scholar]
- Filatov GN, White MM. The role of conserved leucines in the M2 domain of the acetylcholine receptor in channel gating. Mol Pharmacol. 1995;73:379–384. [PubMed] [Google Scholar]
- Glykys J, Peng Z, Chandra D, Homanics GE, Houser CR, Mody I. A new naturally occurring GABAA receptor subunit partnership with high sensitivity to ethanol. Nat Neurosci. 2007;10:40–48. doi: 10.1038/nn1813. [DOI] [PubMed] [Google Scholar]
- Glykys J, Mann EO, Mody I. Which GABAA receptor subunits are necessary for tonic inhibition in the hippocampus? J Neurosci. 2008;28:1421–1426. doi: 10.1523/JNEUROSCI.4751-07.2008. [DOI] [PMC free article] [PubMed] [Google Scholar]
- Hoestgaard-Jensen K, Dalby NO, Wolinsky TD, Murphey C, Jones KA, Rottländer M, et al. Pharmacological characterization of a novel positive modulator at α4β3δ-containing extrasynaptic GABAA receptors. Neuropharmacology. 2010;58:702–711. doi: 10.1016/j.neuropharm.2009.12.023. [DOI] [PubMed] [Google Scholar]
- Hosie AM, Dunne EL, Harvey RJ, Smart TG. Zinc-mediated inhibition of GABAA receptors: discrete binding sites underlie subtype specificity. Nat Neurosci. 2003;6:362–369. doi: 10.1038/nn1030. [DOI] [PubMed] [Google Scholar]
- Jones A, Korpi ER, McKernan RM, Pelz R, Nusser Z, Mäkelä R, et al. Ligand-gated ion channel subunit partnerships: GABAA receptor α6 subunit gene inactivation inhibits δ subunit expression. J Neurosci. 1997;17:1350–1362. doi: 10.1523/JNEUROSCI.17-04-01350.1997. [DOI] [PMC free article] [PubMed] [Google Scholar]
- Kaur KH, Baur R, Sigel E. Unanticipated structural and functional properties of δ-subunit-containing GABAA receptors. J Biol Chem. 2009;284:7889–7896. doi: 10.1074/jbc.M806484200. [DOI] [PMC free article] [PubMed] [Google Scholar]
- Klausberger T, Sarto I, Ehya N, Fuchs K, Furtmüller R, Mayer B, et al. Alternate use of distinct intersubunit contacts controls GABAA receptor assembly and stoichiometry. J Neurosci. 2001;21:9124–9133. doi: 10.1523/JNEUROSCI.21-23-09124.2001. [DOI] [PMC free article] [PubMed] [Google Scholar]
- Korpi ER, Gründer G, Lüddens H. Drug interactions at GABAA receptors. Prog Neurobiol. 2002;67:113–159. doi: 10.1016/s0301-0082(02)00013-8. [DOI] [PubMed] [Google Scholar]
- Krishek BJ, Moss SJ, Smart TG. A functional comparison of the antagonists bicuculline and picrotoxin at recombinant GABAA receptors. Neuropharmacology. 1996;35:1289–1298. doi: 10.1016/s0028-3908(96)00089-5. [DOI] [PubMed] [Google Scholar]
- Krishek BJ, Moss SJ, Smart TG. Interaction of H+ and Zn2+ on recombinant and native rat neuronal GABAA receptors. J Physiol. 1998;507:639–652. doi: 10.1111/j.1469-7793.1998.639bs.x. [DOI] [PMC free article] [PubMed] [Google Scholar]
- Labarca C, Nowak MW, Zhang H, Tang L, Deshpande P, Lester HA. Channel gating governed symmetrically by conserved leucine residues in the M2 domain of nicotinic receptors. Nature. 1995;376:514–516. doi: 10.1038/376514a0. [DOI] [PubMed] [Google Scholar]
- Mortensen M, Smart TG. Extrasynaptic αβ subunit GABAA receptors on rat hippocampal pyramidal neurons. J Physiol. 2006;577:841–856. doi: 10.1113/jphysiol.2006.117952. [DOI] [PMC free article] [PubMed] [Google Scholar]
- Mortensen M, Smart TG. Single-channel recording of ligand-gated ion channels. Nat Protoc. 2007;2:2826–2841. doi: 10.1038/nprot.2007.403. [DOI] [PubMed] [Google Scholar]
- Nagaya N, Macdonald RL. Two γ2L subunit domains confer low Zn2+ sensitivity to ternary GABAA receptors. J Physiol. 2001;532:17–30. doi: 10.1111/j.1469-7793.2001.0017g.x. [DOI] [PMC free article] [PubMed] [Google Scholar]
- Peng Z, Hauer B, Mihalek RM, Homanics GE, Sieghart W, Olsen RW, et al. GABAA receptor changes in δ subunit-deficient mice: altered expression of α4 and γ2 subunits in the forebrain. J Comp Neurol. 2002;446:179–197. doi: 10.1002/cne.10210. [DOI] [PubMed] [Google Scholar]
- Porcello DM, Huntsman MM, Mihalek RM, Homanics GE, Huguenard JR. Intact synaptic GABAergic inhibition and altered neurosteroid modulation of thalamic relay neurons in mice lacking δ subunit. J Neurophysiol. 2003;89:1378–1386. doi: 10.1152/jn.00899.2002. [DOI] [PubMed] [Google Scholar]
- Santhakumar V, Jones RT, Mody I. Developmental regulation and neuroprotective effects of striatal tonic GABAA currents. Neuroscience. 2010;167:644–655. doi: 10.1016/j.neuroscience.2010.02.048. [DOI] [PMC free article] [PubMed] [Google Scholar]
- Shu H-J, Bracamontes J, Taylor A, Wu K, Eaton MM, Akk G, et al. Characteristics of concatemeric GABAA receptors containing α4/δ subunits expressed in Xenopus oocytes. Br J Pharmacol. 2012;165:2228–2243. doi: 10.1111/j.1476-5381.2011.01690.x. [DOI] [PMC free article] [PubMed] [Google Scholar]
- Sieghart W, Ramerstorfer J, Sarto-Jackson I, Varagic Z, Ernst M. A novel GABAA receptor pharmacology: drugs interacting with the α(+) β(−) interface. Br J Pharmacol. 2012;166:476–485. doi: 10.1111/j.1476-5381.2011.01779.x. [DOI] [PMC free article] [PubMed] [Google Scholar]
- Sigel E, Kaur KH, Lüscher BP, Baur R. Use of concatamers to study GABAA receptor architecture and function: application to δ-subunit-containing receptors and possible pitfalls. Biochem Soc Trans. 2009;37:1338–1342. doi: 10.1042/BST0371338. [DOI] [PubMed] [Google Scholar]
- Smart TG, Paoletti P. Synaptic neurotransmitter-gated receptors. Cold Spring Harb Perspect Biol. 2012;4:a009662. doi: 10.1101/cshperspect.a009662. [DOI] [PMC free article] [PubMed] [Google Scholar]
- Smart TG, Moss SJ, Xie X, Huganir RL. GABAA receptors are differentially sensitive to zinc: dependence on subunit composition. Br J Pharmacol. 1991;103:1837–1839. doi: 10.1111/j.1476-5381.1991.tb12337.x. [DOI] [PMC free article] [PubMed] [Google Scholar]
- Somogyi P, Fritschy J-M, Benke D, Roberts JD, Sieghart W. The γ2 subunit of the GABAA receptor is concentrated in synaptic junctions containing the α1 and β subunits in hippocampus, cerebellum and globus pallidus. Neuropharmacology. 1996;35:1425–1444. doi: 10.1016/s0028-3908(96)00086-x. [DOI] [PubMed] [Google Scholar]
- Stórustovu SI, Ebert B. Pharmacological characterization of agonists at δ-containing GABAA receptors: functional selectivity for extrasynaptic receptors is dependent on the absence of γ2. J Pharmacol Exp Ther. 2006;316:1351–1359. doi: 10.1124/jpet.105.092403. [DOI] [PubMed] [Google Scholar]
- Sur C, Farrar SJ, Kerby J, Whiting PJ, Atack JR, McKernan RM. Preferential coassembly of α4 and δ subunits of the γ-aminobutyric acid A receptor in rat thalamus. Mol Pharmacol. 1999;56:110–115. doi: 10.1124/mol.56.1.110. [DOI] [PubMed] [Google Scholar]
- Taylor PM, Thomas P, Gorrie GH, Connolly CN, Smart TG, Moss SJ. Identification of amino acid residues within GABAA receptor β subunits that mediate both homomeric and heteromeric receptor expression. J Neurosci. 1999;19:6360–6371. doi: 10.1523/JNEUROSCI.19-15-06360.1999. [DOI] [PMC free article] [PubMed] [Google Scholar]
- Tretter V, Ehya N, Fuchs K, Sieghart W. Stoichiometry and assembly of a recombinant GABAA receptor subtype. J Neurosci. 1997;17:2728–2737. doi: 10.1523/JNEUROSCI.17-08-02728.1997. [DOI] [PMC free article] [PubMed] [Google Scholar]
- Wagoner KR, Czajkowski C. Stoichiometry of expressed α4β2δ γ-aminobutyric acid type A receptors depends on the ratio of subunit cDNA transfected. J Biol Chem. 2010;285:14187–14194. doi: 10.1074/jbc.M110.104257. [DOI] [PMC free article] [PubMed] [Google Scholar]
- Wallner M, Hanchar HJ, Olsen RW. Ethanol enhances α4β3δ and α6β3δ γ-aminobutyric acid type A receptors at low concentrations known to affect humans. Proc Natl Acad Sci U S A. 2003;100:15218–15223. doi: 10.1073/pnas.2435171100. [DOI] [PMC free article] [PubMed] [Google Scholar]
- Wooltorton JR, Moss SJ, Smart TG. Pharmacological and physiological characterization of murine homomeric β3 GABAA receptors. Eur J Neurosci. 1997;9:2225–2235. doi: 10.1111/j.1460-9568.1997.tb01641.x. [DOI] [PubMed] [Google Scholar]
- Yakel JL, Lagrutta A, Adelman JP, North RA. Single amino acid substitution affects desensitization of the 5-hydroxytryptamine type 3 receptor expressed in Xenopus oocytes. Proc Natl Acad Sci U S A. 1993;90:5030–5033. doi: 10.1073/pnas.90.11.5030. [DOI] [PMC free article] [PubMed] [Google Scholar]
- You H, Dunn SMJ. Identification of a domain in the δ subunit (S238-V264) of the α4β3δ GABAA receptor that confers high agonist sensitivity. J Neurochem. 2007;103:1092–1101. doi: 10.1111/j.1471-4159.2007.04817.x. [DOI] [PubMed] [Google Scholar]