

Abstract
Background and purpose
In vitro inhibitory potency (Ki)-based predictions of P-glycoprotein (P-gp)-mediated drug-drug interactions (DDIs) are hampered by the substantial variability in inhibitory potency. In this study, in vivo-based [I]/Ki values were used to predict the DDI risks of a P-gp substrate dabigatran etexilate (DABE) using physiologically based pharmacokinetic (PBPK) modelling.
Experimental approach
A baseline PBPK model was established with digoxin, a known P-gp substrate. The Km (P-gp transport) of digoxin in the baseline PBPK model was adjusted to Kmi to fit the change of digoxin pharmacokinetics in the presence of a P-gp inhibitor. Then ‘in vivo’ [I]/Ki of this P-gp inhibitor was calculated using Kmi/Km. Baseline PBPK model was developed for DABE, and the ‘in vivo’ [I]/Ki was incorporated into this model to simulate the static effect of P-gp inhibitor on DABE pharmacokinetics. This approach was verified by comparing the observed and the simulated DABE pharmacokinetics in the presence of five different P-gp inhibitors.
Key results
This approach accurately predicted the effects of five P-gp inhibitors on DABE pharmacokinetics (98–133% and 89–104% for the ratios of AUC and Cmax respectively). The effects of 16 other P-gp inhibitors on the pharmacokinetics of DABE were also confidently simulated.
Conclusions and implications
‘In vivo’ [I]/Ki and PBPK modelling, used in combination, can accurately predict P-gp-mediated DDIs. The described framework provides a mechanistic basis for the proper design of clinical DDI studies, as well as avoiding unnecessary clinical DDI studies.
Keywords: ‘in vivo’ Ki, physiologically based pharmacokinetic modelling, dabigatran etexilate, P-glycoprotein, digoxin
Introduction
The transporter protein P-glycoprotein (P-gp) affects drug pharmacokinetics by limiting oral absorption, restricting CNS penetration and promoting excretion. Drug-drug interactions (DDIs) may occur when a P-gp substrate is co-administered with other drugs that inhibit P-gp. Accurate prediction of a potential risk of DDI is of great importance both within the pharmaceutical industry and in clinical practice in order to improve the safety and efficacy of new drugs.
Dabigatran etexilate (DABE) is a P-gp substrate and the first new oral anticoagulant to become available for the prevention of stroke and systemic embolism in patients with atrial fibrillation in over 50 years (Connolly et al., 2009). The orally administered prodrug DABE is absorbed in the intestine and then converted by carboxylesterase (CES) to the active moiety dabigatran (DAB) which is not a P-gp substrate) (Härtter et al., 2013; Hu et al., 2013). Drugs that inhibit P-gp, such as verapamil, amiodarone and quinidine, raise exposures to DAB (Härtter et al., 2013).
P-gp-mediated DDIs can be predicted by either a static approach or a dynamic (physiologically based pharmacokinetic, PBPK) approach. Although the static approach for the prediction of CYP450-and organic anion-transporting polypeptide (OATP)-mediated DDIs is quite successful (Hu et al., 2012; Hu, 2013), the same approach for the prediction of P-gp-mediated DDIs is only qualitative due to the high rates of false-negative (10–12%) and false-positive (40–51%) results (Fenner et al., 2009; Ellens et al., 2013). This is probably caused by the inaccurate estimation of [I] (the effective inhibitor concentration) and Ki (inhibition constant) in the prediction of P-gp-mediated DDIs. Studies using the dynamic approach are very limited. Recently, a PBPK approach for the prediction of DDI between the P-gp substrate digoxin and verapamil was introduced (Neuhoff et al., 2013b) and the predicted AUC ratio of digoxin following administration of verapamil was 1.20, while the observed value was 1.50. The verapamil Ki values considered in this study ranged from 0.1 to 16.3 (eight values from different references). The authors used the lowest Ki values for the worst-case scenario. Underestimation of the DDI will occur when other Ki values were considered. The success of this approach is dependent on the accuracy of the in vitro Ki used. Recently, a collaborative study was initiated between 23 pharmaceutical and contract research laboratories and one academic institution to compare in vitro IC50 data generated using four in vitro systems (Caco-2, MDCKII-MDR1, LLC-PK1-MDR1 cells and membrane vesicles) and six transport activity equations (Bentz et al., 2013). Unfortunately, the difference in IC50 values for each of the 16 inhibitors across all test systems ranged from a minimum of 20-to 24-fold between lowest and highest IC50 values for sertraline and isradipine, to a maximum of 407-and 796-fold for telmisartan and verapamil respectively. Further analysis showed that variability in IC50 values was mainly due to inter-laboratory variability, rather than the systematic difference between test systems. Such substantial variability will seriously decrease the accuracy of prediction of DDIs. For example, the in vitro IC50 value from some laboratories may predict significant DDI, whereas others may either over-or underestimate a DDI.
Therefore, the major challenge for the prediction of P-gp-mediated DDIs is how to identify or obtain the ‘true’ Ki value, which is a key input for both the static and dynamic approach. In order to overcome this difficulty, we have used the information from a typical P-gp-mediated DDI (between the P-gp substrate digoxin and a particular P-gp inhibitor) to calculate the ‘in vivo’ [I]/Ki for this P-gp inhibitor based on a PBPK approach. Then the ‘in vivo’ [I]/Ki was incorporated into the PBPK model of a test P-gp substrate (DABE) to simulate the DDI risk of DABE with this P-gp inhibitor. Our prediction method can be seen as a ‘static’ approach because the effective inhibitor concentration [I] in the inhibiting site is kept unchanged. This assumption is reasonable if the primary site of inhibition is in the intestine during oral absorption. We found that the elimination half-life and renal clearance of P-gp substrates such as digoxin and fexofenadine, were hardly altered by an inhibitor (Yasui-Furukori et al., 2005; Tateishi et al., 2008; Härtter et al., 2013), suggesting the DDIs occur mainly in the intestine during the absorption process. Indeed, there were only minimal DDI risks when intravenous digoxin was given together with P-gp inhibitors (Fenner et al., 2009).
The primary aim of this study was to develop an ‘in vivo’ [I]/Ki-and PBPK modelling-based approach for the quantitative prediction of P-gp-mediated DDIs with DABE. The approach was verified by the known effects of five different P-gp inhibitors on DABE pharmacokinetics. After that, the verified approach was used to predict the effects of 16 other P-gp inhibitors that had not been studied, on the pharmacokinetics of DABE.
Methods
Development of the PBPK model
Modelling workflow
A workflow describing the model building and validation processes that were applied to the development of the PBPK model is outlined in Figure 1. The details are described as follows:
Figure 1.
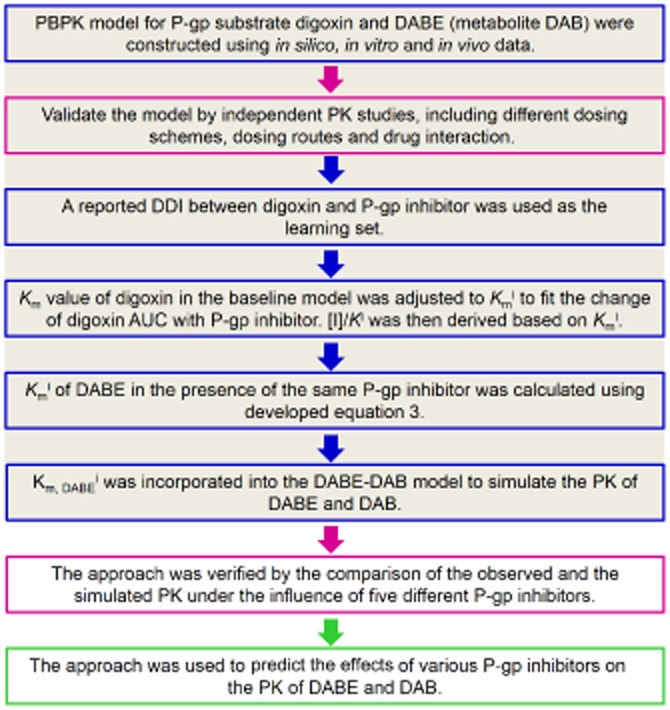
Workflow describing the model building and validation processes that were applied to the development of the ‘in vivo’ Ki-and physiologically based pharmacokinetic modelling-based approach for the prediction of P-glycoprotein (P-gp)-mediated drug-drug interactions involving dabigatran etexilate (DABE) and its active metabolite dabigatran (DAB).
PBPK models for the orally administered P-gp substrates, digoxin and DABE (including its metabolite DAB), were constructed using in vitro and in silico data (Bottom-up), as well as the observations in a set of PK studies (Top-down). The model building strategy by Neuhoff et al. (2013a) was used here with some modifications.
The developed PBPK models were validated by a set of independent validation PK studies, including different doses, multiple doses, intravenous dosing or drug interaction data (P-gp-mediated induction). The major purpose of this step is to verify the contribution of passive and active efflux (P-gp) in the absorption of the studied P-gp substrates.
A reported DDI between the typical P-gp substrate (digoxin) and an inhibitor is used as the learning set. Assuming competitive inhibition, the Km value of digoxin in the baseline PBPK model was adjusted to Kmi to fit the change of digoxin AUC in the presence of a P-gp inhibitor. For competitive inhibition, intrinsic clearance of P-gp-mediated efflux (digoxin) in the presence of inhibition (CLinti) can be calculated using equation 1, which is under first order conditions (Rowland and Matin, 1973).
| (1) |
where Vmax is the maximum rate of reaction. Km, DI is the Michaelis–Menten constant for digoxin without inhibition. Km,DIi is the Michaelis–Menten constant for digoxin in the presence of inhibition. [I] is the effective inhibitor concentration. Ki is the inhibition constant. Equation 2 can be derived from equation 1.
| (2) |
Therefore, [I]/Ki of this particular P-gp inhibitor can be calculated using equation 2. It should be noted that [I]/Ki is purely derived from in vivo information and can been seen as the in vivo [I]/Ki (compared with the in vitro measured [I]/Ki).
(iv) A DDI between DABE and the same inhibitor is used as the test set. Kmi of DABE in the presence of the same P-gp inhibitor is calculated using equation 3. As shown in this equation, we need not know the actual Ki of an inhibitor to calculate the Kmi of DABE.
| (3) |
where k is the correction factor to compensate for the dose differences of this P-gp inhibitor between the learning set and test set (k = 1, if the same dose is used). Then the calculated Kmi was incorporated into the PBPK model of DABE to simulate the PK of DABE and DAB.
(v) The approach was verified by the comparison of the observed and simulated PK in the presence of five different P-gp inhibitors. The verified approach was finally used to predict the effects of various P-gp inhibitors on the PK of DABE and DAB.
Model structure and parameterization
The PBPK models for digoxin, DABE (incorporating its metabolite DAB) were built using the commercial software tool, PK-Sim® (version 5.1; Bayer Technology Services GmbH, Leverkusen, Germany), which implements a whole-body PBPK model consisting of 15 organs. The PBPK models of DABE and DAB were exported to MoBi (version 3.1; Bayer Technology Services GmbH), where they were linked to build the coupled parent-metabolite model.
All PBPK models described in the following assume an average 30-year-old white man with a body weight of 78 kg and a height of 177 cm. Physiological parameters describing basic model structure such as organ volumes, organ weights, tissue composition, blood flow rates or gastrointestinal physiology are provided within the software. The key measured and predicted input data for digoxin, DABE and DAB are listed in Table 1.
Table 1.
In silico, in vitro and in vivo data for parameterization of the physiologically based pharmacokinetic (PBPK) models for digoxin, dabigatran etexilate (DABE) and its active metabolite dabigatran (DAB)
| Digoxin | DABE | DAB | ||||
|---|---|---|---|---|---|---|
| Parameter | Initial | Refined | Initial | Refined | Initial | Refined |
| LogP | 1.26 (1) | NA | 3.80 (2) | NA | −2.2 (3) | NA |
| Molecular weight | 781 | NA | 627 | NA | 471 | NA |
| Fraction unbound in plasma (fu) | 0.71 (1) | NA | 0.07a | NA | 0.65 (4) | NA |
| pKa | NA | NA | 4.0 (base), 6.7 (base) (2) | NA | 4.1 (base), 4.4 (acid), 12.4 (base) (3) | NA |
| Aqueous solubility (mg mL−1) | 0.024 (1) | 1.0b | 1.8 (2) | NA | 17 (3) | NA |
| Human blood: plasma ratio | 0.83 | NA | 3.08 | NA | 0.67 (5) | NA |
| Cellular (organ) permeability (nm s−1) | 0.39 | 1.33 | 498 | 667 | 0.003 | 1.0 |
| Intestinal permeability (nm s−1) | 0.005 | 0.008 | 4.33 | 0.08 | NA | NA |
| Renal clearance (mL min−1 kg−1) | 2.2 | 1.1 | NA | NA | 1.63 (4)c | NA |
| Total hepatic clearance (mL min−1 kg−1) | NA | NA | NA | NA | 0.41 (4)c | NA |
| CES1 metabolism | ||||||
| CES1 concentration (μmol L−1) | NA | NA | 1.0 | 1.59 | NA | NA |
| Vmax (μmol min−1 L−1) | NA | NA | NA | 80 | NA | NA |
| Km (μM) | NA | NA | 34d | 70 | NA | NA |
| P-gp transport | ||||||
| P-gp concentration (μmol L−1) | 1.0 | NA | 1.0 | NA | NA | NA |
| Vmax (μmol min−1 L−1) | NA | 20 | NA | 10 | NA | NA |
| Km (μM) | 177 (1) | NA | NA | 1.0 | NA | NA |
| Specific binding | ||||||
| Koff | NA | 0.001 | NA | NA | NA | NA |
| Kd | NA | 0.01 | NA | NA | NA | NA |
If not indicated, the input data were calculated by PK-Sim or was the default value in PK-Sim. The refined values were obtained by fitting the simulated plasma concentration-time profiles with the observed ones. Vmax, maximum rate of reaction; Km, Michaelis–Menten constant; Koff, dissociation rate constant; Kd, dissociation constant; NA, not applicable. The unit for the specific Vmax used in the simulation is μmol min−1 L−1 (referring to the cellular volume).
fu of DABE is calculated using SimCYP ADME Calculators (http://www.simcyp.com/ProductServices/FreeADMETools).
According to the study by Neuhoff et al. (2013a), the formulations currently on the market sufficiently increase the solubility.
Unchanged dabigatran in urine accounted for about 80% of the i.v. dose of dabigatran (Blech et al., 2008). Renal clearance was calculated by multiplying the total intravenous clearance (155 mL min−1) by 80%. The remaining 20% of total clearance was attributed to hepatic clearance.
From DABE enzyme kinetic studies in human liver S9 (Laizure et al., 2013).
References (1), Neuhoff et al., 2013a; (2), http://files.boehringer.com.au/files/PI/Pradaxa%20PI.pdf; (3), http://www.accessdata.fda.gov/drugsatfda_docs/nda/2010/022512orig1s000ea.pdf; (4), Blech et al., 2008; (5), http://www.fda.gov/downloads/AdvisoryCommittees/CommitteesMeetingMaterials/Drugs/CardiovascularandRenalDrugsAdvisoryCommittee/UCM247244.pdf.
A detailed model for GI transit and absorption was used (Thelen et al., 2011; 2012,). In this model, the alimentary canal from the stomach to the rectum is divided into 12 compartments, each representing a definite segment of the GI tract. Intestinal permeability was calculated from the drug's lipophilicity and effective molecular weight.
The PK-Sim standard distribution model was used, which assumes four subcompartments per organ, for example, compartments for blood cells, plasma, interstitial space and cellular space. This model type considers a permeation barrier between blood and organ tissue. The rates of permeation across the cell membranes (interstitial-cell barrier) depend on the drug-specific cellular membrane permeability and the surface area available of each organ. The cellular membrane permeability values were calculated using the ‘PK-Sim Standard’ method. Tissue/plasma partition coefficients were generated using the model of Rodgers and Rowland (Rodgers et al., 2005; Rodgers and Rowland, 2006; 2007,).
Disposition characteristics of digoxin and DABE in humans
Digoxin is a P-gp substrate without the confounding effects of metabolism. P-gp plays a predominant role in the absorption and elimination of digoxin in vivo (Fenner et al., 2009). Currently, there is no published evidence showing that digoxin is transported by any other drug transporter. The transportation of digoxin by P-gp was modelled based on Michaelis–Menten kinetics. The relative gene expression data of P-gp was integrated in the PBPK models (Meyer et al., 2012). According to this expression data, P-gp was expressed extensively in the body including intestine, kidney and liver. Therefore, the involvement of P-gp in the hepatic and renal clearance was also considered. Renal excretion (renal clearance) was considered as the only excretion route for the elimination of digoxin in humans (Neuhoff et al., 2013a). As with methotrexate (Bischoff et al., 1971) and docetaxel (Bradshaw-Pierce et al., 2007), specific binding to tissue components was included. This was justified by the finding that receptor (Na+/K+-ATPase) binding was the rate-limiting step for the distribution of digoxin (Weiss, 2007). Plasma levels of digoxin were influenced by the changes in capacity and/or affinity of digoxin binding to sodium pumps in vivo (Weiss, 2007). Two parameters, Koff (dissociation rate constant, 1 min−1) and Kd (dissociation constant, μmol L−1) were introduced to express the nonlinear binding within tissue. The addition of a non-linear binding term not only makes the model more relevant to the biochemical process in the body, but also resulted in better prediction.
The oral prodrug DABE, which is a P-gp substrate, was converted by CES enzymes to the active moiety DAB, which is not a P-gp substrate (Hu et al., 2013). DAB was formed primarily in the liver by CES1 (Laizure et al., 2013). Therefore, only hepatic CES1 was assumed to mediate the formation of DAB during first-pass metabolism. The relative gene expression data of CES1 is used in the PBPK models. The conversion of DABE to DAB by CES1 and the efflux of DABE by P-gp were both modelled using Michaelis–Menten kinetics. Renal excretion (renal clearance) and hepatic metabolism (hepatic clearance) were considered as the elimination pathways of DAB from the body (Blech et al., 2008).
PK data analysis
PK parameters were determined by a non-compartmental method using the Kinetica 5.0 (Thermo Fisher Scientific; Philadelphia, PA, USA). The area under the concentration-time curve up to the last measured time point (AUC0→t) was calculated using the trapezoidal method. The AUC from time zero to infinity (AUC0→∞) was generated by extrapolating the AUC0→t to infinity using the elimination rate constant and the last measured concentration. All the human in vivo data were obtained from published data by digitalization with data mining software (GetData Graph Digitizer version 2.25, http://www.getdata-graph-digitizer.com).
Results
Simulation of DABE and DAB pharmacokinetics in humans
The predicted or assumed input data (Table 1) were refined to match the simulated plasma concentration-time profiles of DABE and DAB with the observed data (Stangier, 2008; Stangier et al., 2008; Härtter et al., 2012; 2013,) (Figure 2A, single oral dosing of 150 mg DABE). As shown in Figure 2B and D, the model was verified by the comparison of the simulated and observed data of multiple dosing (twice daily of 150 mg DABE) and dose-exposure relationships (Stangier et al., 2007; 2012). For the dose-exposure relationships, it should be noted that the observed exposures to DAB was higher than the simulated data. This is possibly due to the different formulations that were utilized for the observed data (solution) and simulated data (capsule). In addition, there was a good agreement between the simulated [increased baseline Vmax by 3.5 times based on the induction of P-gp expression level by rifampicin (Greiner et al., 1999)] and observed exposures to DAB in the presence of the P-gp inducer rifampicin (Figure 2C). The observed ratio of DAB AUC0→∞ (AUCR) and Cmax (Cmax, R) in the presence and absence of the inducer was 0.33 and 0.34 respectively (Härtter et al., 2012). The predicted values were 0.29 and 0.28 respectively.
Figure 2.
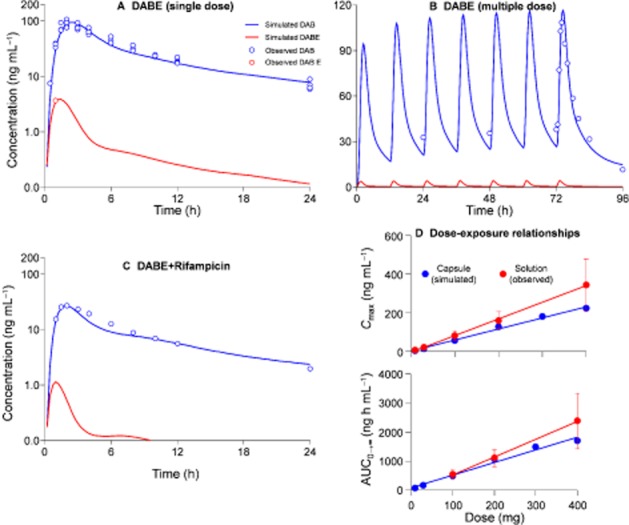
Simulated and observed plasma concentration-time profiles of dabigatran etexilate (DABE) and dabigatran (DAB) in human subjects after single oral dosing of 150 mg DABE (A), multiple dosing (twice daily) of 150 mg DABE (B), and co-administration of rifampicin (C, rifampicin 600 mg once daily administered for 7 days). The simulated and observed relationships between DABE doses (10 to 400 mg) and exposures to DAB (Cmax and AUC0→∞) were also shown in panel D. For the dose-exposure relationships, the simulated data were for DABE capsule while the observed data were obtained from DABE solution. The observed data (average values) were obtained from published papers (Stangier et al., 2007; 2008,; 2012,; Stangier, 2008; Härtter et al., 2012; 2013,).
Simulation of digoxin pharmacokinetics in humans
The predicted or assumed input data (Table 1) were refined to match the simulated plasma concentration-time profile of digoxin with the observed data (Ragueneau et al., 1999; Westphal et al., 2000; Becquemont et al., 2001; Verstuyft et al., 2003) (Figure 3A, single oral dosing of 0.5 mg digoxin). Then the developed PBPK model was validated by the comparison of the simulated and observed data of other dose levels (single oral dosing of 0.25 mg and 1.0 mg) (Oosterhuis et al., 1991; Greiner et al., 1999; Eckermann et al., 2012) (Figure 3B and C). Good agreement was also observed between simulated and observed data from multiple dosing regimens (oral 0.25 mg once daily and twice daily) (Rodin et al., 1988; Vaidyanathan et al., 2008) (Figure 3D and E). With regard to the intravenous dosing, the simulated data and the observed data are very close (Kramer et al., 1979; Ding et al., 2004) (Figure 3F and G).
Figure 3.
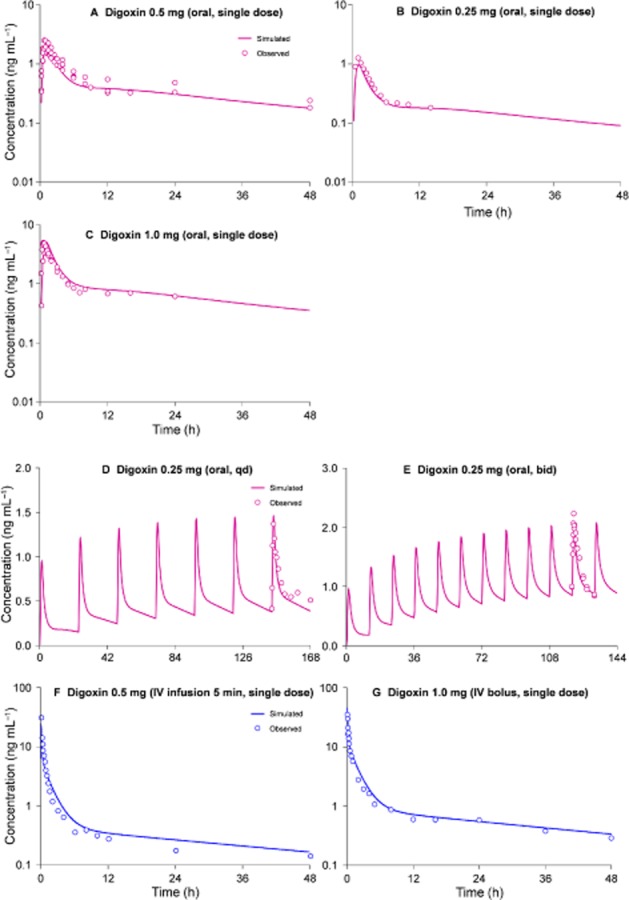
Simulated and observed plasma concentration-time profiles of digoxin in humans after dosing of digoxin. A, single oral dosing of 0.5 mg digoxin; B, single oral dosing of 0.25 mg; C, single oral dosing of 1.0 mg. D, oral administration of 0.25 mg digoxin once daily; E, oral administration of 0.25 mg digoxin twice daily; F, intravenous infusion of 0.5 mg digoxin over 5 min; G, intravenous bolus of 1.0 mg digoxin. The observed data (average values) were obtained from published papers (Kramer et al., 1979; Rodin et al., 1988; Oosterhuis et al., 1991; Greiner et al., 1999; Ragueneau et al., 1999; Westphal et al., 2000; Becquemont et al., 2001; Verstuyft et al., 2003; Ding et al., 2004; Vaidyanathan et al., 2008; Eckermann et al., 2012).
Calculation of the ‘in vivo’ [I]/Ki
The calculated ‘in vivo’ [I]/Ki (calculated using equation 3) of various P-gp inhibitors are shown in Supporting Information Table S1. The values of these ‘in vivo’ [I]/Ki were dependent on the doses of the inhibitors. Kmi values of DABE (Km,DABEi, calculated using equation 3) in the presence of various P-gp inhibitors are also shown in Supporting Information Table S1.
Comparison of the observed and simulated exposure to DAB in the presence of five P-gp inhibitors
As shown in Figure 4, there was a good agreement between the predicted and observed plasma concentration-time profile of DAB in the presence of verapamil. Positive DDIs between five P-gp inhibitors (amiodarone, clarithromycin, dronedarone, quinidine, verapamil) and DABE were reported. Our new ‘in vivo’ Ki-based PBPK approach successfully predicted these DDI risks. The predictive accuracy for AUCR and Cmax, R ranged from 98–133% to 89–104% respectively (Table 2).
Figure 4.
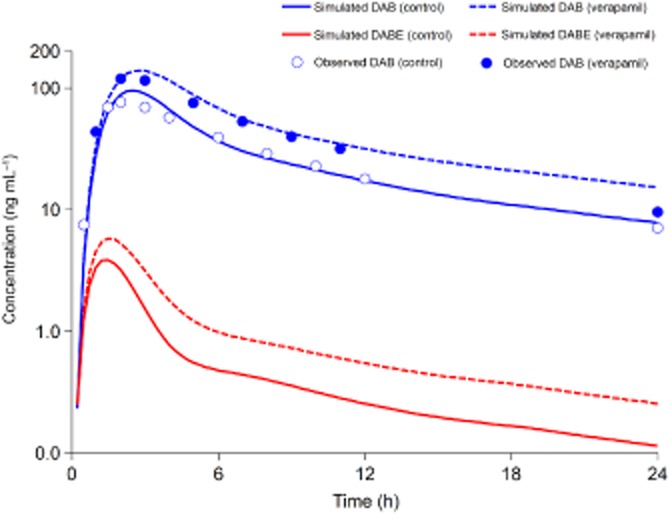
Simulated and observed plasma concentration-time profiles of dabigatran etexilate (DABE) and dabigatran (DAB) in human subjects after single oral dosing of 150 mg DABE with or without co-administration of verapamil (120 mg twice daily) (Härtter et al., 2013).
Table 2.
Observed and simulated exposures to active metabolite dabigatran (DAB) in humans after co-administration of dabigatran etexilate (DABE, single oral dosing of 150 mg) and various P-gp inhibitors
| Inhibitors | Inhibitor dosing schemes | Observed AUCR | Simulated AUCR | Accuracy (AUCR) | Observed Cmax, R | Simulated Cmax, R | Accuracy (Cmax, R) | Ref. |
|---|---|---|---|---|---|---|---|---|
| Validation set | ||||||||
| Amiodarone | 600 mg, single | 1.60 | 1.57 | 98% | 1.50 | 1.36 | 91% | (1) |
| Clarithromycin | 500 mg, bid | 1.60 | 2.04 | 128% | 1.49 | 1.54 | 104% | (2) |
| Dronedarone | 400 mg, single | 2.36 | 3.13 | 133% | 2.25 | 2.08 | 92% | (1) |
| Quinidine | 200 mg, every 2 h | 1.53 | 1.79 | 117% | 1.56 | 1.48 | 95% | (1) |
| Verapamil | 120 mg, bid | 1.53 | 1.75 | 114% | 1.64 | 1.46 | 89% | (3) |
| Prediction set | ||||||||
| Captopril | 1.25 mg, tid | NA | 1.37 | NA | NA | 1.23 | NA | NA |
| Carvedilola | 6.25 mg, bid | NA | 1.19 | NA | NA | 1.13 | NA | NA |
| Carvedilolb | 6.25 mg, bid | NA | 1.57 | NA | NA | 1.36 | NA | NA |
| Conivaptan | 40 mg, bid | NA | 1.46 | NA | NA | 1.30 | NA | NA |
| Diltiazem | 60 mg, tid | NA | 1.41 | NA | NA | 1.27 | NA | NA |
| Felodipine | 10 mg, bid | NA | 1.19 | NA | NA | 1.13 | NA | NA |
| Itraconazole | 200 mg, qd | NA | 1.71 | NA | NA | 1.44 | NA | NA |
| Lopinavir/Ritonavir | 400/100 mg bid | NA | 1.92 | NA | NA | 1.55 | NA | NA |
| Mibefradil | 150 mg, qd | NA | 1.30 | NA | NA | 1.20 | NA | NA |
| Nifedipine | 10 mg, tid | NA | 1.25 | NA | NA | 1.16 | NA | NA |
| Ranolazine | 1000 mg, bid | NA | 1.61 | NA | NA | 1.39 | NA | NA |
| Ritonavir | 200 mg, bid | NA | 1.25 | NA | NA | 1.16 | NA | NA |
| Saquinavir/Ritonavir | 1000/100 mg, bid | NA | 1.51 | NA | NA | 1.33 | NA | NA |
| Telaprevir | 750 mg, tid | NA | 1.96 | NA | NA | 1.57 | NA | NA |
| Telmisartan | 120 mg, qd | NA | 1.19 | NA | NA | 1.13 | NA | NA |
| Ticagrelor | 400 mg, qd | NA | 1.25 | NA | NA | 1.16 | NA | NA |
| Tipranavir/Ritonavir | 500/200 mg, single | NA | 1.79 | NA | NA | 1.48 | NA | NA |
AUCR, the ratio of the area under the plasma concentration-time curve (AUC0→∞) in the presence and absence of the inhibitor; Cmax, R, the ratio of the peak concentration in the presence and absence of the inhibitor. qd, once daily; bid, twice daily, tid, three times a day; single, single dosing; multiple, multiple dosing; NA, not applicable.
Data for the female subjects.
data for the male subjects.
References (1), http://files.boehringer.com.au/files/PI/Pradaxa%20PI.pdf; (2), Delavenne et al., 2013; (3), Härtter et al., 2013.
Predicting the DDI risks between various P-gp inhibitors and DABE
The potential DDI risks between all the other reported P-gp inhibitors and DABE were predicted (Table 2). AUCR and Cmax, R of DAB ranged from 1.19–1.96 to 1.13–1.57 respectively (Table 2).
Discussion
The major finding of the present study is that ‘in vivo’ [I]/Ki can be used for the quantitative prediction of P-gp-mediated DDIs. Accurate prediction of P-gp-mediated DDIs (involving DABE) was achieved when the ‘in vivo’ [I]/Ki was used in combination with the PBPK modelling. The other finding is that exposure to DAB in humans is sensitive to P-gp inhibition. Identification of this class of DDIs is essential for the improvement in benefit-risk data for DABE, given the post-marketing reports of bleeding with the use of DABE (Southworth et al., 2013).
Currently, only one PBPK approach for the prediction of DDI between P-gp substrate (digoxin) and inhibitor (verapamil) has been reported (Neuhoff et al., 2013b). Our approach is simpler than the approach by Neuhoff et al. (2013b), which involved complex, dynamic DDI simulations, and metabolite inhibition potential was dynamically considered. Our prediction method can be seen as a special ‘static’ approach because the effective inhibitor concentration [I] is kept unchanged. However, unlike the usual static approach, our special ‘static’ method is still able to simulate the complete plasma concentration-time profile of the substrate drug in the presence of an inhibitor.
Simplicity has been the biggest challenge for the PBPK community to face: can such predictions be made without going through complex model building? In this study, we took a hybrid approach using substrate PBPK model and in vivo DDI data to define the [I]/Ki term for each inhibitor. There is, however, a simplified form of our approach. We can simply use the equation AUCR = 1 + [I]/Ki to calculate [I]/Ki, and then adjust [I]/Ki to compensate for the dose differences of this P-gp inhibitor before predicting the AUCR for DAB with the same equation. However, there is an important assumption underlying this simplified approach. For example, the relative contribution of P-gp-mediated clearance to total clearance is the same for the substrates in the learning set (digoxin) and the test drug (DABE). Therefore, our simplified approach can be used only if this assumption (about the contribution of P-gp to total clearance) is valid. If the assumption is known not to be valid or if we do not know if it is valid or not, then our hybrid approach can be used.
Although this approach accurately predicts the influence of five P-gp inhibitors on DABE pharmacokinetics, it will be of interest to extend the approach to the prediction of DDIs between other P-gp substrates and inhibitors. Fexofenadine is a typical P-gp substrate (Draft Guidance/Guidance for Industry 2012). There are four P-gp inhibitors (from 21 inhibitors in Table 2) that were reported to be able to interact with fexofenadine, for example, itraconazole, verapamil, ritonavir and lopinavir/ritonavir (Yasui-Furukori et al., 2005; Shimizu et al., 2006; van Heeswijk et al., 2006). However, fexofenadine is also an OATP substrate. The P-gp inhibitors verapamil, ritonavir and lopinavir/ritonavir are also able to inhibit OATP transporters (Cvetkovic et al., 1999). Therefore, only the DDI involving fexofenadine and itraconazole can be used to test our approach. The reported Cmax, R and AUCR of fexofenadine were 1.8 and 1.7 respectively (Shimizu et al., 2006). The predicted values were 1.4 and 2.2 respectively. This result suggests that our approach can be extended to the prediction of the DDIs between other P-gp substrates and inhibitors.
Regulatory authorities are increasingly focusing on the use of PBPK modelling during regulatory review (Zhao et al., 2011). Our newly developed approach was utilized to predict, with confidence, a large number of DDIs between DABE and various P-gp inhibitors that have not been studied. Based on these prediction results (Table 2), the potentially unfavourable exposure of real patients can be minimized, unnecessary clinical studies can be avoided and the study design of the clinical study can be optimized. Although [I]/Ki derived from this work may be platform-specific and would require re-parameterization when other platforms were to be used, the data of ‘in vivo’ [I]/Ki (Table 2) can serve as an important database for other researchers. According to a very recent study, the ‘in vivo’ inhibition potency of probenecid on renal secretion was derived using PBPK modelling (Hsu et al., 2013). The authors suggested that this in vivo data can be used to provide an initial estimate of AUCR values in the presence of probenecid.
In order to improve decision making in drug development and discovery, our approach can be used during the course of new drug development and discovery. If a new molecular entity is a substrate for P-gp and the PBPK model of this drug has already been established, the DDI between this drug and various P-gp inhibitors can be predicted. Our approach can reasonably exclude clinical DDI studies that later turn out to be unnecessary.
However there are limitations to the current study that need to be considered. The major challenge for the application of our approach is the accurate definition of the contribution of the P-gp transporter (to total PK) when a PBPK model for new molecular entity is being constructed. As in vivo clinical data were used to estimate the [I]/Ki value which was subsequently used for DAB, extrapolation outside the studied population and the conditions of the learning data set could sometimes not be justifiable. Care should be taken as the estimated parameter value might not hold in another population, with different ethnicities, P-gp genotypes or disease conditions.
In conclusion, ‘in vivo’ [I]/Ki and PBPK modelling can be used in combination for the quantitative prediction of P-gp-mediated DDIs. To our knowledge, this is the first proof-of-concept study demonstrating that ‘in vivo’ [I]/Ki is a useful parameter for the prediction of DDIs associated with P-gp substrates. The described general framework can be used in the course of new drug development to provide a mechanistic basis for proper design of clinical DDI studies, as well as avoiding unnecessary clinical DDI studies.
Acknowledgments
This study was not supported by any grant.
Glossary
- AUC0→∞
the AUC from time zero to infinity
- AUC0→t
the area under concentration-time curve up to the last measured time point
- AUCR
the ratio of the area under the plasma concentration-time curve (AUC0→∞) in the presence and absence of the inhibitor
- CLint
intrinsic clearance
- Cmax
peak plasma concentration
- Cmax, R
the ratio of the peak concentration in the presence and absence of the inhibitor
- CES
carboxylesterase
- DABE
dabigatran etexilate
- DDI
drug-drug interaction
- [I]
the effective inhibitor concentration
- OATP
organic anion-transporting polypeptide
- PBPK
physiologically based pharmacokinetic modelling
- P-gp
P-glycoprotein
- PK
pharmacokinetics
Conflict of interest
The authors declare no actual or potential conflicts of interest.
Supporting information
Additional Supporting Information may be found in the online version of this article at the publisher's web-site: http://dx.doi.org/10.1111/bph.12533
The data of the learning set for the calculation of the ‘in vivo’ [I]/Ki of various P-gp inhibitors, and Kmi values of dabigatran etexilate (DABE, Km,DABEi) in the presence of various P-gp inhibitors.
References
- Becquemont L, Verstuyft C, Kerb R, Brinkmann U, Lebot M, Jaillon P, et al. Effect of grapefruit juice on digoxin pharmacokinetics in humans. Clin Pharmacol Ther. 2001;70:311–316. [PubMed] [Google Scholar]
- Bentz J, O'Connor MP, Bednarczyk D, Coleman J, Lee C, Palm J, et al. Variability in P-glycoprotein inhibitory potency (IC50) using various in vitro experimental systems: implications for universal digoxin drug-drug interaction risk assessment decision criteria. Drug Metab Dispos. 2013;41:1347–1366. doi: 10.1124/dmd.112.050500. [DOI] [PMC free article] [PubMed] [Google Scholar]
- Bischoff KB, Dedrick RL, Zaharko DS, Longstreth JA. Methotrexate pharmacokinetics. J Pharm Sci. 1971;60:1128–1133. doi: 10.1002/jps.2600600803. [DOI] [PubMed] [Google Scholar]
- Blech S, Ebner T, Ludwig-Schwellinger E, Stangier J, Roth W. The metabolism and disposition of the oral direct thrombin inhibitor, dabigatran, in humans. Drug Metab Dispos. 2008;36:386–399. doi: 10.1124/dmd.107.019083. [DOI] [PubMed] [Google Scholar]
- Bradshaw-Pierce EL, Eckhardt SG, Gustafson DL. A physiologically based pharmacokinetic model of docetaxel disposition: from mouse to man. Clin Cancer Res. 2007;13:2768–2776. doi: 10.1158/1078-0432.CCR-06-2362. [DOI] [PubMed] [Google Scholar]
- Connolly SJ, Ezekowitz MD, Yusuf S, Eikelboom J, Oldgren J, Parekh A, et al. Dabigatran versus warfarin in patients with atrial fibrillation. N Engl J Med. 2009;361:1139–1151. doi: 10.1056/NEJMoa0905561. [DOI] [PubMed] [Google Scholar]
- Cvetkovic M, Leake B, Fromm MF, Wilkinson GR, Kim RB. OATP and P-glycoprotein transporters mediate the cellular uptake and excretion of fexofenadine. Drug Metab Dispos. 1999;27:866–871. [PubMed] [Google Scholar]
- Delavenne X, Ollier E, Basset T, Bertoletti L, Accassat S, Garcin A, et al. A semi-mechanistic absorption model to evaluate drug-drug interaction with dabigatran: application with clarithromycin. Br J Clin Pharmacol. 2013;76:107–113. doi: 10.1111/bcp.12055. [DOI] [PMC free article] [PubMed] [Google Scholar]
- Ding R, Tayrouz Y, Riedel KD, Burhenne J, Weiss J, Mikus G, et al. Substantial pharmacokinetic interaction between digoxin and ritonavir in healthy volunteers. Clin Pharmacol Ther. 2004;76:73–84. doi: 10.1016/j.clpt.2004.02.008. [DOI] [PubMed] [Google Scholar]
- Draft Guidance/Guidance for Industry. 2012. Drug interaction studies–study Design, data analysis, implications for dosing, and labeling recommendations. Available at: http://www.fda.gov/downloads/Drugs/GuidanceComplianceRegulatoryInformation/Guidances/UCM292362.pdf (11/18/2013)
- Eckermann G, Lahu G, Nassr N, Bethke TD. Absence of pharmacokinetic interaction between roflumilast and digoxin in healthy adults. J Clin Pharmacol. 2012;52:251–257. doi: 10.1177/0091270010389467. [DOI] [PubMed] [Google Scholar]
- Ellens H, Deng S, Coleman J, Bentz J, Taub ME, Ragueneau-Majlessi I, et al. Application of receiver operating characteristic analysis to refine the prediction of potential digoxin drug interactions. Drug Metab Dispos. 2013;41:1367–1374. doi: 10.1124/dmd.112.050542. [DOI] [PMC free article] [PubMed] [Google Scholar]
- Fenner KS, Troutman MD, Kempshall S, Cook JA, Ware JA, Smith DA, et al. Drug-drug interactions mediated through P-glycoprotein: clinical relevance and in vitro-in vivo correlation using digoxin as a probe drug. Clin Pharmacol Ther. 2009;85:173–181. doi: 10.1038/clpt.2008.195. [DOI] [PubMed] [Google Scholar]
- Greiner B, Eichelbaum M, Fritz P, Kreichgauer HP, von Richter O, Zundler J, et al. The role of intestinal P-glycoprotein in the interaction of digoxin and rifampin. J Clin Invest. 1999;104:147–153. doi: 10.1172/JCI6663. [DOI] [PMC free article] [PubMed] [Google Scholar]
- Härtter S, Koenen-Bergmann M, Sharma A, Nehmiz G, Lemke U, Timmer W, et al. Decrease in the oral bioavailability of dabigatran etexilate after co-medication with rifampicin. Br J Clin Pharmacol. 2012;74:490–500. doi: 10.1111/j.1365-2125.2012.04218.x. [DOI] [PMC free article] [PubMed] [Google Scholar]
- Härtter S, Sennewald R, Nehmiz G, Reilly P. Oral bioavailability of dabigatran etexilate (Pradaxa(®)) after co-medication with verapamil in healthy subjects. Br J Clin Pharmacol. 2013;75:1053–1062. doi: 10.1111/j.1365-2125.2012.04453.x. [DOI] [PMC free article] [PubMed] [Google Scholar]
- van Heeswijk RP, Bourbeau M, Campbell P, Seguin I, Chauhan BM, Foster BC, et al. Time-dependent interaction between lopinavir/ritonavir and fexofenadine. J Clin Pharmacol. 2006;46:758–767. doi: 10.1177/0091270006288733. [DOI] [PubMed] [Google Scholar]
- Hsu V, de L T Vieira M, Zhao P, Zhang L, Zheng JH, Nordmark A, et al. Towards quantitation of the effects of renal impairment and probenecid inhibition on kidney uptake and efflux transporters, using physiologically based pharmacokinetic modelling and simulations. Clin Pharmacokinet. 2013 doi: 10.1007/s40262-013-0117-y. doi: 10.1007/s40262-013-0117-y. (in press) [DOI] [PMC free article] [PubMed] [Google Scholar]
- Hu ZY. Disposition pathway-dependent approach for predicting organic anion-transporting polypeptide-mediated drug-drug interactions. Clin Pharmacokinet. 2013;52:433–441. doi: 10.1007/s40262-013-0045-x. [DOI] [PubMed] [Google Scholar]
- Hu ZY, Parker RB, Laizure SC. In vivo information-guided prediction approach for assessing the risks of drug-drug interactions associated with circulating inhibitory metabolites. Drug Metab Dispos. 2012;40:1487–1494. doi: 10.1124/dmd.112.045799. [DOI] [PMC free article] [PubMed] [Google Scholar]
- Hu ZY, Parker RB, Herring VL, Laizure SC. Conventional liquid chromatography/triple quadrupole mass spectrometry based metabolite identification and semi-quantitative estimation approach in the investigation of in vitro dabigatran etexilate metabolism. Anal Bioanal Chem. 2013;405:1695–1704. doi: 10.1007/s00216-012-6576-4. [DOI] [PMC free article] [PubMed] [Google Scholar]
- Kramer WG, Kolibash AJ, Lewis RP, Bathala MS, Visconti JA, Reuning RH. Pharmacokinetics of digoxin: relationship between response intensity and predicted compartmental drug levels in man. J Pharmacokinet Biopharm. 1979;7:47–61. doi: 10.1007/BF01059440. [DOI] [PubMed] [Google Scholar]
- Laizure SC, Parker RB, Herring VL, Hu ZY. Identification of carboxylesterase-dependent dabigatran etexilate hydrolysis. Drug Metab Dispos. 2013 doi: 10.1124/dmd.113.054353. doi: 10.1124/dmd.113.054353. (in press) [DOI] [PMC free article] [PubMed] [Google Scholar]
- Meyer M, Schneckener S, Ludewig B, Kuepfer L, Lippert J. Using expression data for quantification of active processes in physiologically based pharmacokinetic modeling. Drug Metab Dispos. 2012;40:892–901. doi: 10.1124/dmd.111.043174. [DOI] [PubMed] [Google Scholar]
- Neuhoff S, Yeo KR, Barter Z, Jamei M, Turner DB, Rostami-Hodjegan A. Application of permeability-limited physiologically-based pharmacokinetic models: Part I-digoxin pharmacokinetics incorporating P-glycoprotein-mediated efflux. J Pharm Sci. 2013a;102:3145–3160. doi: 10.1002/jps.23594. [DOI] [PubMed] [Google Scholar]
- Neuhoff S, Yeo KR, Barter Z, Jamei M, Turner DB, Rostami-Hodjegan A. Application of permeability-limited physiologically-based pharmacokinetic models: Part II-prediction of p-glycoprotein mediated drug-drug interactions with digoxin. J Pharm Sci. 2013b;102:3161–3173. doi: 10.1002/jps.23607. [DOI] [PubMed] [Google Scholar]
- Oosterhuis B, Jonkman JH, Andersson T, Zuiderwijk PB, Jedema JN. Minor effect of multiple dose omeprazole on the pharmacokinetics of digoxin after a single oral dose. Br J Clin Pharmacol. 1991;32:569–572. doi: 10.1111/j.1365-2125.1991.tb03953.x. [DOI] [PMC free article] [PubMed] [Google Scholar]
- Ragueneau I, Poirier JM, Radembino N, Sao AB, Funck-Brentano C, Jaillon P. Pharmacokinetic and pharmacodynamic drug interactions between digoxin and macrogol 4000, a laxative polymer, in healthy volunteers. Br J Clin Pharmacol. 1999;48:453–456. doi: 10.1046/j.1365-2125.1999.00025.x. [DOI] [PMC free article] [PubMed] [Google Scholar]
- Rodgers T, Rowland M. Physiologically based pharmacokinetic modelling 2: predicting the tissue distribution of acids, very weak bases, neutrals and zwitterions. J Pharm Sci. 2006;95:1238–1257. doi: 10.1002/jps.20502. [DOI] [PubMed] [Google Scholar]
- Rodgers T, Rowland M. Mechanistic approaches to volume of distribution predictions: understanding the processes. Pharm Res. 2007;24:918–933. doi: 10.1007/s11095-006-9210-3. [DOI] [PubMed] [Google Scholar]
- Rodgers T, Leahy D, Rowland M. Physiologically based pharmacokinetic modeling 1: predicting the tissue distribution of moderate-to-strong bases. J Pharm Sci. 2005;94:1259–1276. doi: 10.1002/jps.20322. [DOI] [PubMed] [Google Scholar]
- Rodin SM, Johnson BF, Wilson J, Ritchie P, Johnson J. Comparative effects of verapamil and isradipine on steady-state digoxin kinetics. Clin Pharmacol Ther. 1988;43:668–672. doi: 10.1038/clpt.1988.93. [DOI] [PubMed] [Google Scholar]
- Rowland M, Matin SB. Kinetics of drug-drug interactions. J Pharmacokinet Biopharm. 1973;1:553–567. [Google Scholar]
- Shimizu M, Uno T, Sugawara K, Tateishi T. Effects of single and multiple doses of itraconazole on the pharmacokinetics of fexofenadine, a substrate of P-glycoprotein. Br J Clin Pharmacol. 2006;62:372–376. doi: 10.1111/j.1365-2125.2006.02689.x. [DOI] [PMC free article] [PubMed] [Google Scholar]
- Southworth MR, Reichman ME, Unger EF. Dabigatran and postmarketing reports of bleeding. N Engl J Med. 2013;368:1272–1274. doi: 10.1056/NEJMp1302834. [DOI] [PubMed] [Google Scholar]
- Stangier J. Clinical pharmacokinetics and pharmacodynamics of the oral direct thrombin inhibitor dabigatran etexilate. Clin Pharmacokinet. 2008;47:285–295. doi: 10.2165/00003088-200847050-00001. [DOI] [PubMed] [Google Scholar]
- Stangier J, Rathgen K, Stähle H, Gansser D, Roth W. The pharmacokinetics, pharmacodynamics and tolerability of dabigatran etexilate, a new oral direct thrombin inhibitor, in healthy male subjects. Br J Clin Pharmacol. 2007;64:292–303. doi: 10.1111/j.1365-2125.2007.02899.x. [DOI] [PMC free article] [PubMed] [Google Scholar]
- Stangier J, Stähle H, Rathgen K, Roth W, Shakeri-Nejad K. Pharmacokinetics and pharmacodynamics of dabigatran etexilate, an oral direct thrombin inhibitor, are not affected by moderate hepatic impairment. J Clin Pharmacol. 2008;48:1411–1419. doi: 10.1177/0091270008324179. [DOI] [PubMed] [Google Scholar]
- Stangier J, Stähle H, Rathgen K, Roth W, Reseski K, Körnicke T. Pharmacokinetics and pharmacodynamics of dabigatran etexilate, an oral direct thrombin inhibitor, with coadministration of digoxin. J Clin Pharmacol. 2012;52:243–250. doi: 10.1177/0091270010393342. [DOI] [PubMed] [Google Scholar]
- Tateishi T, Miura M, Suzuki T, Uno T. The different effects of itraconazole on the pharmacokinetics of fexofenadine enantiomers. Br J Clin Pharmacol. 2008;65:693–700. doi: 10.1111/j.1365-2125.2008.03116.x. [DOI] [PMC free article] [PubMed] [Google Scholar]
- Thelen K, Coboeken K, Willmann S, Burghaus R, Dressman JB, Lippert J. Evolution of a detailed physiological model to simulate the gastrointestinal transit and absorption process in humans, part 1: oral solutions. J Pharm Sci. 2011;100:5324–5345. doi: 10.1002/jps.22726. [DOI] [PubMed] [Google Scholar]
- Thelen K, Coboeken K, Willmann S, Dressman JB, Lippert J. Evolution of a detailed physiological model to simulate the gastrointestinal transit and absorption process in humans, part II: extension to describe performance of solid dosage forms. J Pharm Sci. 2012;101:1267–1280. doi: 10.1002/jps.22825. [DOI] [PubMed] [Google Scholar]
- Vaidyanathan S, Camenisch G, Schuetz H, Reynolds C, Yeh CM, Bizot MN, et al. Pharmacokinetics of the oral direct renin inhibitor aliskiren in combination with digoxin, atorvastatin, and ketoconazole in healthy subjects: the role of P-glycoprotein in the disposition of aliskiren. J Clin Pharmacol. 2008;48:1323–1338. doi: 10.1177/0091270008323258. [DOI] [PubMed] [Google Scholar]
- Verstuyft C, Strabach S, El-Morabet H, Kerb R, Brinkmann U, Dubert L, et al. Dipyridamole enhances digoxin bioavailability via P-glycoprotein inhibition. Clin Pharmacol Ther. 2003;73:51–60. doi: 10.1067/mcp.2003.8. [DOI] [PubMed] [Google Scholar]
- Weiss M. Mechanistic modeling of digoxin distribution kinetics incorporating slow tissue binding. Eur J Pharm Sci. 2007;30:256–263. doi: 10.1016/j.ejps.2006.11.012. [DOI] [PubMed] [Google Scholar]
- Westphal K, Weinbrenner A, Giessmann T, Stuhr M, Franke G, Zschiesche M, et al. Oral bioavailability of digoxin is enhanced by talinolol: evidence for involvement of intestinal P-glycoprotein. Clin Pharmacol Ther. 2000;68:6–12. doi: 10.1067/mcp.2000.107579. [DOI] [PubMed] [Google Scholar]
- Yasui-Furukori N, Uno T, Sugawara K, Tateishi T. Different effects of three transporting inhibitors, verapamil, cimetidine, and probenecid, on fexofenadine pharmacokinetics. Clin Pharmacol Ther. 2005;77:17–23. doi: 10.1016/j.clpt.2004.08.026. [DOI] [PubMed] [Google Scholar]
- Zhao P, Zhang L, Grillo JA, Liu Q, Bullock JM, Moon YJ, et al. Applications of physiologically based pharmacokinetic (PBPK) modeling and simulation during regulatory review. Clin Pharmacol Ther. 2011;89:259–267. doi: 10.1038/clpt.2010.298. [DOI] [PubMed] [Google Scholar]
Associated Data
This section collects any data citations, data availability statements, or supplementary materials included in this article.
Supplementary Materials
The data of the learning set for the calculation of the ‘in vivo’ [I]/Ki of various P-gp inhibitors, and Kmi values of dabigatran etexilate (DABE, Km,DABEi) in the presence of various P-gp inhibitors.