Abstract
In this study, we have shown the potential of a voxel-based analysis for imaging amyloid plaques and its utility in monitoring therapeutic response in Alzheimer’s disease (AD) mice using manganese oxide nanoparticles conjugated with an antibody of Aβ1-40 peptide (HMON-abAβ40). T1-weighted MR brain images of a drug-treated AD group (n=7), a nontreated AD group (n=7), and a wild-type group (n=7) were acquired using a 7.0 T MRI system before (D−1), 24-h (D+1) after, and 72-h (D+3) after injection with an HMON-abAβ40 contrast agent. For the treatment of AD mice, DAPT was injected intramuscularly into AD transgenic mice (50 mg/kg of body weight). For voxel-based analysis, the skull-stripped mouse brain images were spatially normalized, and these voxels’ intensities were corrected to reduce voxel intensity differences across scans in different mice. Statistical analysis showed higher normalized MR signal intensity in the frontal cortex and hippocampus of AD mice over wild-type mice on D+1 and D+3 (P<0.01, uncorrected for multiple comparisons). After the treatment of AD mice, the normalized MR signal intensity in the frontal cortex and hippocampus decreased significantly in comparison with nontreated AD mice on D+1 and D+3 (P<0.01, uncorrected for multiple comparisons). These results were confirmed by histological analysis using a thioflavin staining. This unique strategy allows us to detect brain regions that are subjected to amyloid plaque deposition and has the potential for human applications in monitoring therapeutic response for drug development in AD.
Keywords: Alzheimer’s disease, amyloid plaque, hollow manganese oxide nanoparticles, magnetic resonance imaging, therapeutic response
Introduction
The extracellular accumulation of amyloid β (Aβ) peptides is one of the pathological causes of Alzheimer’s disease (AD) 1. According to the amyloid cascade hypothesis, Aβ aggregation with amyloid plaques is the central event, ultimately leading to the formation of neurofibrillary tangles, cortical atrophy, and dementia 2,3. Advanced research has led to therapeutic approaches for AD aimed at decreasing amyloid plaques using inhibitors of Aβ aggregation 4,5. Despite immense efforts to develop therapeutics to treat AD, among the few candidates that have been suggested in phase I trials 6, none have been successful in being approved for the treatment of AD as of yet. Most recent studies have tested the efficacy of antibiotic drug treatments to stop or slow progression to AD in patients with mid-stage cognitive impairment, but there have been no proven treatments for mild cognitive impairment 7,8.
To assess treatment response for AD, histological analysis is carried out routinely to examine patterns of amyloid plaques and compare drug-treated and nontreated groups in clinical and preclinical studies 5,6. These assessment approaches can take extensively long times to advance drug development in AD because of the inherent nature of postmortem analysis especially in clinical trials. Thus, imaging technology for detection of amyloid plaques in vivo is urgently needed for effective and rapid drug development in AD.
Recent advanced imaging technology using MRI has turned amyloid plaque imaging in AD into a rapidly evolving field in neuroimaging for clinical and preclinical research 9–14. Previous researchers have developed MRI techniques to detect amyloid plaques in vivo without using contrast agents based on intrinsic T2 or T2* contrast because of iron deposits from amyloid plaques 9–11. Several groups have combined MRI techniques with molecular imaging techniques to identify amyloid plaques in vivo using contrast agents conjugated to amyloid targeting ligands 12,13.
In our previous work, we showed that hollow manganese oxide nanoparticles conjugated to antibodies of the Aβ40 peptide (HMON-abAβ40) accumulated and bound successfully to amyloid plaques, appearing as a hyperenhanced signal on T1-weighted MR images 14. In the continuing work of this report, we propose a voxel-based analysis of HMON-abAβ40-enhanced MR images not only for detecting amyloid plaques but also for monitoring therapeutic response in AD transgenic mice. We hypothesize that a higher MR signal intensity is observed in amyloid plaque deposits and response to therapeutics can be monitored by a reduction in MR signal intensity enhancement. We tested our proposed voxel-based method using wild-type (WT), AD, and drug-treated AD mice.
Methods
Animals
APP/PS1 transgenic mice (female, n=14) and nontransgenic littermates (female, n=7) were used for this study, APP/PS1 transgenic mice being divided into two groups: a drug-treated group (female, n=7) and an untreated control group (female, n=7). Eight-week-old APP/PS1 transgenic mice were purchased from Jackson Laboratory (stock #004462; Bar Harbor, Maine, USA). These mice were maintained as double hemizygotes by crossing them with WT individuals from a C57BL/6J F1 background strain (Jackson Laboratory). Offspring were genotyped for the presence of the transgene by PCR amplification of genomic DNA extracted from tail biopsies. Because mice were needed for in-vivo amyloid plaque imaging using MRI around 1 year of age, they were housed in a specific pathogen-free animal facility with free access to food and water for about 13 months. All animal work was carried out according to a protocol approved by the Institutional Animal Care and Use Committee of an Association for Assessment and Accreditation of Laboratory Animal Care International accredited facility and abided by the Institute of Laboratory Animal Resources guide.
DAPT (N-[N-(3,5-difluorophenacetyl)-l-alanyl]-S-phenyl glycine t-butyl ester) (Sigma-Aldrich, St. Louis, Missouri, USA), used widely in the study using AD mice as a therapeutic drug compound, is a γ-secretase inhibitor used to decrease the production of Aβ 5. For the treatment of AD mice, DAPT was prepared as a suspension in a vehicle [10% absolute ethyl alcohol (v/v), and 90% corn oil] for intramuscular injection to rats. In the drug-treated group (n=7), rats were treated daily with DAPT with a dose of 50 mg/kg (1.5 mg/0.2 ml) of body weight. MRI experiments were conducted 3 h after an intramuscular injection of DAPT.
Magnetic resonance imaging acquisition
For MRI experiments, mice were placed under anesthesia with 1–2% isoflurane in a mixture of O2 and N2 gases (3 : 7) delivered to a nosecone for spontaneous respiration. The body temperature was maintained at 36°C±1 using a heating pad while monitoring mouse physiology. MRI data were obtained using a 7.0 T MRI scanner equipped with 400-mT/m actively shielded gradients with 100-μs rise times (Bruker Biospin GmbH, Ettlingen, Germany). A birdcage coil (72 mm i.d.) (Bruker Biospin, Fallanden, Switzerland) was used for excitation and an actively decoupled phased array coil was used for receiving the signal. MR images were obtained using a three-dimensional rapid acquisition with a relaxation enhancement sequence with the following imaging parameters: TR=200 ms; TE=7.5 ms; matrix=145×256×115; and resolution=100×100×100 μm3. The total acquisition time for each image was 111 min. For each mouse, baseline images (D−1) were obtained before the injection of contrast agent. The contrast-enhanced MR images were obtained at 24-h (D+1) and 72-h (D+3) after injection. The day of injection with the contrast agent was denoted as D+0.
Magnetic resonance imaging contrast agent
HMON-abAβ40 was used to target amyloid plaques in the APP/PS1 transgenic mouse brain 14. For the administration of MRI contrast agent, the mouse was anesthetized and the head of the mouse was fixed carefully using a bite/ear bar on a stereotaxic frame. To maintain a steady temperature, a heating pad was used during the procedure. The HMON-abAβ40 was injected percutaneously into the cisterna magna using a 31-G needle at a rate of 1 μl/min (8 μl).
Magnetic resonance image analysis
The brain skull was removed by manually drawing the brain region for all images. A spatial normalization was performed to ensure voxels’ correspondence between different mice for voxel-based analysis. We used a time-specific mouse template at D−1, D+1, and D+3, which was computed from the 14 mouse MR images in our previous study 14. The skull-stripped mouse brain images were spatially normalized to the time-specific mouse templates to avoid registration error induced by the time-specific enhancement of the contrast agent.
To correct the voxels’ intensity differences across scans obtained in different mice for the same time point, the voxel intensity of each scan image was normalized 15. This intensity normalization procedure was performed on the spatially normalized images for all mice. First, all spatially normalized images from 21 mice for each time point were averaged to create time-specific average images for each time point. Second, individual images from the same time point were scaled to the global mean intensity of the time-specific average image and renormalized to time-specific average images using a stochastic algorithm 16. Stochastic normalization aims to normalize the mean of Gaussian noise in the intensity by maximizing the crossings of the noise fluctuations on the one image with the time-specific average image 17.
Histology
For staining amyloid plaques, mice were killed after MRI. Each mouse was perfused and its brain was removed for fixation for 24 h. For thioflavin-S staining, the brain sections were mounted on slides and stained with fresh filtered aqueous 1% thioflavin-S solution. The thioflavin-S-positive amyloid plaques were visualized under a fluorescence microscope.
Statistical analysis
We carried out the Mann–Whitney U-test in a voxel-by-voxel manner to assess the difference of voxels’ normalized intensity between the two groups. Statistical significance for an individual voxel was assumed at P value less than 0.01 (uncorrected for multiple comparisons) with a minimum cluster size of 50 voxels.
Results
Figure 1 shows an intensity distribution across the voxels of the whole brain mouse before and after intensity normalization processing on D−1, D+1, and D+3. We found the between-subject variability in MR signal intensity from 21 mice (Fig. 1a). This between-subject variability was reduced after intensity normalization processing (Fig. 1b). Figure 2 shows the statistical group difference maps between AD and WT mice on D−1, D+1, and D+3 (P<0.01, uncorrected for multiple comparisons). We did not find any significant changes between the normalized MR signal intensities between AD and WT mice on D−1 (Fig. 2a). After the injection of HMON-abAβ40, we found a higher normalized MR signal intensity in the left and right frontal cortex and the left and right hippocampus of AD mice than WT mice on D+1 (Fig. 2b). We also found higher normalized MR signal intensity in the right frontal cortex and the right hippocampus of AD mice than WT mice on D+3 (Fig. 2c). There were no significantly higher voxels in WT mice than AD mice on D−1, D+1, and D+3. Figure 3 shows statistical group difference maps between nontreated and drug-treated AD mice on D−1, D+1, and D+3 (P<0.01, uncorrected for multiple comparisons). There were no significant changes between nontreated and treated AD mice on D−1 (Fig. 3a). We found higher normalized MR signal intensity in the left and right frontal cortex and the right hippocampus in nontreated AD mice in comparison with drug-treated AD mice on D+1 (Fig. 3b). We also found higher normalized MR signal intensity in the left and right frontal cortex as well as the left and right hippocampus in nontreated AD mice when compared with drug-treated AD mice on D+3 (Fig. 3c). There were no voxels significantly higher in drug-treated AD mice than in nontreated AD mice on D−1, D+1, and D+3. We constructed overlapped maps from two statistical difference maps (AD vs. WT and AD vs. drug-treated AD) to test whether the hyperenhanced voxels in AD mice correspond to the hypoenhanced voxels after the treatment of AD mice on D+1 and D+3 (Fig. 4). We found that the intensity of the hyperenhanced voxels, detected by comparing between AD and WT mice, was significantly reduced to a level comparable with WT mice in specific brain regions of the frontal cortex after the treatment of AD mice. These changes were confirmed by thioflavin staining. In a representative WT mouse, there were no amyloid plaques in any brain regions (Fig. 5a), whereas in a representative AD mouse we found small clustered amyloid plaques as bright spots in the frontal cortex and the hippocampus (Fig. 5b). After the treatment of AD mice, the number of these amyloid plaques was reduced (Fig. 5c).
Fig. 1.
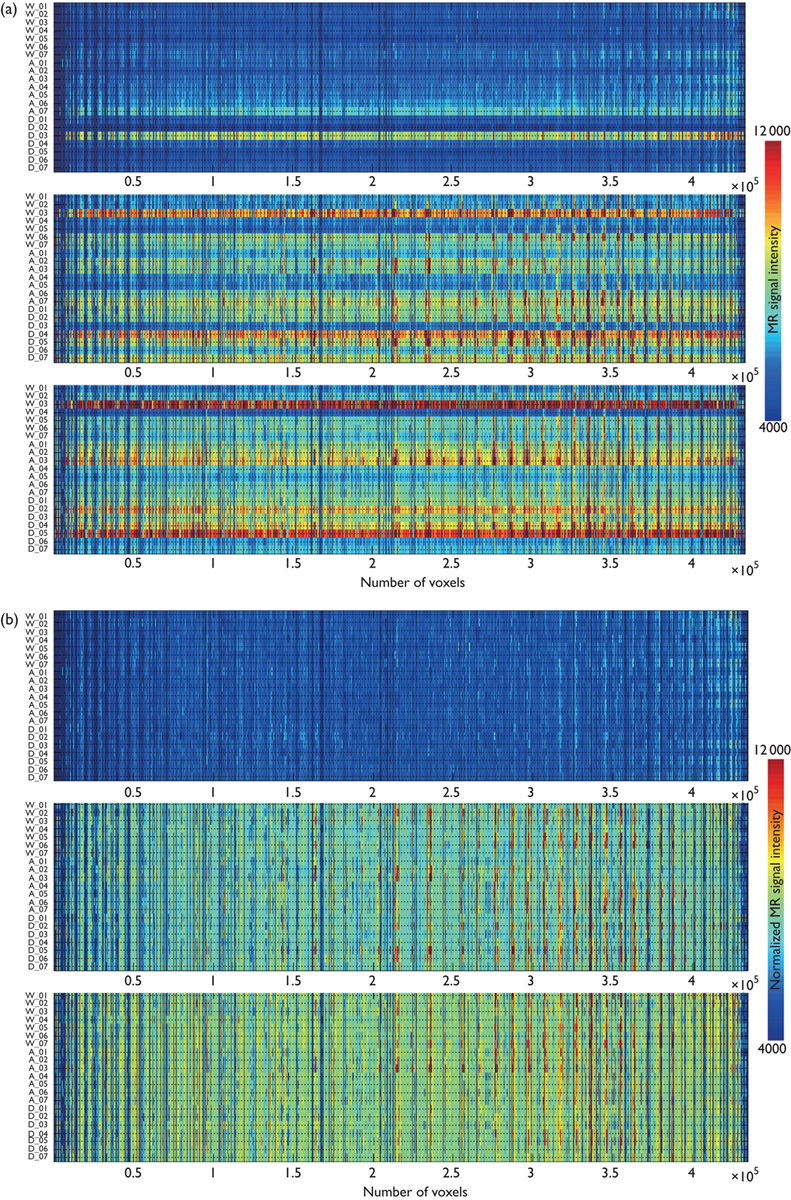
The voxels’ MR signal intensity across the whole brain area for 21 mice before (a) and after (b) intensity normalization processing on D−1, D+1, and D+3.
Fig. 2.
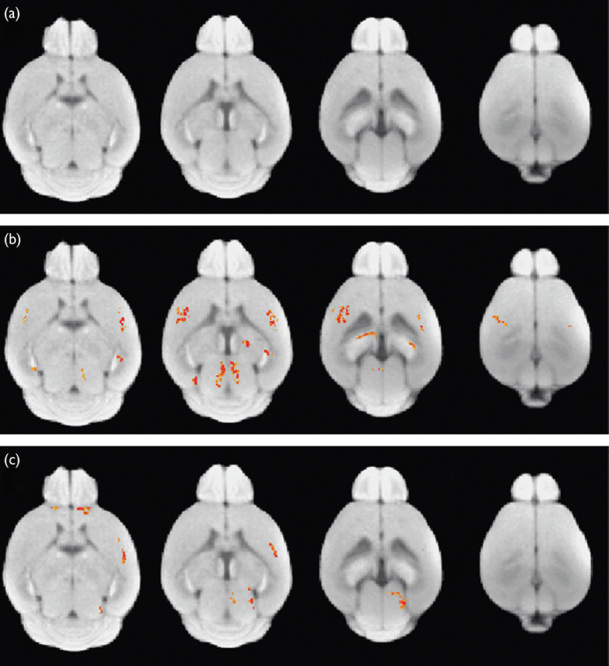
Statistical group difference maps between wild-type (WT) and Alzheimer’s disease (AD) mice on D−1 (a), D+1 (b), and D+3 (c). Statistically significant voxels are shown in red (AD>WT) at P<0.01 (uncorrected multiple comparison).
Fig. 3.
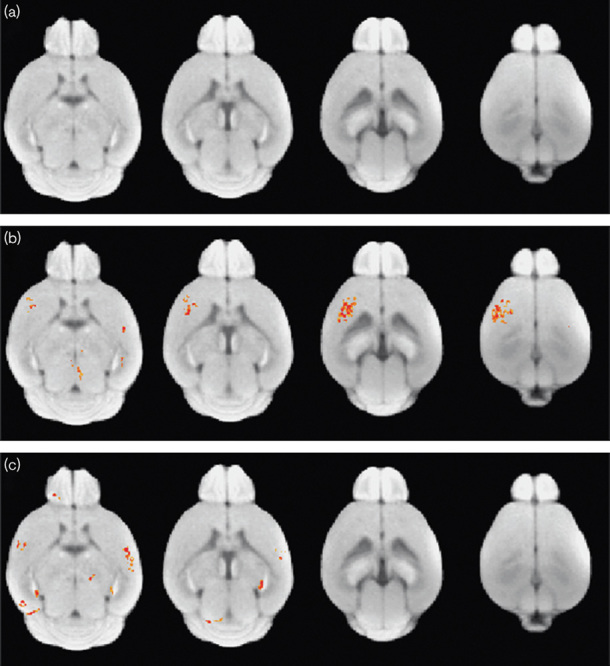
Statistical group difference maps between Alzheimer’s disease (AD) and drug-treated AD mice on D−1 (a), D+1 (b), and D+3 (c). Statistically significant voxels are shown in red (AD>drug-treated AD) at P<0.01 (uncorrected multiple comparison).
Fig. 4.
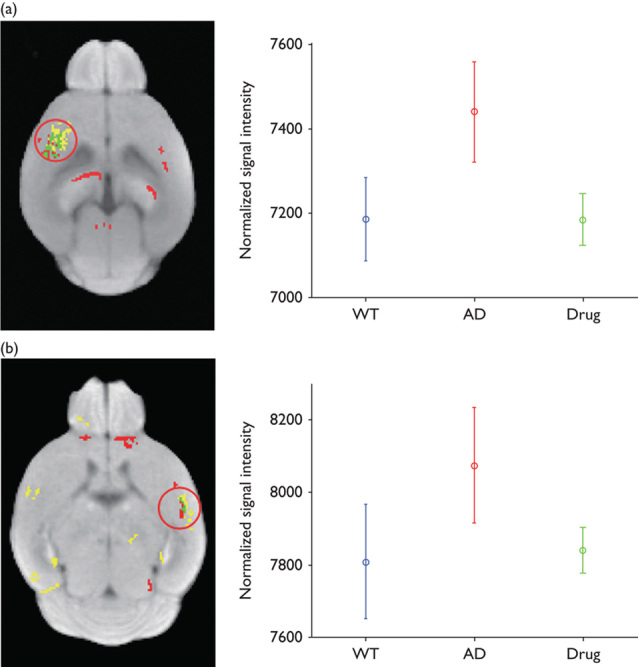
Overlapped brain areas of group difference maps, which are detected in Figs 2 and 3 on D+1 (a) and D+3 (b). Red voxels represent statistically different brain areas in Fig. 2. Yellow voxels represent statistically different brain areas in Fig. 3. Green voxels represent overlapped brain areas from Figs 2 and 3. In the right panels, the plots shows the mean and SD of voxels’ normalized signal intensity, which belong to a red circle in the left panels. AD, Alzheimer’s disease; WT, wild-type.
Fig. 5.
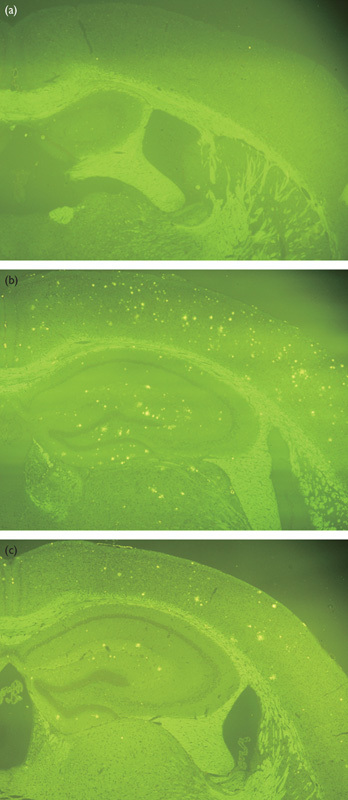
Thioflavin-S staining of representative wild-type (a), Alzheimer’s disease (AD) (b), and drug-treated AD (c) mice.
Discussion
In our previous study, we showed the feasibility of using HMON-abAβ40 for detecting amyloid plaques in AD transgenic mice using a region of interest-based approach 14. In the current study, we propose a voxel-based approach for both detecting amyloid plaques and monitoring therapeutic response, and the potential usefulness of this method was tested using WT, AD, and drug-treated AD mice. These results were confirmed by thioflavin-S staining.
Previous studies showed voxel-based analysis of amyloid plaques using PET 18 and MRI 13,19 in AD mouse models, which mostly focused on detecting amyloid plaques in the comparison of WT and AD mice. We showed the feasibility of our voxel-based method as a noninvasive imaging tool for detecting amyloid plaques to show the regional differences between WT and AD mice in the cerebral cortex and the hippocampus on D+1 and D+3 and to evaluate the effects of therapeutic drugs by comparing AD and drug-treated AD mice. The overlapped maps showed that specific cerebral cortex regions, detected by comparing WT and AD mice, correspond to those that show differences in comparing nontreated AD and drug-treated AD mice.
In our experiment, we found that the spatial enhancement patterns of contrast agent in the mouse brain were similar among mice, but the enhancement amplitudes of the contrast agent were variable among mice after the direct injection of our contrast agent into the cisterna magna. In Fig. 1a, for example, some mice (i.e. W_03, and D_04) had higher intensity values over the whole brain than other mice. After intensity normalization processing, these mice had intensity values similar to those of other mice. Their spatial enhancement patterns were also similar to other mice as shown in Fig. 1b. Thus, to reduce the variability of enhancement amplitudes between mice, we performed global intensity normalization processing before statistical group analysis.
For statistical group analysis, the determination of optimal threshold value has been a major problem in reducing the rate of false positives and false negatives 20. If a low threshold value is chosen, a large extent of brain regions shows significance accompanied by an increase in false-positive voxels. In this paper, we chose an optimal threshold value of 0.01, eliminating any significant difference between WT, AD, and drug-treated AD on D−1 (before the injection of contrast agent).
HMON was developed as a theranostic MRI agent with the abilities of diagnostic imaging and capabilities of delivering therapeutic agents 21. We showed previously the potential usefulness of HMON conjugated with an antibody for diagnostic imaging for targeting specific tumor cells in vivo 22 and for targeting amyloid plaques in vivo 14. In this work, we showed the feasibility of our voxel-based method in using the HMON-abAβ40 contrast agent as a noninvasive monitoring tool for evaluation of the therapeutic response of a potential drug for AD.
Conclusion
We showed the potential of a voxel-based analysis for imaging amyloid plaques and for monitoring therapeutic response in AD mice using HMON-abAβ40 as a molecular imaging probe. This method allows us to evaluate regional differences in amyloid plaques accumulation in the AD mouse brain, which can be very useful for drug development in AD. The current study also suggests that, combined with drug loading in HMON or HMON-abAβ40, our proposed voxel-based method can lead to new applications for the theranostic research field in AD.
Acknowledgements
This work was supported by the Basic Science Research Program through the National Research Foundation of Korea (NRF) funded by the Ministry of Education, Science, and Technology (2011-0031520).
Conflicts of interest
There are no conflicts of interest.
Footnotes
Correspondence to Jung Hee Lee, PhD, Department of Radiology, Samsung Medical Center, Sungkyunkwan University School of Medicine, Seoul 135-710, Korea Tel: +82 2 3410 6459; fax: +82 2 3410 0084; e-mail: hijunghee@skku.edu
References
- 1.Selkoe DJ.Clearing the brain’s amyloid cobwebs.Neuron 2001;32:177–180 [DOI] [PubMed] [Google Scholar]
- 2.Hardy J, Allsop D.Amyloid deposition as the central event in the aetiology of Alzheimer’s disease.Trends Pharmacol Sci 1991;12:383–388 [DOI] [PubMed] [Google Scholar]
- 3.Blennow K, de Leon MJ, Zetterberg H.Alzheimer’s disease.Lancet 2006;368:387–403 [DOI] [PubMed] [Google Scholar]
- 4.Blennow K.Biomarkers in Alzheimer’s disease drug development.Nat Med 2010;16:1218–1222 [DOI] [PubMed] [Google Scholar]
- 5.Lanz TA, Himes CS, Pallante G, Adams L, Yamazaki S, Amore B, et al. The gamma-secretase inhibitor N-[N-(3,5-difluorophenacetyl)-L-alanyl]-S-phenylglycine t-butyl ester reduces A beta levels in vivo in plasma and cerebrospinal fluid in young (plaque-free) and aged (plaque-bearing) Tg2576 mice.J Pharmacol Exp Ther 2003;305:864–871 [DOI] [PubMed] [Google Scholar]
- 6.Holmes C, Boche D, Wilkinson D, Yadegarfar G, Hopkins V, Bayer A, et al. Long-term effects of Abeta42 immunisation in Alzheimer’s disease: follow-up of a randomised, placebo-controlled phase I trial.Lancet 2008;372:216–223 [DOI] [PubMed] [Google Scholar]
- 7.Feldman HH, Ferris S, Winblad B, Sfikas N, Mancione L, He Y, et al. Effect of rivastigmine on delay to diagnosis of Alzheimer’s disease from mild cognitive impairment: the InDDEx study.Lancet Neurol 2007;6:501–512 [DOI] [PubMed] [Google Scholar]
- 8.Birks J, Flicker L.Donepezil for mild cognitive impairment.Cochrane Database Syst Rev 2006;19:CD006104. [DOI] [PubMed] [Google Scholar]
- 9.Benveniste H, Einstein G, Kim KR, Hulette C, Johnson GA.Detection of neuritic plaques in Alzheimer’s disease by magnetic resonance microscopy.Proc Natl Acad Sci USA 1999;96:14079–14084 [DOI] [PMC free article] [PubMed] [Google Scholar]
- 10.Helpern JA, Lee SP, Falangola MF, Dyakin VV, Bogart A, Ardekani B, et al. MRI assessment of neuropathology in a transgenic mouse model of Alzheimer’s disease.Magn Reson Med 2004;51:794–798 [DOI] [PubMed] [Google Scholar]
- 11.Jack CR, Jr, Garwood M, Wengenack TM, Borowski B, Curran GL, Lin J, et al. In vivo visualization of Alzheimer’s amyloid plaques by magnetic resonance imaging in transgenic mice without a contrast agent.Magn Reson Med 2004;52:1263–1271 [DOI] [PMC free article] [PubMed] [Google Scholar]
- 12.Poduslo JF, Wengenack TM, Curran GL, Wisniewski T, Sigurdsson EM, Macura SI, et al. Molecular targeting of Alzheimer’s amyloid plaques for contrast-enhanced magnetic resonance imaging.Neurobiol Dis 2002;11:315–329 [DOI] [PubMed] [Google Scholar]
- 13.Yang J, Wadghiri YZ, Hoang DM, Tsui W, Sun Y, Chung E, et al. Detection of amyloid plaques targeted by USPIO-Abeta1-42 in Alzheimer’s disease transgenic mice using magnetic resonance microimaging.NeuroImage 2011;55:1600–1609 [DOI] [PMC free article] [PubMed] [Google Scholar]
- 14.Kim JH, Ha TL, Im GH, Yang J, Seo SW, Lee IS, et al. Magnetic resonance imaging of amyloid plaques using hollow manganese oxide nanoparticles conjugated with antibody abeta1-40 in a transgenic mouse model.Neuroreport 2013;24:16–21 [DOI] [PubMed] [Google Scholar]
- 15.Cross DJ, Minoshima S, Anzai Y, Flexman JA, Keogh BP, Kim Y, et al. Statistical mapping of functional olfactory connections of the rat brain in vivo.Neuroimage 2004;23:1326–1335 [DOI] [PubMed] [Google Scholar]
- 16.Minoshima S, Koeppe RA, Mintun MA, Berger KL, Taylor SF, Frey KA, et al. Automated detection of the intercommissural line for stereotactic localization of functional brain images.J Nucl Med 1993;34:322–329 [PubMed] [Google Scholar]
- 17.Venot A, Lebruchec JF, Golmard JL, Roucayrol JC.An automated method for the normalization of scintigraphic images.J Nucl Med 1983;24:529–531 [PubMed] [Google Scholar]
- 18.von Reutern B, Grunecker B, Yousefi BH, Henriksen G, Czisch M, Drzezga A.Voxel-based analysis of amyloid-burden measured with [C]PiB PET in a double transgenic mouse model of Alzheimer’s disease.Mol Imaging Biol 2013;15:576–584 [DOI] [PubMed] [Google Scholar]
- 19.Sigurdsson EM, Wadghiri YZ, Mosconi L, Blind JA, Knudsen E, Asuni A, et al. A non-toxic ligand for voxel-based MRI analysis of plaques in AD transgenic mice.Neurobiol Aging 2008;29:836–847 [DOI] [PMC free article] [PubMed] [Google Scholar]
- 20.Friston KJ, Frith CD, Liddle PF, Frackowiak RS.Comparing functional (PET) images: the assessment of significant change.J Cereb Blood Flow Metab 1991;11:690–699 [DOI] [PubMed] [Google Scholar]
- 21.Shin J, Anisur RM, Ko MK, Im GH, Lee JH, Lee IS.Hollow manganese oxide nanoparticles as multifunctional agents for magnetic resonance imaging and drug delivery.Angew Chem Int Ed Engl 2009;48:321–324 [DOI] [PubMed] [Google Scholar]
- 22.Ha TL, Kim HJ, Shin J, Im GH, Lee JW, Heo H, et al. Development of target-specific multimodality imaging agent by using hollow manganese oxide nanoparticles as a platform.Chem Commun (Camb) 2011;47:9176–9178 [DOI] [PubMed] [Google Scholar]


