

Abstract
Individual trabecula segmentation (ITS) technique can decompose the trabecular bone network into individual trabecular plates and rods and is capable of quantifying the plate/rod-related microstructural characteristics of trabecular bone. This novel technique has been shown to be able to provide in-depth insights into micromechanics and failure mechanisms of human trabecular bone, as well as to distinguish the fracture status independent of area bone mineral density in clinical applications. However, the plate/rod microstructural parameters from ITS have never been correlated to experimentally determined mechanical properties of human trabecular bone. In this study, on-axis cylindrical trabecular bone samples from human proximal tibia (n=30), vertebral body (n=10), and proximal femur (n=30) were harvested, prepared, scanned using micro computed-tomography (μCT), analyzed with ITS and mechanically tested. Regression analyses showed that the plate bone volume fraction (pBV/TV) and axial bone volume fraction (aBV/TV) calculated by ITS analysis correlated the best with elastic modulus (R2=0.96-0.97) and yield strength (R2=0.95-0.96). Trabecular plate-related microstructural parameters correlated highly with elastic modulus and yield strength, while most rod-related parameters were found inversely and only moderately correlated with the mechanical properties. In addition, ITS analysis also identified that trabecular bone at human femoral neck has the highest trabecular plate-related parameters while the other sites are similar with each other in terms of plate-rod microstructure.
Introduction
Osteoporosis is a major metabolic bone disease characterized by bone mass loss and microstructural deterioration, causing bone fragility and inclination to fractures (2000). Osteoporotic fractures occur more frequently at trabecular bone abundant sites, such as spine, hip, and wrist. It has become increasingly clear that in addition to bone mass, measures of trabecular bone microstructure, such as trabecular types and trabecular orientation, are also important determinates of mechanical properties (Fields et al., 2011; Liu et al., 2006; Shi et al., 2010). During osteoporosis and aging, a dramatic transition from trabecular plates to trabecular rods was noted (Akhter et al., 2007; Liu et al., 2008a; Thomsen et al., 2002; Walker et al., 2013). In our recent study, an individual trabecula segmentation (ITS)-based morphological technique has been developed in which the entire three-dimensional trabecular bone network can be completely segmented into a collection of individual trabecular plates and rods (Liu et al., 2008b). ITS technique has been used to assess trabecular plate and rod morphology of both micro computed tomography (μCT) and high resolution peripheral quantitative computed tomography (HR-pQCT) images of human trabecular bone (Liu et al., 2010; Liu et al., 2011a; Liu et al., 2012). Studies using this ITS technique have demonstrated the changes of trabecular bone from plate-like structure to rod-like structure that occur during osteoporosis and other metabolic bone diseases, which suggested that a conversion from plate-like to rod-like trabecular bone is an important etiologic factor in aging- and osteoporosis-related bone fragility (Liu et al., 2010; Walker et al., 2013). The ITS technique has also identified the importance of trabecular plate and axial trabeculae in supporting mechanical loading in human vertebral trabecular bone (Fields et al., 2011). Furthermore, ITS can discriminate fracture status independent of areal bone mineral density (aBMD) (Liu et al., 2011b) and recently revealed the dramatic differences in trabecular microstructure between Chinese and Caucasian American using clinical HR-pQCT images (Liu et al., 2011c).
The ITS-based morphological parameters, such as trabecular plate bone volume fraction (pBV/TV) and axial bone volume fraction (aBV/TV), are highly correlated to computationally determined anisotropic elastic moduli of human trabecular bone (Liu et al., 2008b). However, the relationships between ITS-based parameters and experimentally determined mechanical properties, such as elastic modulus and yield strength, are unavailable. This is important, as most computational models do not incorporate the heterogeneity of tissue material properties, which could contribute significantly to the inter-specimen differences in mechanical behaviors. It is also well known that trabecular bone microstructure varies at different anatomic locations (Amling et al., 1996; Hildebrand et al., 1999; Keaveny et al., 2001; Lochmuller et al., 2008; Morgan et al., 2003), which may be related to the variations in the physiological and mechanical functions of skeletal sites, and partially responsible for the differences in their fracture rates. Variations in trabecular bone microstructure result in different mechanical properties of trabecular bone at various anatomic sites (Morgan et al., 2004; Morgan and Keaveny, 2001). Morgan et al. performed uniaxial compression and tension tests on cylindrical human trabecular bone samples from vertebral body, femoral neck, greater trochanter and proximal tibia. They reported that femoral neck has the highest yield strain in compression. The elastic modulus and yield strength were different at various anatomic sites, with femoral neck exhibiting the highest elastic modulus and yield strength. Further study suggested that the relations between the apparent density of trabecular bone and elastic modulus vary across proximal tibia, lumber spine, femoral neck and greater trochanter, which partially resulted from the microstructural difference. However, the contributions of trabecular bone microstructures to mechanical properties and the anatomic dependence remained to be investigated and verified.
Therefore, the primary objectives of this study were to quantify 1) the relationship between ITS parameters of human trabecular bone and experimentally measured elastic modulus and yield strength, and 2) the site dependency of plate/rod microstructural parameters and mechanical properties of human trabecular bone.
Materials and Methods
Sample preparation
Human trabecular bone cores (8-mm in diameter) were obtained from Proximal tibia (n=30), greater trochanter (GT, n=30), femoral neck samples (FN, n=30) and vertebral body (VB, n=10) with no medical history of metabolic bone diseases (Table 1). Contact radiography was performed to exclude samples with fracture or damage. Cylindrical trabecular bone cores were cut along the on-site loading direction (Morgan et al., 2003). To ensure that the cylindrical axis is aligned with the trabecular orientation, X-ray radiographs were performed on two orthogonal planes, both parallel to the specimen axis. Samples with an angle between the trabecular orientation and longitudinal axis greater than 10° were excluded. To minimize end artifacts in compression testing, the samples were glued to brass end caps (Keaveny et al., 1997; Keaveny et al., 1994b). Bone cores were wrapped with wet gauze in airtight plastic bags and stored at -20°C except during mechanical testing.
Table 1.
Donor and specimen information of four anatomic locations, BV/TV is from μCT analysis.
| Specimens | Donors (male/female) | Age(year) | BV/TV | |
|---|---|---|---|---|
| Proximal tibia | 22 | 15 (11/4) | 70±9 | 0.101±0.029* |
| Vertebral body | 10 | 10 (7/3) | 65±9 | 0.091±0.016* |
| Femoral neck | 22 | 15 (8/7) | 73±14 | 0.286±0.098 |
| Greater trochanter | 21 | 15 (8/7) | 73±14 | 0.094±0.032* |
indicates significantly different from femoral neck. Age was not significantly different between groups.
μCT imaging
Before mechanical testing, the trabecular bone samples from proximal tibia, FN and GT were scanned by a μCT system (VivaCT 40, Scanco Medical AG, Switzerland) at 15 μm isotropic voxel size. Vertebral samples were scanned using a similar μCT scanner (μCT 20 Scanco Medical AG, Switzerland) at 20 μm voxel size. The grey-scale images from proximal tibia, FN and GT were downscaled to voxel size same as vertebral samples. Global threshold value for each anatomic site was used to segment the grey-scale image. A built-in program from the scanner removed unconnected bone voxels after thresholding. An 8 mm cylindrical subvolume within the region of the strain gage in mechanical testing was extracted for further analyses.
Mechanical testing
Uniaxial compression tests were performed on cylindrical trabecular bone samples of proximal tibia, FN, GT and VB to determine their mechanical properties using a material testing system (MTS 810, Eden Prairie, MN) at room temperature with a similar procedure that was described elsewhere (Morgan and Keaveny, 2001). Samples were kept hydrated during the preparation and experiment. An 8 mm strain gage (MTS, 632.26F-20) was attached to the middle of the specimen to for strain recording. To ensure there was no slip between the end cap and specimen and that yielding did not occur at the cap/bone interface, a 25 mm extensometer (MTS 634.11F-24) was attached to the end caps. One cycle of preconditioning (±0.1% strain) with a final ramp beyond the yield point was conducted at a speed of 0.05% strain per second. Elastic modulus was determined by fitting the stress-strain curve up to 0.2% strain. Yield strength and yield strain were then determined by the 0.2% offset technique (Keaveny et al., 1994a).
ITS morphological analyses
The segmented μCT images were subjected to ITS analysis. ITS was applied on the trabecular bone cores to decompose the trabecular bone network into individual trabecular plates and rods. Briefly, digital topological analysis (DTA)-based skeletonization was applied first to transform a trabecular bone image into a reduced structure composed of only single layer of skeleton voxels while preserving the trabecular bone topology (Saha and Chaudhuri, 1994; Saha et al., 1994; Saha et al., 1997). Then, digital topological classification was performed through which each skeletal voxel was uniquely classified as either a surface or a curve type. Using an iterative reconstruction method, each voxel of the original image was classified belonging to either a plate (surface) or a rod (curve). Based on the 3D evaluations of the trabecular bone network, the following parameters were evaluated: plate and rod bone volume fraction (pBV/TV and rBV/TV); plate and rod number density (pTb.N and rTb.N, 1/mm); plate-rod ratio (P-R ratio), a parameter indicating the ratio of plates to rods; axial bone volume fraction (aBV/TV), a parameter defined as the amount of bone along the axial direction; average plate and rod trabecular thickness (pTb.Th and rTb.Th, mm); average plate trabecular surface (pTb.S mm2) and rod trabecular length (rTb.ℓ, mm); trabecular connection densities between plate-plate, plate-rod and rod-rod (P-P Junc.D, P-R Junc.D and R-R Junc.D, 1/mm3). Representative ITS decomposed images are shown in Figure 1 with a cubic subregion extracted from the cylinder. For comparison, standard μCT parameters were also derived, including: mean trabecular thickness (Tb.Th*, mm), mean trabecular number (Tb.N*, 1/mm), mean trabecular separation (Tb.Sp*, mm), bone volume fraction (BV/TV), surface-to-volume ratio (BS/BV, 1/mm), structural model index (SMI), degree of anisotropy (DA), and connectivity density (Conn.D., 1/mm3).
Figure 1.
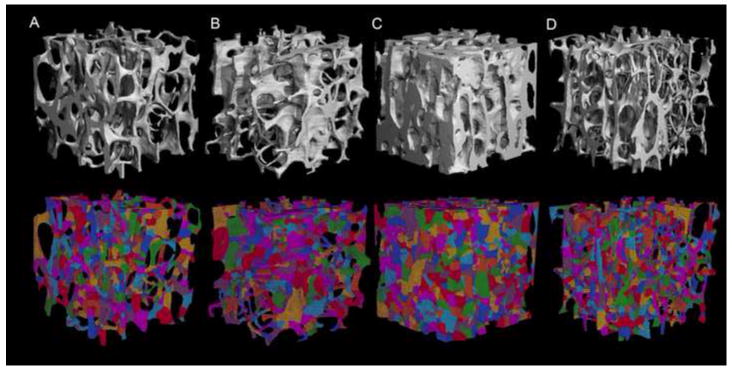
Reconstructed μCT (top) and the corresponding ITS decomposed trabecular 3D image (bottom) for (A) proximal tibia, (B) VB, (C) FN and (D) GT. In the bottom, different color represents individual trabecular. The cube was extracted from the cylindrical bone with dimension of 4×4×4 mm3.
Statistical analyses
Mean, median, standard deviation, and coefficient of variation (CV) were calculated for all the μCT standard microstructural parameters and ITS parameters. Analyses of variance (ANOVA) with Tukey post-hoc tests were used to determine differences in morphological parameters and mechanical properties amongst different anatomic sites (p<0.05). A forward stepwise multiple linear regressions was performed to predict the mechanical properties by the ITS-based morphological parameters, where pBV/TV, rBV/TV, pTb.N, rTb.N, pTb.Th, rTb.Th, pTb.S, rTb.ℓ, R-R Junc.D, P-R Junc.D, R-R Junc.D, and anatomic sites were used as the independent variables. In addition, Spearman’s correlation coefficient was used to examine the linear associations between mechanical properties and individual ITS parameters. Furthermore, linear regression analyses between elastic modulus/yield strength and BV/TV, pBV/TV, or (aBV/TV) with randomization test were performed to evaluate the site dependences of the linear relations within four anatomic sites (NCSS 2007, Utah).
Results
Twenty-two proximal tibiae, ten VB, twenty-two FN and twenty-one GT from proximal femur were successfully mechanical tested. The BV/TV measured from μCT was highest in FN, and it was similar for the other sites (range: 4.9%-44.8%, Table 1). Trabecular bone at various anatomic sites demonstrated distinct trabecular morphology, especially FN samples (Fig. 1). FN had the highest elastic modulus (3052.15±1458.33 MPa, p<0.001), highest yield strength (18.49±8.91 MPa, p<0.001), and highest yield strain (0.8±0.05%, p<0.001), when compared with the other three anatomic sites (Table 2). No significant differences in elastic modulus, yield strength, and yield strain were found among the other three anatomic sites.
Table 2.
Descriptive statistical result of trabecular bone mechanical properties for four anatomic locations.
| Site | Mean | SD | CV | Minimum | Median | Maximum | Comparison | |
|---|---|---|---|---|---|---|---|---|
| Elastic modulus (MPa) | Tibia | 750.60 | 402.96 | 53.69 | 269.98 | 674.94 | 1580.00 | FN>GT * |
| VB | 329.04 | 91.78 | 27.89 | 186.64 | 339.31 | 429.06 | GT=Tibia=VB | |
| FN | 3052.15 | 1458.33 | 47.78 | 982.46 | 3191.10 | 5429.80 | FN>Tibia* | |
| GT | 472.72 | 341.50 | 72.24 | 72.74 | 324.11 | 1172.30 | FN>VB* | |
| Yield strength (MPa) | Tibia | 3.88 | 2.32 | 59.72 | 1.12 | 2.96 | 8.92 | FN>GT* |
| VB | 1.62 | 0.44 | 27.16 | 0.91 | 1.83 | 2.07 | GT=Tibia=VB | |
| FN | 18.49 | 8.91 | 48.18 | 5.01 | 19.62 | 35.84 | FN>Tibia* | |
| GT | 2.30 | 1.63 | 70.69 | 0.36 | 1.63 | 5.39 | FN>VB* | |
| Yield strain (%) | Tibia | 0.70 | 0.08 | 11.24 | 0.52 | 0.72 | 0.83 | FN>GT* |
| VB | 0.70 | 0.03 | 4.28 | 0.64 | 0.69 | 0.74 | GT=Tibia=VB | |
| FN | 0.81 | 0.05 | 6.62 | 0.71 | 0.81 | 0.91 | FN>Tibia* | |
| GT | 0.70 | 0.07 | 10.43 | 0.55 | 0.69 | 0.84 | FN>VB* |
indicates significant difference, p<0.001
Similar to findings in mechanical properties and BV/TV, FN had the highest values in all trabecular plate-related parameters, such as pBV/TV, P-R ratio, pTb.N, pTb.Th, pTb.S, P-R Junc.D and P-P Junc.D as well as aBV/TV, compared with proximal tibia, VB, and GT (Table 3). Interestingly, ITS parameters were also more uniform across proximal tibia, VB, and GT, as evidenced by the lower coefficient of variation. However, the trabecular rod-related parameters showed notable differences among locations. In general, FN had significantly thinner (lower rTb.Th) and shorter (lower rTb.ℓ) yet more (higher rTb.N) trabecular rods compared with the proximal tibia, while no difference was found in rBV/TV. In addition, VB had thinner and shorter trabecular rods but higher R-R Junc.D than proximal tibia and GT, with similar rBV/TV. Standard morphological analysis from μCT also revealed that FN has higher BV/TV, Conn.D, Tb.N, Tb.Th but lower BS/BV, SMI, and Tb.Sp than the other three sites (Table S1).
Table 3.
Statistical analysis of ITS-based parameters on four different anatomic sites.
| ITS parameter | Mean | SD | CV | Min | Med | Max | Comparison | |
|---|---|---|---|---|---|---|---|---|
| pBV/TV | Tibia | 7.87 | 3.00 | 38.14 | 4.17 | 7.65 | 13.89 | FN>Tibia* |
| (%) | VB | 7.24 | 1.56 | 21.55 | 4.36 | 7.84 | 9.62 | FN>GT* |
| FN | 25.74 | 9.11 | 35.40 | 11.23 | 27.99 | 40.26 | FN>VB* | |
| GT | 7.24 | 3.04 | 41.97 | 3.31 | 6.79 | 12.19 | Tibia=GT=VB | |
| rBV/TV | Tibia | 1.81 | 0.49 | 27.03 | 1.17 | 1.70 | 2.83 | FN>GT*** |
| (%) | VB | 1.79 | 0.49 | 27.37 | 0.96 | 1.58 | 2.45 | FN=VB, FN=Tibia |
| FN | 2.32 | 0.87 | 37.55 | 0.73 | 2.57 | 4.05 | Tibia=GT=VB | |
| GT | 1.65 | 0.55 | 33.29 | 0.66 | 1.61 | 2.71 | ||
| aBV/TV | Tibia | 7.64 | 2.82 | 36.93 | 4.01 | 7.45 | 13.21 | FN>Tibia* |
| (%) | VB | 5.85 | 1.00 | 17.09 | 3.58 | 6.14 | 7.07 | FN>GT* |
| FN | 19.89 | 6.13 | 30.83 | 10.48 | 20.36 | 30.89 | FN>VB* | |
| GT | 6.33 | 2.59 | 40.95 | 3.06 | 5.71 | 10.99 | Tibia=GT=VB | |
| P-R Ratio | Tibia | 4.75 | 2.70 | 56.84 | 2.02 | 3.89 | 11.83 | FN>Tibia* |
| VB | 4.39 | 1.85 | 42.14 | 2.79 | 4.40 | 8.33 | FN>GT* | |
| FN | 11.68 | 3.02 | 25.86 | 7.12 | 11.33 | 19.86 | FN>VB* | |
| GT | 4.84 | 2.50 | 51.65 | 1.76 | 4.58 | 10.02 | Tibia=GT=VB | |
| pTb.N | Tibia | 2.10 | 0.18 | 8.57 | 1.74 | 2.12 | 2.49 | FN>Tibia* |
| (1/mm) | VB | 2.11 | 0.21 | 10 | 1.64 | 2.13 | 2.37 | FN>GT* |
| FN | 2.63 | 0.27 | 10.27 | 2.15 | 2.64 | 3.10 | FN>VB* | |
| GT | 2.01 | 0.26 | 12.94 | 1.62 | 2.00 | 2.49 | Tibia=GT=VB | |
| rTb.N | Tibia | 1.62 | 0.12 | 7.41 | 1.39 | 1.61 | 1.90 | FN>Tibia* |
| (1/mm) | VB | 1.73 | 0.19 | 10.98 | 1.43 | 1.67 | 2.03 | FN>GT* |
| FN | 1.87 | 0.26 | 13.9 | 1.32 | 1.94 | 2.22 | Tibia=GT=VB | |
| GT | 1.57 | 0.20 | 12.74 | 1.17 | 1.62 | 2.01 | ||
| pTb.Th | Tibia | 103.22 | 12.71 | 12.31 | 84.17 | 101.58 | 127.61 | FN>Tibia* |
| (μm) | VB | 111.0 | 9.0 | 8.1 | 99.23 | 116.14 | 127.1 | FN>GT* |
| FN | 144.55 | 19.90 | 13.77 | 113.64 | 146.62 | 178.44 | FN>VB* | |
| GT | 101.89 | 14.51 | 14.24 | 75.48 | 103.28 | 132.88 | Tibia=GT=VB | |
| rTb.Th | Tibia | 106.03 | 8.12 | 7.66 | 94.84 | 104.33 | 125.14 | VB<Tibia*** |
| (μm) | VB | 96.4 | 7.19 | 7.46 | 86.91 | 95.38 | 106.84 | FN<GT*** |
| FN | 97.67 | 3.66 | 3.75 | 89.50 | 96.89 | 104.32 | FN<Tibia** | |
| GT | 104.00 | 8.21 | 7.89 | 87.80 | 103.30 | 121.80 | Tibia=GT | |
| pTb.S | Tibia | 78.39 | 11.99 | 15.3 | 64.16 | 73.46 | 110.02 | FN>Tibia* |
| (103 μm2) | VB | 70.0 | 8.69 | 12.41 | 59.65 | 72.18 | 85.16 | FN>GT*** |
| FN | 93.77 | 9.44 | 10.06 | 71.58 | 93.02 | 107.91 | FN>VB* | |
| GT | 83.81 | 15.17 | 18.10 | 59.34 | 80.78 | 112.14 | Tibia=GT=VB | |
| rTb. ℓ | Tibia | 424.96 | 25.51 | 6.0 | 380.88 | 421.82 | 481.94 | FN<Tibia* |
| (μm) | VB | 412.29 | 19.35 | 4.69 | 365.99 | 398.90 | 437.74 | GT>VB** |
| FN | 382.64 | 11.58 | 3.03 | 362.67 | 382.22 | 404.03 | GT>FN* | |
| GT | 436.58 | 36.24 | 8.3 | 375.39 | 431.55 | 511.07 | GT=Tibia | |
| R-R Junc. D | Tibia | 1.42 | 0.40 | 28.17 | 0.79 | 1.33 | 2.40 | VB>Tibia*** |
| (1/mm3) | VB | 2.21 | 0.75 | 33.94 | 1.21 | 1.90 | 3.59 | VB>GT*** |
| FN | 2.59 | 1.16 | 44.79 | 0.60 | 2.76 | 4.41 | FN=VB | |
| GT | 1.38 | 0.60 | 43.48 | 0.42 | 1.35 | 3.03 | Tibia=GT | |
| R-P Junc. D | Tibia | 7.47 | 1.79 | 23.96 | 5.11 | 7.32 | 12.59 | FN>Tibia* |
| (1/mm3) | VB | 8.78 | 2.64 | 30.01 | 4.19 | 8.41 | 13.41 | FN>GT* |
| FN | 13.90 | 4.91 | 35.32 | 5.47 | 14.34 | 21.89 | FN>VB* | |
| GT | 6.78 | 2.51 | 37.02 | 2.82 | 6.52 | 13.51 | Tibia=GT=VB | |
| P-P Junc. D | Tibia | 7.37 | 2.08 | 28.22 | 3.93 | 7.35 | 12.96 | FN>Tibia* |
| (1/mm3) | VB | 7.91 | 2.48 | 31.35 | 3.58 | 7.61 | 11.66 | FN>GT* |
| FN | 16.06 | 5.39 | 33.56 | 7.45 | 16.75 | 27.06 | FN>VB* | |
| GT | 6.77 | 2.83 | 41.80 | 2.98 | 6.53 | 13.49 | Tibia=GT=VB |
p<0.001,
p<0.005,
p<0.05.
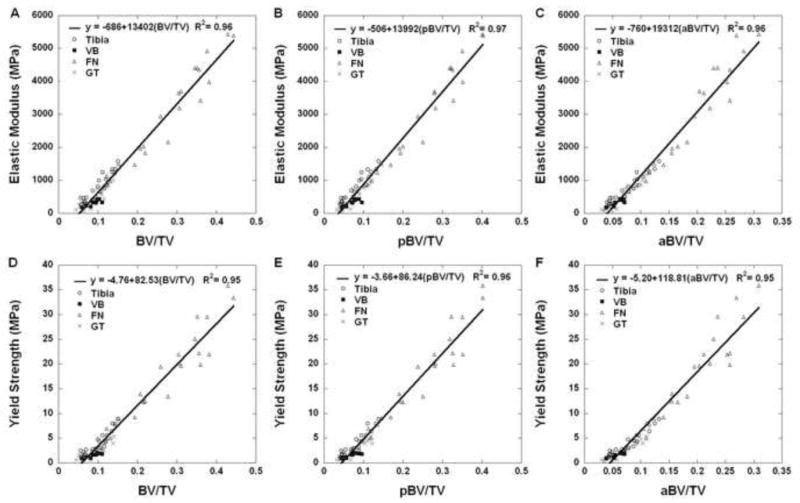
Multiple linear regression indicated that pBV/TV and rTb.ℓ were the only two significant predictors of variation in elastic modulus, and only trabecular plate-related parameters (pBV/TV, P-P Junc.D, pTb.S, and pTb.Th) were significant predictors of variation in yield strength (Table 4). Individually, plate-related parameters like pBV/TV, pTb.N, pTb.Th, P-R and P-P Junc.D correlated highly with mechanical properties, while rod-related parameters like rTb.Th and rTb.ℓ (except R-R Junc.D) were inversely correlated with mechanical measures (Table 5). Strong linear correlations were found between experimentally measured elastic modulus/yield strength and BV/TV, pBV/TV, and aBV/TV for all four anatomic sites (Table 6). In general, the correlations between elastic modulus/yield strength and BV/TV demonstrated various complex dependences on the anatomic sites, which were inconsistent with the ITS parameters. However, aBV/TV was more highly correlated with mechanical properties than BV/TV (p<0.05). Most importantly, the correlation between mechanical properties and aBV/TV at FN was different from other three anatomic sites, which is consistent with the predominance of axially aligned bone at the femoral neck. In general, very strong correlations were found between experimentally measured mechanical properties and BV/TV, pBV/TV, and aBV/TV when data were pooled from all four anatomic sites (Fig. 2). pBV/TV or aBV/TV only account partial bone tissue volume in trabecular bone, but contribute equally to measured mechanical properties of trabecular bone, emphasizing the importance of trabecular plates and the orientation of trabeculae.
Table 4.
Significant predictors and correlation coefficient from multiple linear regressions for the prediction of measured elastic modulus and yield strength.
| Independent predictors | R2 | |
|---|---|---|
| Elastic Modulus | pBV/TV*, rTb.ℓ† | 0.98 |
| Yield Strength | pBV/TV*, P_P Junc. D†, Tibia†, pTb.S†, pTb.Th† | 0.98 |
The order of the predictors is in the order of the parameters enter the model,
p<0.0001,
p<0.05.
Table 5.
Correlation coefficients (r) between the ITS microstructural parameters and experiment measured elastic modulus and yield strength
| pBV/TV | rBV/TV | pTb.N | rTb.N | pTb.Th | rTb.Th | pTb.S | rTb.ℓ | R-R Junc.D | R-P Junc.D | P-P Junc.D | |
|---|---|---|---|---|---|---|---|---|---|---|---|
| Elastic modulus | 0.98 | 0.60 | 0.83 | 0.64 | 0.86 | -0.22 | 0.50 | -0.59 | 0.64 | 0.82 | 0.86 |
| Yield strength | 0.98 | 0.58 | 0.81 | 0.62 | 0.87 | -0.21 | 0.52 | -0.58 | 0.62 | 0.80 | 0.84 |
Table 6.
Linear relations between microstructural parameters BV/TV, pBV/TV, aBV/TV and mechanical properties at four anatomic sites.
| (a)
| |||||||||
|---|---|---|---|---|---|---|---|---|---|
| E=A+B(BV/TV) | E=A+B(pBV/TV) | E=A+B(aBV/TV) | |||||||
|
| |||||||||
| A | B | R2 | A | B | R2 | A | B | R2 | |
|
|
|||||||||
| Tibia | -455 | 12460 | 0.85 | -247 | 12674 | 0.89 | -287 | 13586 | 0.90 |
| VB | -104 | 4800a | 0.70 | -22 | 4844a | 0.69 | -113 | 7554 | 0.69 |
| FN | 949a | 14260b | 0.93 | -946a | 15534b | 0.94 | -1487 | 22820a,b | 0.92 |
| GT | 423 | 10069b,c | 0.85 | -283 | 10440b,c | 0.86 | -334 | 12740c | 0.94 |
|
| |||||||||
| (b)
| |||||||||
| σ=A+B(BV/TV) | σ=A+B(pBV/TV) | σ=A+B(aBV/TV) | |||||||
|
| |||||||||
| A | B | R2 | A | B | R2 | A | B | R2 | |
|
|
|||||||||
| Tibia | -3.03 | 71.40 | 0.85 | -1.89 | 73.35 | 0.90 | -2.09 | 78.15 | 0.90 |
| VB | -0.55 | 24.06a | 0.76 | -0.14 | 24.26a | 0.75 | -0.59 | 37.65 | 0.74 |
| FN | -5.43a | 85.26b | 0.89 | -5.44a | 92.99b | 0.90 | -8.7 | 136.73a,b | 0.89 |
| GT | -1.93 | 47.65a,c | 0.83 | -1.32 | 50.08a,c | 0.87 | -1.51 | 60.23c | 0.92 |
E: elastic modulus, σ: yield strength.
significant different from Tibia
significant different from VB
significant different from FN
Figure 2.
Linear regressions between microstructural parameters BV/TV, pBV/TV or aBV/TV and elastic modulus (A-C), and yield strength (D-F) with four anatomic sites pooled. Four anatomic sites were labeled with different markers.
Discussion
In this study, the relationship between ITS-derived parameters and mechanical properties measured by direct mechanical testing were examined. The ITS-based microstructural parameters have been used in analyzing micromechanics of human trabecular bone failure based on μCT images, quantified and validated in clinical HR-pQCT images and applied in clinical studies (Liu et al., 2010; Liu et al., 2011b; Stein et al., 2013), demonstrating promising ability in distinguishing fracture status and detecting subtle microstructural changes in osteoporosis treatments. Therefore, it is critical to investigate the associations between the ITS parameters and experimentally determined elastic modulus and yield strength, which have been considered as the gold standards. In this study, we showed that trabecular plates and axially aligned trabeculae play dominant roles in determining the elastic modulus and yield strength of human trabecular bone from multiple anatomic sites, which confirmed the results in our previous study in which the elastic moduli were determined computationally (Liu et al., 2008b). This work, for the first time, provided necessary data relating ITS-based trabecular plate-rod parameters to the mechanical functions and integrity of human trabecular bone. The stepwise regression analyses indicate that the elastic modulus of trabecular bone is governed by trabecular plate bone volume fraction and trabecular rod length, while the yield strength is completely determined by trabecular plate-related parameters. When the axial elastic modulus was determined computationally, the elastic modulus was significantly correlated to pBV/TV, pTb.Th, and rTb.Th (Liu et al., 2008b). We showed that pBV/TV is a major contributor to experimentally measured elastic modulus. However, current study suggests that trabecular rod length also plays a role in the elastic modulus as a negative contributor (Table 5). The trabecular rod length is significantly correlated to traditional parameter, trabecular spacing Tb.Sp, which is a negative determinant of elastic modulus of human trabecular bone (Ito, 2005; Liu et al., 2008b; Liu et al., 2006; Mittra et al., 2008). Experimentally measured yield strength appears to be most closely related to trabecular plate parameters. This is consistent with previous computational micromechanical analyses of human vertebral bone and suggests that trabecular plates support most of the on-axis loading during failure of trabecular bone.
Precise mechanical properties of human trabecular bone were determined using end-caps to eliminate end artifacts (Keaveny et al., 1997). The bone volume fractions at various anatomic locations are similar to those reported by Morgan et al., and similar elastic modulus and yield strength of human trabecular bone were obtained in this paper (Morgan et al., 2003). An evaluation of the relationship between elastic modulus and yield strength revealed an identical linear relation shown in literature (Morgan and Keaveny, 2001). In addition, we provided quantitative data on the relationship between experimentally determined mechanical properties and ITS-determined plate-rod microstructural measures of human trabecular bone. ITS analyses of human trabecular bone samples from various anatomic sites revealed interesting observations and quantification of trabecular bone microstructure. The results indicate that FN has higher plate-related structural parameters than the other three sites, which is similar to previous results. However, human trabecular bone at other anatomic sites, such as tibia, vertebra, and greater trochanter, were similar in terms of trabecular plate/rod microstructure. This study also indicate that aBV/TV might be a good microstructural parameters in determining mechanical properties of trabecular bone, as it not only has the similar high correlation coefficient as BV/TV and pBV/TV, but also indicate the significantly different microstructure at the FN. The contributions of aBV/TV have been demonstrated in many recent publications (Fields et al., 2011; Liu et al., 2008b; Liu et al., 2011c).
A few limitations exist in the current study. The number of samples at the vertebral site was limited and all of the cadaveric tissue was harvested from donors with a narrow age range. Additional studies with tissue from younger individuals having greater structural heterogeneity are necessary to confirm some of the relationships, particularly those related to trabecular orientation. For example, bone from younger individuals may contain more horizontal trabeculae (Thomsen et al., 2002; Thomsen et al., 2013), which could increase their role. In addition, only on-axis compressive properties were determined. It remains to be characterized how off-axis and multiaxial mechanical properties depend on plate and rod microstructural parameters of human trabecular bone.
In conclusion, this work experimentally studied the compressive mechanical properties and plate-rod microstructural characteristics of human trabecular from different anatomic sites. We found that trabecular bone microstructure and mechanical properties at femoral neck were significantly different from other anatomic sites. Trabecular plates and aligned trabeculae play the most important roles in mechanical integrity of human trabecular bone. It is interesting to note that aligned trabeculae not only dominate the mechanical properties, but also differentiate between anatomic variations in ITS measurements.
Supplementary Material
Acknowledgments
This work was partially supported by grants from National Institutes of Health (AR051376, AR058004). We would like to acknowledge Dr. Tony M. Keaveny for the mechanical testing result and μCT image of vertebral sample.
Footnotes
Conflict of Interest Statement
The authors declare that there are no conflicts of interest regarding the submitted manuscript.
Publisher's Disclaimer: This is a PDF file of an unedited manuscript that has been accepted for publication. As a service to our customers we are providing this early version of the manuscript. The manuscript will undergo copyediting, typesetting, and review of the resulting proof before it is published in its final citable form. Please note that during the production process errors may be discovered which could affect the content, and all legal disclaimers that apply to the journal pertain.
References
- Osteoporosis prevention, diagnosis, and therapy. NIH Consens Statement. 2000;17:1–45. [PubMed] [Google Scholar]
- Akhter MP, Lappe JM, Davies KM, Recker RR. Transmenopausal changes in the trabecular bone structure. Bone. 2007;41:111–116. doi: 10.1016/j.bone.2007.03.019. [DOI] [PubMed] [Google Scholar]
- Amling M, Herden S, Posl M, Hahn M, Ritzel H, Delling G. Heterogeneity of the skeleton: comparison of the trabecular microarchitecture of the spine, the iliac crest, the femur, and the calcaneus. J Bone Miner Res. 1996;11:36–45. doi: 10.1002/jbmr.5650110107. [DOI] [PubMed] [Google Scholar]
- Fields AJ, Lee GL, Liu XS, Jekir MG, Guo XE, Keaveny TM. Influence of vertical trabeculae on the compressive strength of the human vertebra. J Bone Miner Res. 2011;26:263–269. doi: 10.1002/jbmr.207. [DOI] [PMC free article] [PubMed] [Google Scholar]
- Hildebrand T, Laib A, Muller R, Dequeker J, Ruegsegger P. Direct three-dimensional morphometric analysis of human cancellous bone: microstructural data from spine, femur, iliac crest, and calcaneus. J Bone Miner Res. 1999;14:1167–1174. doi: 10.1359/jbmr.1999.14.7.1167. [DOI] [PubMed] [Google Scholar]
- Ito M. Assessment of bone quality using micro-computed tomography (micro-CT) and synchrotron micro-CT. J Bone Miner Metab. 2005;23(Suppl):115–121. doi: 10.1007/BF03026335. [DOI] [PubMed] [Google Scholar]
- Keaveny TM, Guo XE, Wachtel EF, McMahon TA, Hayes WC. Trabecular bone exhibits fully linear elastic behavior and yields at low strains. J Biomech. 1994a;27:1127–1136. doi: 10.1016/0021-9290(94)90053-1. [DOI] [PubMed] [Google Scholar]
- Keaveny TM, Morgan EF, Niebur GL, Yeh OC. Biomechanics of trabecular bone. Annu Rev Biomed Eng. 2001;3:307–333. doi: 10.1146/annurev.bioeng.3.1.307. [DOI] [PubMed] [Google Scholar]
- Keaveny TM, Pinilla TP, Crawford RP, Kopperdahl DL, Lou A. Systematic and random errors in compression testing of trabecular bone. J Orthop Res. 1997;15:101–110. doi: 10.1002/jor.1100150115. [DOI] [PubMed] [Google Scholar]
- Keaveny TM, Wachtel EF, Ford CM, Hayes WC. Differences between the tensile and compressive strengths of bovine tibial trabecular bone depend on modulus. J Biomech. 1994b;27:1137–1146. doi: 10.1016/0021-9290(94)90054-x. [DOI] [PubMed] [Google Scholar]
- Liu XS, Cohen A, Shane E, Stein E, Rogers H, Kokolus SL, Yin PT, McMahon DJ, Lappe JM, Recker RR, Guo XE. Individual trabeculae segmentation (ITS)-based morphological analysis of high-resolution peripheral quantitative computed tomography images detects abnormal trabecular plate and rod microarchitecture in premenopausal women with idiopathic osteoporosis. J Bone Miner Res. 2010;25:1496–1505. doi: 10.1002/jbmr.50. [DOI] [PMC free article] [PubMed] [Google Scholar]
- Liu XS, Huang AH, Zhang XH, Sajda P, Ji B, Guo XE. Dynamic simulation of three dimensional architectural and mechanical alterations in human trabecular bone during menopause. Bone. 2008a;43:292–301. doi: 10.1016/j.bone.2008.04.008. [DOI] [PMC free article] [PubMed] [Google Scholar]
- Liu XS, Sajda P, Saha PK, Wehrli FW, Bevill G, Keaveny TM, Guo XE. Complete volumetric decomposition of individual trabecular plates and rods and its morphological correlations with anisotropic elastic moduli in human trabecular bone. J Bone Miner Res. 2008b;23:223–235. doi: 10.1359/JBMR.071009. [DOI] [PMC free article] [PubMed] [Google Scholar]
- Liu XS, Sajda P, Saha PK, Wehrli FW, Guo XE. Quantification of the roles of trabecular microarchitecture and trabecular type in determining the elastic modulus of human trabecular bone. J Bone Miner Res. 2006;21:1608–1617. doi: 10.1359/jbmr.060716. [DOI] [PMC free article] [PubMed] [Google Scholar]
- Liu XS, Shane E, McMahon DJ, Guo XE. Individual trabecula segmentation (ITS)-based morphological analysis of microscale images of human tibial trabecular bone at limited spatial resolution. J Bone Miner Res. 2011a;26:2184–2193. doi: 10.1002/jbmr.420. [DOI] [PubMed] [Google Scholar]
- Liu XS, Stein EM, Zhou B, Zhang CA, Nickolas TL, Cohen A, Thomas V, McMahon DJ, Cosman F, Nieves J, Shane E, Guo XE. Individual trabecula segmentation (ITS)-based morphological analyses and micro finite element analysis of HR-pQCT images discriminate postmenopausal fragility fractures independent of DXA measurements. J Bone Miner Res. 2011b doi: 10.1002/jbmr.562. [DOI] [PMC free article] [PubMed] [Google Scholar]
- Liu XS, Stein EM, Zhou B, Zhang CA, Nickolas TL, Cohen A, Thomas V, McMahon DJ, Cosman F, Nieves J, Shane E, Guo XE. Individual trabecula segmentation (ITS)-based morphological analyses and microfinite element analysis of HR-pQCT images discriminate postmenopausal fragility fractures independent of DXA measurements. J Bone Miner Res. 2012;27:263–272. doi: 10.1002/jbmr.562. [DOI] [PMC free article] [PubMed] [Google Scholar]
- Liu XS, Walker MD, McMahon DJ, Udesky J, Liu G, Bilezikian JP, Guo XE. Better skeletal microstructure confers greater mechanical advantages in Chinese-American women versus white women. J Bone Miner Res. 2011c;26:1783–1792. doi: 10.1002/jbmr.378. [DOI] [PMC free article] [PubMed] [Google Scholar]
- Lochmuller EM, Matsuura M, Bauer J, Hitzl W, Link TM, Muller R, Eckstein F. Site-specific deterioration of trabecular bone architecture in men and women with advancing age. J Bone Miner Res. 2008;23:1964–1973. doi: 10.1359/jbmr.080709. [DOI] [PubMed] [Google Scholar]
- Mittra E, Rubin C, Gruber B, Qin YX. Evaluation of trabecular mechanical and microstructural properties in human calcaneal bone of advanced age using mechanical testing, microCT, and DXA. J Biomech. 2008;41:368–375. doi: 10.1016/j.jbiomech.2007.09.003. [DOI] [PubMed] [Google Scholar]
- Morgan EF, Bayraktar HH, Keaveny TM. Trabecular bone modulus-density relationships depend on anatomic site. J Biomech. 2003;36:897–904. doi: 10.1016/s0021-9290(03)00071-x. [DOI] [PubMed] [Google Scholar]
- Morgan EF, Bayraktar HH, Yeh OC, Majumdar S, Burghardt A, Keaveny TM. Contribution of inter-site variations in architecture to trabecular bone apparent yield strains. J Biomech. 2004;37:1413–1420. doi: 10.1016/j.jbiomech.2003.12.037. [DOI] [PubMed] [Google Scholar]
- Morgan EF, Keaveny TM. Dependence of yield strain of human trabecular bone on anatomic site. J Biomech. 2001;34:569–577. doi: 10.1016/s0021-9290(01)00011-2. [DOI] [PubMed] [Google Scholar]
- Saha PK, Chaudhuri BB. Detection of 3-D Simple Points for Topology Preserving Transformations with Application to Thinning. Ieee T Pattern Anal. 1994;16:1028–1032. [Google Scholar]
- Saha PK, Chaudhuri BB, Chanda B, Majumder DD. Topology Preservation in 3d Digital Space. Pattern Recogn. 1994;27:295–300. [Google Scholar]
- Saha PK, Chaudhuri BB, Dutta D, Majumder DD. A new shape preserving parallel thinning algorithm for 3D digital images. Pattern Recogn. 1997;30:1939–1955. [Google Scholar]
- Shi X, Liu XS, Wang X, Guo XE, Niebur GL. Effects of trabecular type and orientation on microdamage susceptibility in trabecular bone. Bone. 2010;46:1260–1266. doi: 10.1016/j.bone.2010.02.005. [DOI] [PMC free article] [PubMed] [Google Scholar]
- Stein EM, Silva BC, Boutroy S, Zhou B, Wang J, Udesky J, Zhang C, McMahon DJ, Romano M, Dworakowski E, Costa AG, Cusano N, Irani D, Cremers S, Shane E, Guo XE, Bilezikian JP. Primary hyperparathyroidism is associated with abnormal cortical and trabecular microstructure and reduced bone stiffness in postmenopausal women. J Bone Miner Res. 2013;28:1029–1040. doi: 10.1002/jbmr.1841. [DOI] [PMC free article] [PubMed] [Google Scholar]
- Thomsen JS, Ebbesen EN, Mosekilde LI. Age-related differences between thinning of horizontal and vertical trabeculae in human lumbar bone as assessed by a new computerized method. Bone. 2002;31:136–142. doi: 10.1016/s8756-3282(02)00801-3. [DOI] [PubMed] [Google Scholar]
- Thomsen JS, Niklassen AS, Ebbesen EN, Bruel A. Age-related changes of vertical and horizontal lumbar vertebral trabecular 3D bone microstructure is different in women and men. Bone. 2013;57:47–55. doi: 10.1016/j.bone.2013.07.025. [DOI] [PubMed] [Google Scholar]
- Walker MD, Liu XS, Zhou B, Agarwal S, Liu G, McMahon DJ, Bilezikian JP, Guo XE. Premenopausal and postmenopausal differences in bone microstructure and mechanical competence in Chinese-American and white women. J Bone Miner Res. 2013;28:1308–1318. doi: 10.1002/jbmr.1860. [DOI] [PMC free article] [PubMed] [Google Scholar]
Associated Data
This section collects any data citations, data availability statements, or supplementary materials included in this article.