

Abstract
Porteresia coarctata is a wild relative of rice with capability of high salinity and submergence tolerance. The transcriptome analyses of Porteresia can lead to the identification of candidate genes involved in salinity and submergence tolerance. We sequenced the transcriptome of Porteresia under different conditions using Illumina platform and generated about 375 million high-quality reads. After optimized assembly, a total of 152 367 unique transcript sequences with average length of 794 bp were obtained. Many of these sequences might represent fragmented transcripts. Functional annotation revealed the presence of genes involved in diverse cellular processes and 2749 transcription factor (TF)-encoding genes in Porteresia. The differential gene expression analyses identified a total of 15 158 genes involved in salinity and/or submergence response(s). The stress-responsive members of different TF families, including MYB, bHLH, AP2-EREBP, WRKY, bZIP and NAC, were identified. We also revealed key metabolic pathways, including amino acid biosynthesis, hormone biosynthesis, secondary metabolite biosynthesis, carbohydrate metabolism and cell wall structures, involved in stress tolerance in Porteresia. The transcriptome analyses of Porteresia are expected to highlight genes/pathways involved in salinity and submergence tolerance of this halophyte species. The data can serve as a resource for unravelling the underlying mechanism and devising strategies to engineer salinity and submergence tolerance in rice.
Keywords: metabolic pathways, Porteresia, salinity tolerance, submergence, transcriptome analysis
1. Introduction
High salinity is a severe and increasing constraint on the global crop production. Most of our major crops are highly susceptible to salinity, and there is an urgent need to address this problem. Salinity tolerance is a complex multigenic trait, which depends on a range of physiological processes. The salinity stress response has been studied in model crop plant rice,1–4 which represents a glycophyte plant and does not possess the capability to tolerate high salinity. The existence of wild halophytic species, which can grow not only in saline but also in submergence prone habitats, has been reported.5,6 These wild species may prove to be an important gene reservoir for improving salinity tolerance in crop plants via genetic engineering approaches.5–8
Porteresia coarctata (Oryza coarctata) is a wild halophyte, which shows considerable adaptation to high salinity (20–40 dS m−1) and can also tolerate complete submergence in saline water for a long period.9 Porteresia grows in abundance near coastal areas, where the vegetation is inundated twice a day with highly saline water. Although many salinity- and submergence-tolerant rice cultivars have also been identified,10–12 they seem to be much less tolerant than Porteresia. It is a close wild relative of rice and can serve as an important source of genes related to salinity and submergence tolerance.8,13 Some novel insights into the molecular mechanisms underlying salinity tolerance have been obtained from transcriptome and genome analyses of close halophyte relatives of Arabidopsis, Thellungiella halophila and T. parvula.14–16 A few studies have demonstrated that engineering of some genes from Porteresia, such as those involved in inositol metabolic pathway, can confer salinity tolerance in cultivated rice.17,18 However, only a few genes have been isolated from Porteresia so far. Furthermore, the effect of submergence stress and its combined effect with salinity have hardly been analysed.5 The discovery of more genes and metabolic pathways in wild species like Porteresia can provide a better strategy to impart salinity tolerance in cultivated rice.
The availability of next-generation sequencing technologies provides a high-throughput, rapid and cost-effective means to sequence and characterize the transcriptome of non-model and wild species as well.19–21 In this study, we sequenced the transcriptome of Porteresia under different conditions using Illumina technology. The transcriptome assembly was generated to reveal the first picture of its gene content. We also analysed gene expression under salinity and submergence conditions and identified the genes and metabolic pathways involved in these stress responses. The data presented here will provide a very useful resource to engineer salinity and submergence tolerance stress in crop plant rice.
2. Materials and methods
2.1. Plant material
Porteresia coarctata (Roxb) Tateoka plants were collected from saline river banks (Matla) of the Sunderbans in the coastal region of Bay of Bengal, India. The plants were brought to the laboratory along with soil and water. The plants were washed carefully to remove soil from the leaves and roots. The plants were given different treatments, including control (RO water, control), low salinity (450 mM NaCl, salt450), high salinity (700 mM NaCl solution, salt700), submergence (fully submerged in RO water, submergence) and submergence in low salinity (fully submerged in 450 mM NaCl, salt + submergence). The plants were harvested in three biological replicates 12 h after the treatment.
2.2. RNA isolation and sequencing
Total RNA was isolated from each tissue sample (control, salt450, salt700, submergence and salt + submergence) using TRI reagent (Sigma Life Science, USA). The quantity and quality of RNA samples were checked using Nanodrop (Thermo Fisher Scientific) and Agilent Bioanalyzer (Agilent Technologies, Singapore). Equal amounts of total RNA from three biological replicates were pooled for all the five treated samples before library preparation. Sequencing of all the five samples was performed by the commercial service provider, Genotypic Technology Pvt. Ltd, Bangalore, India, each in one lane using an Illumina Genome Analyzer II to generate 100 base long paired-end reads. The raw data obtained were filtered through the standard Illumina pipeline. The filtered Fastq files were further subjected to more stringent quality control using the NGS QC Toolkit (v2.3) to remove the low-quality reads and reads containing adaptor/primer contamination.22 The high-quality filtered reads were used for further downstream processing. The entire sequence data generated in this study are available in the Gene Expression Omnibus database under the accession number GSE44913. The non-redundant Illumina reads were filtered using the CDHIT program (http://weizhong-lab.ucsd.edu/cd-hit/).
2.3. Transcriptome assembly
De novo transcriptome assembly was performed using various tools, including Velvet (v1.2.01), Oases (v0.2.04), ABySS (v1.2.6), Trinity (vr2012-05-18) and CLC Genomics Workbench (v4.7.2). Various parameters, including k-mer length, insert length and expected coverage, were optimized to obtain best assembly as described previously.23 Reference-based assembly was performed using the CLC Genomics Workbench using default parameters, and assembled consensus sequences were exported into a fasta file. The annotated cDNA sequences of japonica rice (Os-Nipponbare-Reference-IRGSP-1.0)24 available at Rice Genome Annotation Project (MSUv7.0; http://rice.plantbiology.msu.edu/) were used as a reference. Merged assembly was performed using the TGICL program (v2.0), with minimum overlap length of 40 and minimum percentage identity of 90 for overlaps. The quality of assemblies generated was assessed using the perl scripts given in the NGS QC Toolkit.
2.4. Functional annotation
BLASTX searches against rice proteome, UniRef90, UniRef100 and NCBI non-redundant nucleotide databases, were performed to assign a putative function to each Porteresia transcript. GOSlim terms to each transcript were assigned on the basis of their best significant match (E-value ≤ 1e−10) rice protein to provide a broad overview of their function. An E-value cut-off of 1e−10 was used to identify orthologs between Porteresia and rice. The transcription factor (TF) encoding Porteresia transcripts were identified based on the hidden Markov model profile search of conserved domain present in each TF family as described previously.23 The statistical significance of the difference in the number of members between Porteresia and rice in each TF family was calculated via Fisher's exact test.
2.5. Read mapping and gene expression analysis
To estimate the gene expression, all the high-quality reads from each condition were aligned on the transcriptome assembly using the RNA-Seq Analysis utility of CLC Genomics Workbench. A maximum of two mismatches were allowed for the alignments. The read counts for each tissue sample were normalized by calculating the read per kilobase per million for each transcript. The DESeq software (v1.10.1)25 was used for differential gene expression analysis. DESeq provides a simple and computationally faster method for quantitative measurement of gene expression based on the negative binomial distribution with variance and mean linked by local regression.25 We calculated the size factor for each sample for normalization of read count data using DESeq. A P-value cut-off of ≤0.05 and at least two-fold change was used to identify differentially expressed genes. Heatmaps showing expression profiles (log2 fold change) were generated using the MultiExperiment Viewer (MeV, v4.8). K-means clustering was performed using Euclidean distance matrix with 1000 iterations using MeV. Hierarchical clustering was performed using Euclidean distance matrix with a complete linkage rule using MeV.
2.6. Gene ontology and pathway enrichment analysis
The best Arabidopsis hit corresponding to each Porteresia transcript was identified using BLAST search to study gene ontology (GO) enrichment. GO enrichment of different sets of differentially expressed genes was performed using the BiNGO tool.26 The metabolic pathway data available in the RiceCyc database of Gramene27 were analysed to identify the enriched metabolic pathways in various gene sets. Both the GO and pathway enrichment analyses were performed at P-value cut-off of ≤0.05 after applying Benjamini-Hochberg correction.
2.7. Real-time PCR analysis
For real-time PCR analysis, gene-specific primers were designed using the Primer Express (v3.0) software (Applied Biosystems, Santa Clara, CA, USA). The primer sequences used in this study are listed in Supplementary Table S1. Real-time PCRs were performed as described.28 The expression of most suitable internal control gene for rice, UBQ5,29 in each sample was used for normalization. At least three independent biological replicates with three technical replicates of each biological replicates for each tissue sample were used for the analysis. The correlation between expression profiles of selected genes obtained from real-time PCR and RNA-seq data analyses was determined using MS Excel.
3. Results
3.1. Transcriptome sequencing
To generate the transcriptome of Porteresia, we collected tissue samples from plants kept in water (control) and those subjected to salinity and submerged conditions. For salinity stress, we kept the plants in 450 mM (salt450) and 700 mM (salt700) sodium chloride solutions and for submergence stress, plants were kept completely submerged in water (submergence) and 450 mM sodium chloride solution (salt + submergence) and collected the tissues after 12 h of treatment. Porteresia is a halophyte, which grows naturally in coastal region, where plants experience lunar tide and are exposed to submergence in saline sea water every 12 h. Therefore, to obtain maximum representation of genes involved in signalling and adaptation response under salinity and submergence stress, we selected time point of 12 h for the analysis in our study. The RNA-seq libraries were constructed and sequenced using an Illumina sequencing platform. We generated a total of more than 422 million reads from above five samples. After quality filtering, about 375 million high-quality reads (ranging from about 65 to 90 million reads for each sample) were obtained (Table 1). The average Phred quality score was at least 30 at each base position for filtered reads, indicating high quality of filtered reads (Supplementary Fig. S1).
Table 1.
Summary of sequencing data generated and mapping to Porteresia transcriptome
| Total reads | High-quality reads | Mapped readsa | Mapped reads (%) | |
|---|---|---|---|---|
| Control | 73 200 160 | 64 799 692 | 56 638 113 | 87.40 |
| Salt450 | 78 717 162 | 68 275 254 | 59 818 916 | 87.61 |
| Salt700 | 73 664 082 | 66 857 102 | 58 431 827 | 87.40 |
| Submerged | 101 517 546 | 89 800 570 | 78 997 383 | 87.97 |
| Salt450 + submerged | 95 241 740 | 85 027 006 | 74 867 541 | 88.05 |
| Total | 422 340 690 | 374 759 624 | 328 753 780 | 87.72 |
aNumber of high-quality reads mapped using CLC Genomics workbench.
3.2. Transcriptome assembly optimization
To generate the optimal assembly of the Porteresia transcriptome, first, we performed de novo assembly using all the high-quality reads (374 759 624) and non-redundant reads (194 316 505) after removing duplicate reads from all the five samples. We used Velvet, Oases, ABySS, Trinity and CLC Genomics Workbench softwares to perform de novo assembly. The de novo assembly was generated at different k-mer lengths using these softwares. From each software, the best assembly output was selected based on the statistics (average and N50 contig lengths) and similarity with rice proteome (Supplementary Table S2). Among the various softwares, Oases generated the best assembly with largest average and N50 lengths at k-mer length of 59 for both datasets (Supplementary Table S2). However, only 34% and 29% rice proteins showed a significant hit with the assemblies generated from whole and non-redundant datasets, respectively. The assembly output from other softwares also exhibited very low similarity to rice proteins. As Porteresia is a wild relative of rice, higher similarity to rice proteins was expected. These results suggested that the output of de novo assembly was not optimal.
Therefore, we followed a combined approach of both reference-based and de novo assemblies to generate the transcriptome of Porteresia. In the first step, we performed reference-based assembly using the CLC Genomics Workbench. We used all the reads from each sample to generate a consensus assembly (Supplementary Table S3). The average and N50 lengths of reference assembly were much higher when compared with de novo assemblies. The consensus assembly from all the five samples generated a total of 36 966 contigs with the average length of 1265 bp and N50 length of 1761 bp (Supplementary Table S3). This assembly utilized ∼81% of the total reads. To identify the novel genes in Porteresia, as a second step, we performed de novo assembly of unused reads in the first step of reference-based assembly. We used different softwares (CLC, Trinity, ABySS, Velvet and Oases) and parameters to select the best assembly. Oases generated the best assembly with largest average (544 bp) and N50 (719 bp) contig lengths. However, the number of consensus sequences (161 160) generated was quite large. As a last step, we generated a merged assembly of the contigs generated in primary assemblies of two steps via TGICL program. Our earlier studies have shown that TGICL generates optimal merged assembly from the contigs of primary assemblies.23,30 This assembly resulted in a total of 152 367 (39 203 contigs and 113 164 singletons) unique sequences (referred as contigs) of at least 200 bp in length (Table 2). The average and N50 lengths of contigs were 794 and 1249 bp, respectively. The mapping of all the high-quality reads suggested that >95% of reads were used in the final merged assembly and average read depth of each contig was 2352. About 55% of rice proteins were represented in this assembly and >23% of rice proteins exhibited ≥70% coverage (Table 2).
Table 2.
Assembly statistics of Porteresia transcriptome
| Total reads | 374 759 624 |
| Total transcripts | 152 367 |
| Size (Mb) | 120.99 |
| Minimum transcript length (bp) | 200 |
| Maximum transcript length (bp) | 14 945 |
| Average transcript length (bp) | 794.07 |
| N50 length (bp) | 1249 |
| Total reads used for assembly | 95.62% |
| Average read depth | 2352 |
| Transcripts with significant hitsa | 48 048 (31.5%) |
| Rice proteins with significant hitb | 21 499 (55.06%) |
| Rice proteins with ≥70% coveragec | 9114 (23.34%) |
aNumber of transcripts showing a significant hit (E-value ≤ 1e−5) with rice proteins.
bNumber of rice proteins showing a significant hit (E-value ≤ 1e−5) with Porteresia transcripts.
cNumber of rice proteins that showed ≥70% coverage.
3.3. Functional annotation of Porteresia transcriptome
The unique set of transcripts generated above were designated as P. coarctata tentative consensus (PcTC) transcripts and assigned unique identifier number from PcTC000001 to PcTC152367. The whole transcriptome sequence is available at Porteresia Transcriptome Sequence web page (http://nipgr.res.in/mjain.html?Page=porteresia). The total transcriptome assembly size was ∼121 Mb. About 48% of all the transcripts were longer than 500 bp and >24% transcripts were larger than 1000 bp (Supplementary Fig. S2). Most of the smaller transcripts were represented by the singletons (Supplementary Fig. S2). Many of these are expected to merge into larger transcripts, once more sequence data of larger read length become available. The average GC content and distribution of Porteresia transcripts were significantly different than that of rice (Supplementary Fig. S3), indicating substantial differences between rice and Porteresia genomes. Furthermore, to explore the putative function, we assigned gene description to each Porteresia transcript corresponding to the ortholog rice proteins and proteins in other databases. A gene description term could be assigned to ∼36% of Porteresia transcripts. The lower percentage of annotated transcripts was because most of the smaller transcripts generated in the de novo assembly did not show significant similarity with known proteins in various databases and presumably represent species-specific genes.
Based on their similarity with rice genes, Porteresia transcripts were assigned GOSlim terms under biological process, molecular function and cellular component categories. Among the biological process terms, biosynthetic process (20%) was most represented followed by nucleic acid metabolic process (15.3%) and response to stress (14.5%) (Fig. 1A). A high representation of response to stress category might contribute to the high salinity and submergence tolerance phenotype of Porteresia. The largest number of transcripts belonged to catalytic activity (16.1%), protein binding (15.1%) and hydrolase activity (12.3%) among the molecular function GOSlim terms. Among the cellular component terms, the transcripts related to membrane (18.5%) and plastid (17%) were the largest in number (Fig. 1A). We further analysed the Porteresia transcriptome to identify the TF-encoding genes. A total of 2749 transcripts encoding for TFs were identified. Among the 85 families represented in these transcripts, the MYB-domain (197) family TFs were most abundant followed by bHLH (150)- and NAC (147)-domain TFs (Fig. 1B). Although the total number of TFs was slightly higher in Porteresia (2749) than in rice (2452), we found significant differences in their distribution in certain families. Notably, the number of TFs predicted in Porteresia for bromodomain, zinc-finger CCHC and SNF2 families were significantly higher than rice. Likewise, the number of predicted TFs in AP2-EREBP, GRAS, MADS, TCP, TRAF and ZF-HD families were significantly lesser in Porteresia than in rice (Fig. 1B). These results suggest significant differences in the transcriptional machinery of the two species and might contribute to stress adaptation phenotype in Porteresia.
Figure 1.

Functional annotation of Porteresia transcripts. (A) GOSlim term assignment to the Porteresia transcripts in different categories of biological process, molecular function and cellular component. (B) The number of transcripts representing different TF families in Porteresia and rice transcriptomes are shown. Fisher's exact test was used to evaluate the significant difference in the number of members representing TF families in the two species. The TF families with statistically significant difference in the number of members are marked with single (P ≤ 0.05) or double (P ≤ 0.01) asterisks.
3.4. Differential gene expression analysis
In addition to the transcriptome construction, RNA-seq provides an opportunity to measure gene expression at the whole-genome level.31,32 To investigate the differential gene expression under different conditions, we mapped the reads from each sample on the Porteresia transcriptome. A total of 87–88% of the high-quality Illumina reads were mapped to the Porteresia transcripts (referred as genes hereafter) from each sample (Table 1). Differential gene expression analysis was performed using the DESeq software to identify the genes with altered expression under different conditions. A total of 15 158 genes exhibited differential expression under at least one stress condition analysed (Supplementary Table S4). The largest number of genes was differentially expressed in the plants subjected to submergence stress (5864) followed by both salinity and submergence stresses together (5787) (Fig. 2A). A total of 4841 and 4243 genes exhibited differential expression under low salinity (salt450) and high salinity (salt700) stress conditions, respectively. Under salinity stress, a larger number of genes were up-regulated (3020 under salt450 and 2553 under salt700) when compared with down-regulated genes (1821 under salt450 and 1690 under salt700). However, in contrast, the larger number of genes was down-regulated under submergence stress alone (3712) and salinity and submergence stresses together (3952) when compared with up-regulated genes (2152 for submergence and 1835 for salt + submergence) (Fig. 2A).
Figure 2.
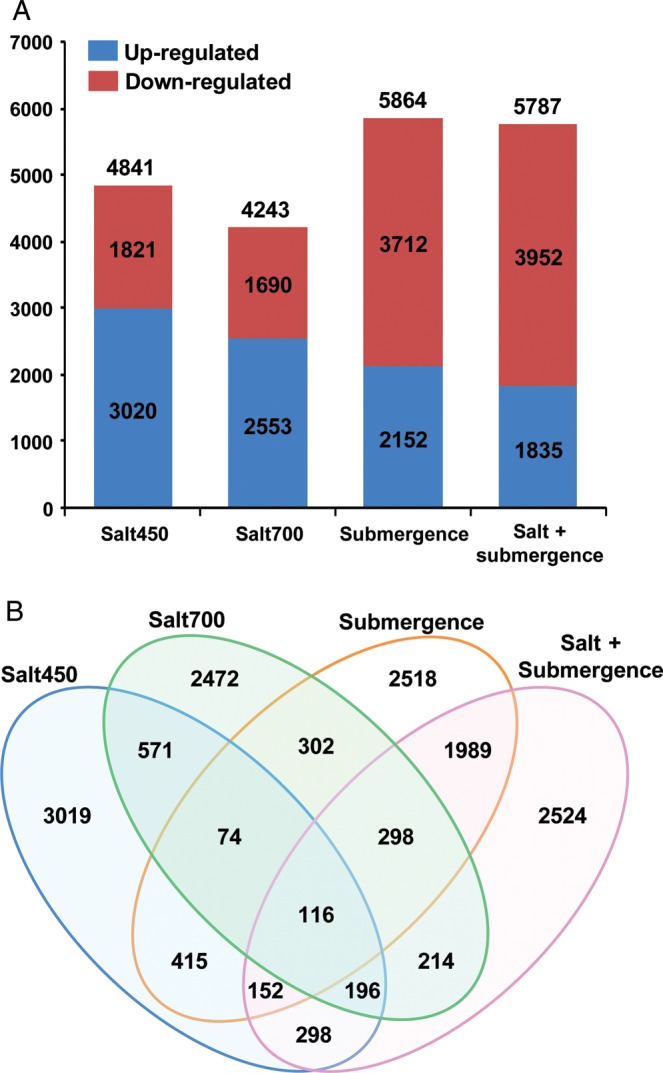
Differential gene expression under different stress conditions. (A) The number of up- and down-regulated genes under different stress conditions (salt450, salt700, submergence and salt + submergence) is shown in the bar graph. The total number of genes differentially expressed under each condition is given on the top of each bar. (B) Venn diagram showing the number of genes differentially expressed under specific or different stress conditions.
Furthermore, we identified genes showing overlapping or specific response to different stress conditions as depicted in Fig. 2B. Interestingly, a larger fraction of genes (69.5%) exhibited response to a specific stress condition. Other 4625 (30.5%) genes were responsive to more than one stress conditions. The largest number of genes (2555) was commonly regulated by submergence and salt + submergence stresses. Notably, most of them (99.6%) exhibited similar response (681 up-regulated and 1865 down-regulated) under both conditions. However, among the 790 genes commonly regulated by both high salinity and submergence stresses, most (78.2%) exhibited opposite responses (473 up-regulated under high salinity but down-regulated under submergence stress and 145 down-regulated under high salinity but up-regulated under submergence stress). Interestingly, however, 84% of the 757 genes commonly regulated by low salinity and submergence stresses exhibited similar response. Only 957 genes exhibited differential expression under both low and high salinity conditions, but most of them (94.6%) were regulated in the same direction. A very small fraction of genes (116) were differentially regulated under all the stress conditions analysed. Furthermore, we performed K-means clustering analysis and generated 10 clusters with different gene expression patterns across different stress conditions analysed (Supplementary Fig. S4). Among the clusters generated, we identified four groups of genes with distinct gene expression patterns (Fig. 3). Group I genes were up-regulated under salinity and/or salt + submergence stress. Group II genes were down-regulated under submergence and salt + submergence stress. Group III genes were up-regulated under submergence and salt + submergence stress. Group IV genes were up-regulated under salinity stress.
Figure 3.

K-means clustering of expression profiles of genes differentially expressed under different stress conditions. The clustering was performed on log2 fold change for each gene under different stress conditions when compared with under control condition. The genes exhibiting a similar pattern of expression under different stress conditions [salt450, salt700, submergence (sub) and salt + submergence (salt + sub)] have been grouped together in four distinct groups. The scale at the bottom shows log2 fold change. A colour version is available online.
3.5. Stress response of transcription factor genes
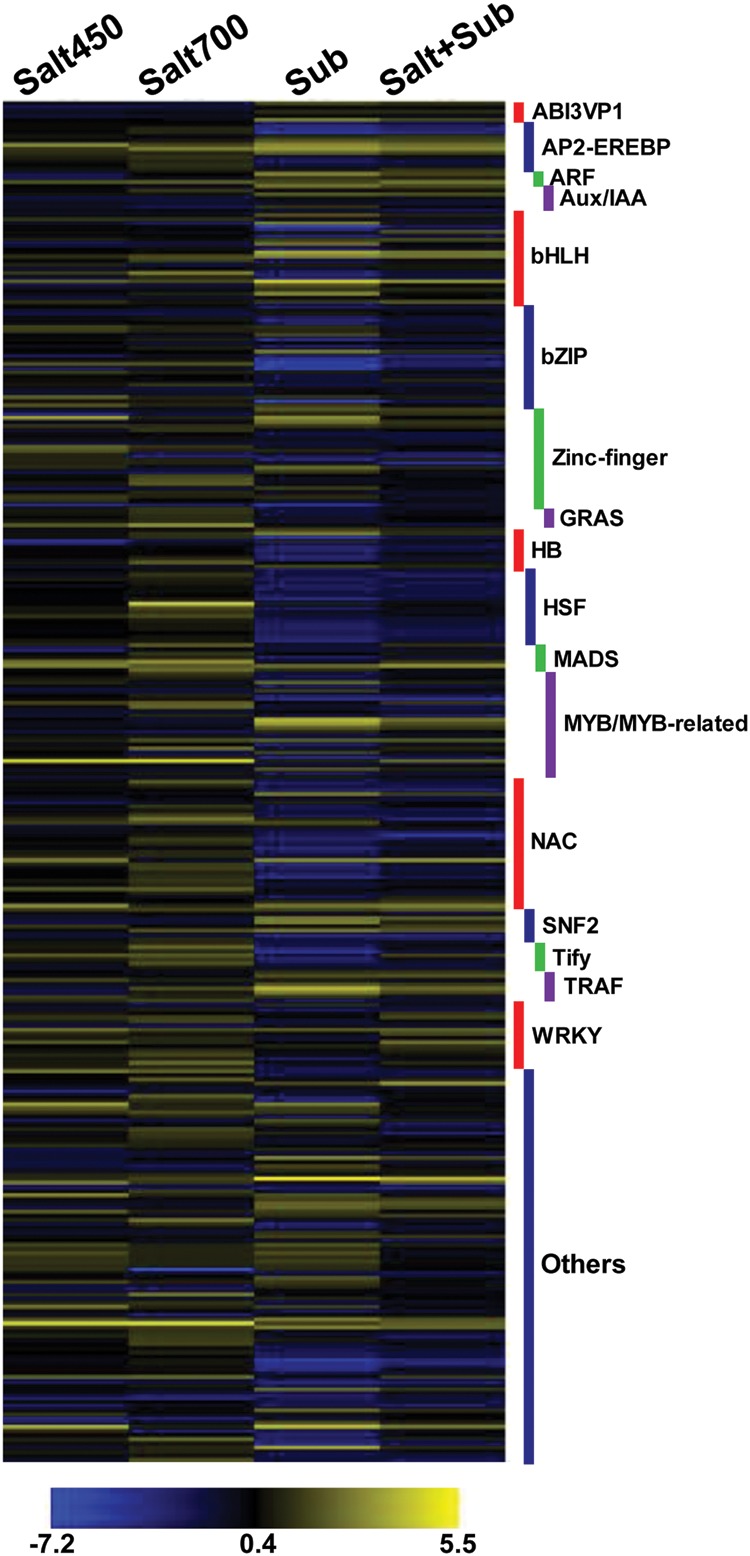
TFs are the regulatory proteins, which play a key role in stress responses. Remarkably, we detected the differential expression of at least 329 (∼12%) TF-encoding genes under different stress conditions in Porteresia. A heatmap showing the differential expression of genes belonging to different TF families is shown in Fig. 4. At least one member of 55 TF families exhibited differential expression. Among the various families, the largest number (32) of NAC TF family genes was differentially expressed. The members of other TF families, including MYB/MYB-related (25), bZIP (25), bHLH (23), HSF (18) and WRKY (17), were also significantly represented in the differentially expressed genes. A total of 96, 118, 132 and 127 TF genes exhibited differential expression under low salinity, high salinity, submergence and salt + submergence stress conditions, respectively. Among the 118 TF genes differentially expressed under high salinity stress, 88 were up-regulated and 30 were down-regulated. The members of NAC, MYB/MYB-related and WRKY families were the most abundant among these genes. In contrast, among the 132 TF genes differentially expressed under submergence stress, 44 were up-regulated and 88 were down-regulated. The members of bHLH, bZIP, HSF, NAC and MYB/MYB-related families were most abundant among these genes. In addition, several zinc-finger TFs of different classes were also regulated under different stress conditions. The members of these TF families have been found to be regulated under salinity and submergence stresses in Arabidopsis, rice and halophytes.33–35 Altogether, these data suggest the extensive regulation of transcription under salinity and submergence stress.
Figure 4.
Differential expression of TF-encoding genes under different conditions. Various TF families showing differential expression under different stress conditions [salt450, salt700, submergence (sub) and salt + submergence (salt + sub)] are given on the right side. The scale at the bottom represents log2 fold change. A colour version is available online.
3.6. Gene ontology and metabolic pathway enrichment analysis of stress-responsive genes
To investigate the major functional categories represented in the stress-responsive genes identified above, we performed GO enrichment analysis. Most evidently, besides response to stress, we found the GO terms associated with various metabolic processes, such as secondary metabolite (oxoacid, ketone, amino acid, oxylipin, flavonoid, phenylpropanoid and chorismate) biosynthesis and hormone (jasmonic acid, ethylene and abscisic acid, ABA) biosynthesis, were most enriched in the genes up-regulated under different stress conditions analysed (Fig. 5, Supplementary Fig. S5). In addition, the GO terms, photosynthesis, photorespiration, rRNA processing and transport were also found enriched in up-regulated genes. However, in the down-regulated genes under salinity stress, the GO terms associated with polysaccharide (glucan, carbohydrate and starch) metabolism were most significantly represented (Supplementary Figs S5 and S6). The genes with function in protein turn over (proteolysis, peptidase activity and proteasome assembly) were highly enriched under low salinity. Such genes have been found responsible for salinity stress adaptation in halophyte, T. halophila.33 Under submergence alone or along with salinity stress, the GO terms response to various stresses, response to ABA, generation of precursor metabolites and energy as well as rRNA metabolism were most enriched. The finding of up-regulation of genes associated with energy conservation via metabolism rearrangement to enhance ATP production and/or nullifying deleterious effects of oxygen radicals, reactive oxygen species and other toxic compounds under submergence has been reported earlier also.36,37 In addition, the GO terms, such as response to gibberellin stimulus, response to hydrogen per oxide and transport, were represented in the down-regulated genes under submergence stress (Supplementary Figs S5 and S6). The GO term, regulation of transcription, was also found enriched in the stress-responsive genes, which is consistent with differential expression of the large number of TF genes as described in previous section. Notably, we noticed the significant enrichment of cellular component GO term, cell wall, in the differentially expressed genes (Supplementary Fig. S7). The changes in transcript levels of a number of genes encoding cell wall-related proteins have been observed in halophyte, T. halophila, in response to abiotic stress conditions.35,38 Overall, the different groups of genes with distinct expression patterns were also found to be associated with similar GO terms (Supplementary Fig. S8). For instance, the GO terms, response to stress and hormones were enriched in Group II genes, whereas photosynthesis and secondary metabolite biosynthesis terms were most significant in Group III genes. Group IV genes were found enriched in tryptophan biosynthesis, cellular amino acid derivatives biosynthesis, response to jasmonic acid and cell death-related GO terms.
Figure 5.

GO enrichment under different stress conditions. Significantly, enriched GO categories in the up-regulated genes under high salinity (A) and submergence (B) stress are shown. The genes were analysed using BiNGO and the biological process terms showing significant enrichment are shown. Node size is proportional to the number of genes in each category and shades represent the significance level (white—no significant difference; scale, P = 0.05 to P < 0.0000005). A colour version is available online.
Many of the stress-responsive genes identified above encode for the enzymes involved in several metabolic pathways, which regulate diverse cellular processes. Therefore, we investigated the metabolic pathways significantly enriched in stress-responsive genes by integrating the stress-responsive gene set with metabolic pathway data available in the RiceCyc database. The pathways involved in amino acids biosynthesis, secondary metabolite biosynthesis, hormone biosynthesis, carbohydrate metabolism and cell wall structures were significantly overrepresented among stress-responsive genes (Fig. 6), which are in well agreement with GO enrichment analysis. A list of pathways affected under stress conditions are given in Supplementary Table S5. Most evidently, the genes involved in the biosynthesis of various amino acids, including tryptophan, valine, isoleucine, glycine, glutamate and serine, were significantly represented in stress-responsive genes. The pathways for various stress-related hormone biosynthesis, such as jasmonic acid, ethylene and ABA biosynthesis, were also enriched. The genes involved in jasmonic acid biosynthesis were up-regulated under salinity stress, whereas genes for ABA biosynthesis were up-regulated under salinity stress, but down-regulated under submergence stress (Fig. 6). The pathways involved in carbohydrate metabolism, such as starch degradation, trehalose biosynthesis and anaerobic respiration, were also overrepresented among the stress-responsive genes. The genes involved in anaerobic respiration were significantly up-regulated under submergence stress alone and along with salinity stress. The genes involved in anaerobic metabolism have been found regulated in response to submergence, flooding and O2 deprivation across the plant species too.35,39 Notably, the genes involved in cell wall structure biosynthesis, such as cellulose and suberin biosynthesis, were also significantly enriched. The pathways involved in serotonin amides biosynthesis, phenylpropanoid biosynthesis, phospholipase activity and fatty acid derivative biosynthesis were also found enriched. A similar set of metabolic pathways were significantly represented in the different groups of genes with distinct expression patterns (Supplementary Table S6).
Figure 6.

Regulation of metabolic pathways during salinity and submergence stress conditions. The metabolic pathways enriched in differentially expressed genes are shown. Heatmaps showing the expression profiles of genes involved in these pathways under different stress conditions [salt450, salt700, submergence (sub) and salt + submergence (salt + sub)] are also shown. The scale at the bottom represents log2 fold change. A colour version is available online.
Interestingly, we detected the differential expression of several genes in Porteresia implicated in SUB1A-mediated submergence tolerance response.40 In addition to the genes involved in ethylene response, carbohydrate metabolism, photorespiration and anaerobic respiration, we found putative gibberellin biosynthesis genes regulated under submergence stress, which mediates shoot elongation. The expression of Alcohol Dehydrogenase, a marker gene for anoxia stress, was also up-regulated under submergence stress, consistent with previous findings.35,40–42 We detected differential expression of several putative expansin genes as well under submergence and/or salt + submergence stress. The expansins have been shown to play a major role in cell expansion under anoxic condition, prevalent under submergence stress.35,42,43
3.7. Real-time PCR validation of differential gene expression
We validated the results of differential gene expression analysis obtained from RNA-seq data by real-time RT–PCR analysis. The expression of at least 10 randomly selected genes was analysed in the three biological replicates of five tissue samples representing different conditions. The analysis revealed similar expression pattern of all the selected genes in real-time PCR analysis as observed from RNA-seq data. The statistical analysis also showed very good correspondence (correlation coefficient of 0.792) among the results of real-time PCR and RNA-seq data analyses as shown in Fig. 7.
Figure 7.

Validation of differential gene expression results obtained by RNA-seq. The correlation of gene expression results obtained from real-time PCR analysis and RNA-seq for 10 selected genes is shown.
4. Discussion
Over the past many years, considerable efforts have been made to understand the molecular mechanism of salinity tolerance/adaptation in plants. Several studies have reported the molecular responses of plants to salinity stress.1–4,34 However, only a few studies have been performed to analyse the submergence response.35,36,40 In the recent years, study of wild halophyte relatives has gained attention as models to investigate the mechanism of salinity and submergence tolerance due to their extreme tolerance/adaptability to these conditions.5,6 However, most of such studies are confined to close relatives of Arabidopsis, T. halophila and T. parvula.14–16 Recently, the transcriptome of a salinity-tolerant wild tomato species has also been reported.44 However, considering the complexity of salinity response and fundamental differences in the physiology of monocots and dicots, these dicot halophytes are not ideal models to understand the mechanism of salinity tolerance in monocot crop plants. Recently, the importance of P. coarctata, wild halophyte relative rice, has been recognized as a model to study stress tolerance in monocots and important source of genes for the improvement of rice via biotechnological approaches.8
In the present study, we sequenced the transcriptome of Porteresia under different stress conditions using Illumina technology to explore its gene complement. Unexpectedly, Porteresia transcripts exhibited low similarity with rice proteins, suggesting significant differences between Porteresia and rice genomes. The similarity of Porteresia genes with rice was lower than that of other sequenced wild rice species.45,46 A substantial number of genes appeared specific to Porteresia because they do not have an ortholog in rice and other organisms as predicted based on the sequence similarity. Furthermore, we observed expansion or contraction of certain TF families in Porteresia vis-a-vis rice. This unique gene complement might provide means of stress adaptation in Porteresia. We identified a total of 15 158 genes responsive to salinity and/or submergence stress, which have been implicated in diverse biological processes and metabolic pathways. The genes involved in similar biological processes, such as photosynthesis, secondary metabolite biosynthesis, hormone biosynthesis, carbohydrate metabolism, cell wall-related enzymes and transport etc., have been implicated in salinity and/or submergence stress in Arabidopsis, rice and halophytes as well.33,35,38,40,41 A significant number of genes of unknown function were also differentially expressed under various stress conditions analysed, and many of these genes were presumably specific to Porteresia, which might also play a crucial role in stress adaptation.
Several studies have demonstrated that TFs act as key regulators of plant response to environmental stimuli.47–49 The role of certain TF families, such as AP2-EREBP, MYB and NAC, in stress responses has been well established. We also observed the differential expression of members of these TF families under salinity and submergence stresses in Porteresia. We detected that most of TF genes differentially expressed under salinity stress are up-regulated, whereas most of differentially expressed TF genes under submergence stress are down-regulated. This is in accordance with the total number of genes differentially expressed showing up- and down-regulation under salinity and submergence stresses. These results suggest that overall transcriptional activity is induced under salinity stress, but repressed under submergence stress. Based on the analyses, we found that role of NAC, MYB and WRKY family TFs may be more crucial for salinity tolerance, whereas bZIP, bHLH, HSF and AP2-EREBP families play a major role during submergence stress. The role of SUBMERGENCE1 (SUB1) QTL in submergence tolerance is well known, which harbour a tandem cluster of AP2/ERF family genes.40,41,50,51 Recently, Niroula et al.52 proposed the existence of SUB1-dependent and -independent mechanisms involved in submergence tolerance in wild rice plants. However, further investigations are required to find the exact mechanism of submergence tolerance in Porteresia.
Metabolic pathways maintain cellular homeostasis and are very important for imparting stress tolerance/adaptation in plants. We found significant enrichment of genes encoding key enzymes involved in important metabolic pathways under stress conditions in Porteresia. The production of secondary metabolites under stress condition has been well known as adaptive feature of plants. We also detected the enrichment of biosynthetic genes of certain secondary metabolites, such as hydroxycinnamic acid serotonin amides and phenylpropanoids etc., under stress conditions in Porteresia. Hydroxycinnamic acid serotonin amides have only been detected in rice, pepper and a few other plants so far and are supposed to act as antioxidants.53 Although their exact function is unclear, their antioxidant property may help encounter/adapt stress condition in Porteresia. Phenylpropanoid biosynthesis pathway of initial reactions (cinnamates biosynthesis) produces coumarate, which gives rise to a variety of secondary compounds such as flavonoids, stilbenes and lignin, which can help in protection against stress conditions.
The plant hormones, ethylene and ABA are well known to be involved in adaptive response to environmental stresses. Jasmonic acid has primarily been implicated in defence response, but is involved in other stress responses as well.54 Furthermore, the biosynthesis of several secondary metabolites by jasmonates has been well documented,55–57 suggesting that biosynthesis of jasmonates may impart stress tolerance in plants via transcriptional activation of biosynthetic pathway of important secondary metabolites. The enzymes involved in cyclic methionine salvage pathway, which ensures ethylene biosynthesis via methionine recycling, were enriched under salinity stress.58 We observed up-regulation of ethylene biosynthesis genes under salinity and submergence stresses. Earlier reports have also shown the altered ethylene levels underwater, which activates genes associated with stress acclimation.41,50,59 ABA is a well-known stress implicated in plant stress responses, including salinity stress.60–63 The increased accumulation of ABA under salinity stress has been reported, which, in turn, activates several other genes to provide tolerance. However, under submergence stress, the levels of ABA are reduced.64 We also observed the down-regulation of ABA biosynthesis genes under submergence stress. Recently, it has been proposed that SUB1A gene delays leaf senescence via hormonal regulation, which can contribute to enhanced stress tolerance in rice.59
The enrichment of various pathways related to carbohydrate metabolism, such as starch degradation, anaerobic respiration and trehalose biosynthesis, is in concordance with earlier reports, demonstrating that concentrations of soluble sugars increases under various abiotic stress conditions.65,66 The differential expression of genes related to carbohydrate metabolism in response to various abiotic stresses has been reported previously also.67 The sugars, sucrose and glucose either act as substrates for cellular respiration or act as osmolytes to maintain cell homeostasis.68,69 In fact, one of the present hypotheses for survival of rice under submergence stress is based on carbohydrate metabolism only.41,51,70 Trehalose has been proposed as osmoprotectant against various stresses. It has been demonstrated that accumulation of trehalose in rice plants results in increased soluble sugar content, which confers tolerance to different abiotic stresses.71,72 Furthermore, the elevated transcript levels of the genes associated with anaerobic respiration can allow plant cells to invoke the energy conserving mode of ATP production under submergence stress in Porteresia as speculated earlier.12,35 Recently, Miro and Ismail12 reviewed anaerobic respiration and starch degradation as the main traits associated with flooding tolerance in rice genotypes.
The biosynthetic pathways for suberin and cellulose, major constituents of cell wall, were also found enriched in stress-responsive genes in Porteresia. Although the exact mechanism is not known, several studies have suggested a crucial role of cell wall in stress tolerance.73 The mutations in cellulose synthase genes have also been shown to alter stress tolerance in plants.74,75 Suberin is a primary constituent of primary cell wall of underground tissues and is analogous to cutin, which forms a layer on plant aerial parts to prevent the direct contact of epidermal cell with environment and thus, acts as a physical barrier to enhance plant resistance to abiotic stress. Based on the analysis of cutin biosynthesis mutants, it has been demonstrated that plant cuticle is required for the regulation of ABA biosynthesis and osmotic stress tolerance.76 Considering the similar biochemical nature of suberin and cutin, the increased biosynthesis of suberin may be crucial for stress tolerance in Porteresia. Furthermore, the characterization of enhanced submergence 1 (esb1) mutant provided evidence for the role of suberin in water balance, ion translocation and stress tolerance.77,78 Thus, alteration in the degree of suberization may result in improved stress tolerance in plants. Overall, it can be concluded that a well-organized transcriptional regulation is responsible for salinity and submergence tolerance in Porteresia. It will be very tempting to investigate the precise role of genes involved in the metabolic pathways enriched during salinity and submergence stresses in Porteresia. The genetic engineering of such candidate genes/pathways may confer stress tolerance in crop plants.
In conclusion, we report the transcriptome sequence of wild halophyte rice, Porteresia. The results suggest that extensive transcriptional reprogramming under salinity and submergence stresses is responsible for tolerance to these stresses in Porteresia. The transcriptome analyses presented in this study provide several candidate genes involved in salinity and submergence tolerance, which can be used as potential targets for genetic engineering and opens new avenues for future investigations. The functional analyses of genes/pathways identified here along with investigations on non-coding regulatory RNAs, epigenetic modifications, biochemical complexity and metabolite profiling would be very useful to help understand the exact mechanism of salinity and submergence tolerance in Porteresia.
Supplementary data
Supplementary data are available at www.dnaresearch.oxfordjournals.org.
Funding
This work was financially supported by the core grant from NIPGR. R.G. acknowledges INSPIRE Faculty Award from the Department of Science and Technology and Innovative Young Biotechnologists Award from the Department of Biotechnology, Government of India. R.S. acknowledges the Department of Biotechnology, Government of India, for research fellowship.
Supplementary Material
Acknowledgements
We are thankful to the anonymous reviewers for their invaluable suggestions.
Footnotes
Edited by Dr Masahiro Yano
References
- 1.Walia H., Wilson C., Zeng L., Ismail A.M., Condamine P., Close T.J. Genome-wide transcriptional analysis of salinity stressed japonica and indica rice genotypes during panicle initiation stage. Plant Mol. Biol. 2007;63:609–23. doi: 10.1007/s11103-006-9112-0. doi:10.1007/s11103-006-9112-0. [DOI] [PMC free article] [PubMed] [Google Scholar]
- 2.Kumari S., Sabharwal V.P., Kushwaha H.R., Sopory S.K., Singla-Pareek S.L., Pareek A. Transcriptome map for seedling stage specific salinity stress response indicates a specific set of genes as candidate for saline tolerance in Oryza sativa L. Funct. Integr. Genomics. 2009;9:109–23. doi: 10.1007/s10142-008-0088-5. doi:10.1007/s10142-008-0088-5. [DOI] [PubMed] [Google Scholar]
- 3.Cotsaftis O., Plett D., Johnson A.A., et al. Root-specific transcript profiling of contrasting rice genotypes in response to salinity stress. Mol. Plant. 2011;4:25–41. doi: 10.1093/mp/ssq056. doi:10.1093/mp/ssq056. [DOI] [PubMed] [Google Scholar]
- 4.Mizuno H., Kawahara Y., Sakai H., et al. Massive parallel sequencing of mRNA in identification of unannotated salinity stress-inducible transcripts in rice (Oryza sativa L.) BMC Genomics. 2010;11:683. doi: 10.1186/1471-2164-11-683. doi:10.1186/1471-2164-11-683. [DOI] [PMC free article] [PubMed] [Google Scholar]
- 5.Colmer T.D., Flowers T.J. Flooding tolerance in halophytes. New Phytol. 2008;179:964–74. doi: 10.1111/j.1469-8137.2008.02483.x. doi:10.1111/j.1469-8137.2008.02483.x. [DOI] [PubMed] [Google Scholar]
- 6.Flowers T.J., Colmer T.D. Salinity tolerance in halophytes. New Phytol. 2008;179:945–63. doi: 10.1111/j.1469-8137.2008.02531.x. doi:10.1111/j.1469-8137.2008.02531.x. [DOI] [PubMed] [Google Scholar]
- 7.Amtmann A., Bohnert H.J., Bressan R.A. Abiotic stress and plant genome evolution. Search for new models. Plant Physiol. 2005;138:127–30. doi: 10.1104/pp.105.059972. doi:10.1104/pp.105.059972. [DOI] [PMC free article] [PubMed] [Google Scholar]
- 8.Sengupta S., Majumder A.L. Porteresia coarctata (Roxb.) Tateoka: a wild rice a potential model for studying salt-stress biology in rice. Plant Cell Environ. 2010;33:526–42. doi: 10.1111/j.1365-3040.2009.02054.x. doi:10.1111/j.1365-3040.2009.02054.x. [DOI] [PubMed] [Google Scholar]
- 9.Bal A.R., Dutt S.K. Mechanisms of salt tolerance in wild rice (Oryza coarctata Roxb.) Plant Soil. 1986;92:399–404. doi:10.1007/BF02372487. [Google Scholar]
- 10.Moons A., Bauw G., Prinsen E., Van Montagu M., Van der Straeten D. Molecular and physiological responses to abscisic acid and salts in roots of salt-sensitive and salt-tolerant Indica rice varieties. Plant Physiol. 1995;107:177–86. doi: 10.1104/pp.107.1.177. doi:10.1104/pp.107.1.177. [DOI] [PMC free article] [PubMed] [Google Scholar]
- 11.Platten J.D., Egdane J.A., Ismail A.M. Salinity tolerance, Na+ exclusion and allele mining of HKT1;5 in Oryza sativa and O. glaberrima: many sources, many genes, one mechanism? BMC Plant Biol. 2013;13:32. doi: 10.1186/1471-2229-13-32. doi:10.1186/1471-2229-13-32. [DOI] [PMC free article] [PubMed] [Google Scholar]
- 12.Miro B., Ismail A.M. Tolerance of anaerobic conditions caused by flooding during germination and early growth in rice (Oryza sativa L.) Front. Plant Sci. 2013;4:269. doi: 10.3389/fpls.2013.00269. doi:10.3389/fpls.2013.00269. [DOI] [PMC free article] [PubMed] [Google Scholar]
- 13.Latha R., Rubia L., Bennett J., Swaminathan M.S. Allele mining for stress tolerance genes in Oryza species and related germplasm. Mol. Biotechnol. 2004;27:101–8. doi: 10.1385/MB:27:2:101. doi:10.1385/MB:27:2:101. [DOI] [PubMed] [Google Scholar]
- 14.Inan G., Zhang Q., Li P., et al. Salt cress. A halophyte and cryophyte Arabidopsis relative model system and its applicability to molecular genetic analyses of growth and development of extremophiles. Plant Physiol. 2004;135:1718–37. doi: 10.1104/pp.104.041723. doi:10.1104/pp.104.041723. [DOI] [PMC free article] [PubMed] [Google Scholar]
- 15.Oh D.H., Dassanayake M., Haas J.S., et al. Genome structures and halophyte-specific gene expression of the extremophile Thellungiella parvula in comparison with Thellungiella salsuginea (Thellungiella halophila) and Arabidopsis. Plant Physiol. 2010;154:1040–52. doi: 10.1104/pp.110.163923. doi:10.1104/pp.110.163923. [DOI] [PMC free article] [PubMed] [Google Scholar]
- 16.Wu H.J., Zhang Z., Wang J.Y., et al. Insights into salt tolerance from the genome of Thellungiella salsuginea. Proc. Natl. Acad. Sci. USA. 2012;109:12219–24. doi: 10.1073/pnas.1209954109. doi:10.1073/pnas.1209954109. [DOI] [PMC free article] [PubMed] [Google Scholar]
- 17.Majee M., Maitra S., Dastidar K.G., et al. A novel salt-tolerant L-myo-inositol-1-phosphate synthase from Porteresia coarctata (Roxb.) Tateoka, a halophytic wild rice molecular cloning, bacterial overexpression, characterization, and functional introgression into tobacco-conferring salt tolerance phenotype. J. Biol. Chem. 2004;279:28539–52. doi: 10.1074/jbc.M310138200. doi:10.1074/jbc.M310138200. [DOI] [PubMed] [Google Scholar]
- 18.Sengupta S., Patra B., Ray S., Majumder A.L. Inositol methyl transferase from a halophytic wild rice, Porteresia coarctata Roxb. (Tateoka) regulation of pinitol synthesis under abiotic stress. Plant Cell Environ. 2008;31:1442–59. doi: 10.1111/j.1365-3040.2008.01850.x. doi:10.1111/j.1365-3040.2008.01850.x. [DOI] [PubMed] [Google Scholar]
- 19.Morozova O., Hirst M., Marra M.A. Applications of new sequencing technologies for transcriptome analysis. Annu. Rev. Genomics Human Genet. 2009;10:135–51. doi: 10.1146/annurev-genom-082908-145957. doi:10.1146/annurev-genom-082908-145957. [DOI] [PubMed] [Google Scholar]
- 20.Jain M. A next generation approach to the characterization of a non-model plant transcriptome. Curr. Sci. 2011;101:1435–9. [Google Scholar]
- 21.Jhanwar S., Priya P., Garg R., Parida S.K., Tyagi A.K., Jain M. Transcriptome sequencing of wild chickpea as a rich resource for marker development. Plant Biotechnol. J. 2012;10:690–702. doi: 10.1111/j.1467-7652.2012.00712.x. doi:10.1111/j.1467-7652.2012.00712.x. [DOI] [PubMed] [Google Scholar]
- 22.Patel R.K., Jain M. NGS QC Toolkit: a toolkit for quality control of next generation sequencing data. PLoS One. 2012;7:e30619. doi: 10.1371/journal.pone.0030619. doi:10.1371/journal.pone.0030619. [DOI] [PMC free article] [PubMed] [Google Scholar]
- 23.Garg R., Patel R.K., Jhanwar S., et al. Gene discovery and tissue-specific transcriptome analysis in chickpea with massively parallel pyrosequencing and web resource development. Plant Physiol. 2011;156:1661–78. doi: 10.1104/pp.111.178616. doi:10.1104/pp.111.178616. [DOI] [PMC free article] [PubMed] [Google Scholar]
- 24.Kawahara Y., de la Bastide M., Hamilton J.P., et al. Improvement of the Oryza sativa Nipponbare reference genome using next generation sequence and optical map data. Rice. 2013;6:4. doi: 10.1186/1939-8433-6-4. doi:10.1186/1939-8433-6-4. [DOI] [PMC free article] [PubMed] [Google Scholar]
- 25.Anders S., Huber W. Differential expression analysis for sequence count data. Genome Biol. 2010;11:R106. doi: 10.1186/gb-2010-11-10-r106. doi:10.1186/gb-2010-11-10-r106. [DOI] [PMC free article] [PubMed] [Google Scholar]
- 26.Maere S., Heymans K., Kuiper M. BiNGO: a Cytoscape plugin to assess overrepresentation of gene ontology categories in biological networks. Bioinformatics. 2005;21:3448–9. doi: 10.1093/bioinformatics/bti551. doi:10.1093/bioinformatics/bti551. [DOI] [PubMed] [Google Scholar]
- 27.Jaiswal P., Ni J., Yap I., et al. Gramene a bird's eye view of cereal genomes. Nucleic Acids Res. 2006;34:D717–723. doi: 10.1093/nar/gkj154. doi:10.1093/nar/gkj154. [DOI] [PMC free article] [PubMed] [Google Scholar]
- 28.Garg R., Sahoo A., Tyagi A.K., Jain M. Validation of internal control genes for quantitative gene expression studies in chickpea (Cicer arietinum L.) Biochem. Biophys. Res. Commun. 2010;396:283–8. doi: 10.1016/j.bbrc.2010.04.079. doi:10.1016/j.bbrc.2010.04.079. [DOI] [PubMed] [Google Scholar]
- 29.Jain M., Nijhawan A., Tyagi A.K., Khurana J.P. Validation of housekeeping genes as internal control for studying gene expression in rice by quantitative real-time PCR. Biochem. Biophys. Res. Commun. 2006;345:646–51. doi: 10.1016/j.bbrc.2006.04.140. doi:10.1016/j.bbrc.2006.04.140. [DOI] [PubMed] [Google Scholar]
- 30.Agarwal G., Jhanwar S., Priya P., et al. Comparative analysis of kabuli chickpea transcriptome with desi and wild chickpea provides a rich resource for development of functional markers. PLoS One. 2012;7:e52443. doi: 10.1371/journal.pone.0052443. doi:10.1371/journal.pone.0052443. [DOI] [PMC free article] [PubMed] [Google Scholar]
- 31.Ozsolak F., Milos P.M. RNA sequencing advances, challenges and opportunities. Nat. Rev. Genet. 2011;12:87–98. doi: 10.1038/nrg2934. doi:10.1038/nrg2934. [DOI] [PMC free article] [PubMed] [Google Scholar]
- 32.Jain M. Next-generation sequencing technologies for gene expression profiling in plants. Brief Funct. Genomics. 2012;11:63–70. doi: 10.1093/bfgp/elr038. doi:10.1093/bfgp/elr038. [DOI] [PubMed] [Google Scholar]
- 33.Gong Q., Li P., Ma S., Indu Rupassara S., Bohnert H.J. Salinity stress adaptation competence in the extremophile Thellungiella halophila in comparison with its relative Arabidopsis thaliana. Plant J. 2005;44:826–39. doi: 10.1111/j.1365-313X.2005.02587.x. doi:10.1111/j.1365-313X.2005.02587.x. [DOI] [PubMed] [Google Scholar]
- 34.Munns R., Tester M. Mechanisms of salinity tolerance. Annu. Rev. Plant Biol. 2008;59:651–81. doi: 10.1146/annurev.arplant.59.032607.092911. doi:10.1146/annurev.arplant.59.032607.092911. [DOI] [PubMed] [Google Scholar]
- 35.Lee S.C., Mustroph A., Sasidharan R., et al. Molecular characterization of the submergence response of the Arabidopsis thaliana ecotype Columbia. New Phytol. 2011;190:457–71. doi: 10.1111/j.1469-8137.2010.03590.x. doi:10.1111/j.1469-8137.2010.03590.x. [DOI] [PubMed] [Google Scholar]
- 36.Voesenek L.A., Colmer T.D., Pierik R., Millenaar F.F., Peeters A.J. How plants cope with complete submergence. New Phytol. 2006;170:213–26. doi: 10.1111/j.1469-8137.2006.01692.x. doi:10.1111/j.1469-8137.2006.01692.x. [DOI] [PubMed] [Google Scholar]
- 37.Vashisht D., Hesselink A., Pierik R., et al. Natural variation of submergence tolerance among Arabidopsis thaliana accessions. New Phytol. 2011;190:299–310. doi: 10.1111/j.1469-8137.2010.03552.x. doi:10.1111/j.1469-8137.2010.03552.x. [DOI] [PubMed] [Google Scholar]
- 38.Wong C.E., Li Y., Labbe A., et al. Transcriptional profiling implicates novel interactions between abiotic stress and hormonal responses in Thellungiella, a close relative of Arabidopsis. Plant Physiol. 2006;140:1437–50. doi: 10.1104/pp.105.070508. doi:10.1104/pp.105.070508. [DOI] [PMC free article] [PubMed] [Google Scholar]
- 39.Mustroph A., Lee S.C., Oosumi T., et al. Cross-kingdom comparison of transcriptomic adjustments to low-oxygen stress highlights conserved and plant-specific responses. Plant Physiol. 2010;152:1484–500. doi: 10.1104/pp.109.151845. doi:10.1104/pp.109.151845. [DOI] [PMC free article] [PubMed] [Google Scholar]
- 40.Jung K.H., Seo Y.S., Walia H., et al. The submergence tolerance regulator Sub1A mediates stress-responsive expression of AP2/ERF transcription factors. Plant Physiol. 2010;152:1674–92. doi: 10.1104/pp.109.152157. doi:10.1104/pp.109.152157. [DOI] [PMC free article] [PubMed] [Google Scholar]
- 41.Fukao T., Xu K., Ronald P.C., Bailey-Serres J. A variable cluster of ethylene response factor-like genes regulates metabolic and developmental acclimation responses to submergence in rice. Plant Cell. 2006;18:2021–34. doi: 10.1105/tpc.106.043000. doi:10.1105/tpc.106.043000. [DOI] [PMC free article] [PubMed] [Google Scholar]
- 42.Lasanthi-Kudahettige R., Magneschi L., Loreti E., et al. Transcript profiling of the anoxic rice coleoptile. Plant Physiol. 2007;144:218–31. doi: 10.1104/pp.106.093997. doi:10.1104/pp.106.093997. [DOI] [PMC free article] [PubMed] [Google Scholar]
- 43.Huang J., Takano T., Akita S. Expression of alpha-expansin genes in young seedlings of rice (Oryza sativa L.) Planta. 2000;211:467–73. doi: 10.1007/s004250000311. doi:10.1007/s004250000311. [DOI] [PubMed] [Google Scholar]
- 44.Sun W., Xu X., Zhu H., et al. Comparative transcriptomic profiling of a salt-tolerant wild tomato species and a salt-sensitive tomato cultivar. Plant Cell Physiol. 2010;51:997–1006. doi: 10.1093/pcp/pcq056. doi:10.1093/pcp/pcq056. [DOI] [PubMed] [Google Scholar]
- 45.Sakai H., Ikawa H., Tanaka T., et al. Distinct evolutionary patterns of Oryza glaberrima deciphered by genome sequencing and comparative analysis. Plant J. 2011;66:796–805. doi: 10.1111/j.1365-313X.2011.04539.x. doi:10.1111/j.1365-313X.2011.04539.x. [DOI] [PMC free article] [PubMed] [Google Scholar]
- 46.Chen J., Huang Q., Gao D., et al. Whole-genome sequencing of Oryza brachyantha reveals mechanisms underlying Oryza genome evolution. Nat Commun. 2013;4:1595. doi: 10.1038/ncomms2596. doi:10.1038/ncomms2596. [DOI] [PMC free article] [PubMed] [Google Scholar]
- 47.Yamaguchi-Shinozaki K., Shinozaki K. Transcriptional regulatory networks in cellular responses and tolerance to dehydration and cold stresses. Annu. Rev. Plant Biol. 2006;57:781–803. doi: 10.1146/annurev.arplant.57.032905.105444. doi:10.1146/annurev.arplant.57.032905.105444. [DOI] [PubMed] [Google Scholar]
- 48.Nakashima K., Ito Y., Yamaguchi-Shinozaki K. Transcriptional regulatory networks in response to abiotic stresses in Arabidopsis and grasses. Plant Physiol. 2009;149:88–95. doi: 10.1104/pp.108.129791. doi:10.1104/pp.108.129791. [DOI] [PMC free article] [PubMed] [Google Scholar]
- 49.Bhattacharjee A., Jain M. Transcription factor mediated abiotic stress signaling in rice. Plant Stress. 2013;7:16–25. [Google Scholar]
- 50.Fukao T., Harris T., Bailey-Serres J. Evolutionary analysis of the Sub1 gene cluster that confers submergence tolerance to domesticated rice. Ann. Bot. 2009;103:143–50. doi: 10.1093/aob/mcn172. doi:10.1093/aob/mcn172. [DOI] [PMC free article] [PubMed] [Google Scholar]
- 51.Xu K., Xu X., Fukao T., et al. Sub1A is an ethylene-response-factor-like gene that confers submergence tolerance to rice. Nature. 2006;442:705–8. doi: 10.1038/nature04920. doi:10.1038/nature04920. [DOI] [PubMed] [Google Scholar]
- 52.Niroula R.K., Pucciariello C., Ho V.T., Novi G., Fukao T., Perata P. SUB1A-dependent and -independent mechanisms are involved in the flooding tolerance of wild rice species. Plant J. 2012;72:282–93. doi: 10.1111/j.1365-313X.2012.05078.x. doi:10.1111/j.1365-313X.2012.05078.x. [DOI] [PubMed] [Google Scholar]
- 53.Jang S.M., Ishihara A., Back K. Production of coumaroylserotonin and feruloylserotonin in transgenic rice expressing pepper hydroxycinnamoyl-coenzyme aserotonin N-(hydroxycinnamoyl) transferase. Plant Physiol. 2004;135:346–56. doi: 10.1104/pp.103.038372. doi:10.1104/pp.103.038372. [DOI] [PMC free article] [PubMed] [Google Scholar]
- 54.Wasternack C. Jasmonates an update on biosynthesis, signal transduction and action in plant stress response, growth and development. Ann. Bot. 2007;100:681–97. doi: 10.1093/aob/mcm079. doi:10.1093/aob/mcm079. [DOI] [PMC free article] [PubMed] [Google Scholar]
- 55.Goossens A., Häkkinen S.T., Laakso I., et al. A functional genomics approach toward the understanding of secondary metabolism in plant cells. Proc. Natl Acad. Sci. USA. 2003;100:8595–600. doi: 10.1073/pnas.1032967100. doi:10.1073/pnas.1032967100. [DOI] [PMC free article] [PubMed] [Google Scholar]
- 56.van der Fits L., Memelink J. ORCA3, a jasmonate-responsive transcriptional regulator of plant primary and secondary metabolism. Science. 2000;289:295–7. doi: 10.1126/science.289.5477.295. doi:10.1126/science.289.5477.295. [DOI] [PubMed] [Google Scholar]
- 57.Sasaki-Sekimoto Y., Taki N., Obayashi T., et al. Coordinated activation of metabolic pathways for antioxidants and defence compounds by jasmonates and their roles in stress tolerance in Arabidopsis. Plant J. 2005;44:653–68. doi: 10.1111/j.1365-313X.2005.02560.x. doi:10.1111/j.1365-313X.2005.02560.x. [DOI] [PubMed] [Google Scholar]
- 58.Bürstenbinder K., Rzewuski G., Wirtz M., Hell R., Sauter M. The role of methionine recycling for ethylene synthesis in Arabidopsis. Plant J. 2007;49:238–49. doi: 10.1111/j.1365-313X.2006.02942.x. doi:10.1111/j.1365-313X.2006.02942.x. [DOI] [PubMed] [Google Scholar]
- 59.Fukao T., Yeung E., Bailey-Serres J. The submergence tolerance gene SUB1A delays leaf senescence under prolonged darkness through hormonal regulation in rice. Plant Physiol. 2012;160:1795–807. doi: 10.1104/pp.112.207738. doi:10.1104/pp.112.207738. [DOI] [PMC free article] [PubMed] [Google Scholar]
- 60.Xiong L., Zhu J.K. Regulation of abscisic acid biosynthesis. Plant Physiol. 2003;133:29–36. doi: 10.1104/pp.103.025395. doi:10.1104/pp.103.025395. [DOI] [PMC free article] [PubMed] [Google Scholar]
- 61.Verslues P.E., Zhu J.K. Before and beyond ABA upstream sensing and internal signals that determine ABA accumulation and response under abiotic stress. Biochem. Soc. Trans. 2005;33:375–9. doi: 10.1042/BST0330375. doi:10.1042/BST0330375. [DOI] [PubMed] [Google Scholar]
- 62.Tuteja N. Mechanisms of high salinity tolerance in plants. Methods Enzymol. 2007;428:419–38. doi: 10.1016/S0076-6879(07)28024-3. [DOI] [PubMed] [Google Scholar]
- 63.Cutler S.R., Rodriguez P.L., Finkelstein R.R., Abrams S.R. Abscisic acid emergence of a core signaling network. Annu. Rev. Plant Biol. 2010;61:651–79. doi: 10.1146/annurev-arplant-042809-112122. doi:10.1146/annurev-arplant-042809-112122. [DOI] [PubMed] [Google Scholar]
- 64.Saika H., Okamoto M., Miyoshi K., et al. Ethylene promotes submergence-induced expression of OsABA8ox1, a gene that encodes ABA 8′-hydroxylase in rice. Plant Cell Physiol. 2007;4:287–98. doi: 10.1093/pcp/pcm003. [DOI] [PubMed] [Google Scholar]
- 65.Dubey R.S., Singh A.K. Salinity induces accumulation of soluble sugars and alters the activity of sugar metabolizing enzymes in rice plants. Biol. Plant. 1999;42:233–9. doi:10.1023/A:1002160618700. [Google Scholar]
- 66.Gill P.K., Sharma A.D., Singh P., Bhullar S.S. Effect of various abiotic stresses on the growth, soluble sugars and water relations of sorghum seedlings grown in light and darkness. Bulg. J. Plant Physiol. 2001;27:72–84. [Google Scholar]
- 67.Seki M., Narusaka M., Ishida J., et al. Monitoring the expression profiles of 7000 Arabidopsis genes under drought, cold and high-salinity stresses using a full-length cDNA microarray. Plant J. 2002;31:279–92. doi: 10.1046/j.1365-313x.2002.01359.x. doi:10.1046/j.1365-313X.2002.01359.x. [DOI] [PubMed] [Google Scholar]
- 68.Gupta A.K., Kaur N. Sugar signalling and gene expression in relation to carbohydrate metabolism under abiotic stresses in plants. J. Biosci. 2005;30:761–76. doi: 10.1007/BF02703574. doi:10.1007/BF02703574. [DOI] [PubMed] [Google Scholar]
- 69.Rosa M., Prado C., Podazza G., et al. Soluble sugars—metabolism, sensing and abiotic stress a complex network in the life of plants. Plant Signal. Behav. 2009;4:388–93. doi: 10.4161/psb.4.5.8294. doi:10.4161/psb.4.5.8294. [DOI] [PMC free article] [PubMed] [Google Scholar]
- 70.Voesenek L.A., Bailey-Serres J. Plant biology genetics of high-rise rice. Nature. 2009;460:959–60. doi: 10.1038/460959a. doi:10.1038/460959a. [DOI] [PubMed] [Google Scholar]
- 71.Garg A.K., Kim J.K., Owens T.G., et al. Trehalose accumulation in rice plants confers high tolerance levels to different abiotic stresses. Proc. Natl. Acad. Sci. USA. 2002;99:15898–903. doi: 10.1073/pnas.252637799. doi:10.1073/pnas.252637799. [DOI] [PMC free article] [PubMed] [Google Scholar]
- 72.Redillas M.C.F.R., Park S-H., Lee J.W., et al. Accumulation of trehalose increases soluble sugar contents in rice plants conferring tolerance to drought and salt stress. Plant Biotechnol. Rep. 2012;6:89–96. doi:10.1007/s11816-011-0210-3. [Google Scholar]
- 73.Koiwa H. Pathways and genetic determinants for cell wall-based osmotic stress tolerance in the Arabidopsis thaliana root system. In: Jenks M.A., Wood A.J., editors. Genes for plant abiotic stress. Oxford, UK: Wiley-Blackwell; 2009. Ch. 2. [Google Scholar]
- 74.Chen Z., Hong X., Zhang H., et al. Disruption of the cellulose synthase gene, AtCesA8/IRX1, enhances drought and osmotic stress tolerance in Arabidopsis. Plant J. 2005;43:273–83. doi: 10.1111/j.1365-313X.2005.02452.x. doi:10.1111/j.1365-313X.2005.02452.x. [DOI] [PubMed] [Google Scholar]
- 75.Zhu J., Lee B.H., Dellinger M., et al. A cellulose synthase-like protein is required for osmotic stress tolerance in Arabidopsis. Plant J. 2010;63:128–40. doi: 10.1111/j.1365-313X.2010.04227.x. [DOI] [PMC free article] [PubMed] [Google Scholar]
- 76.Wang Z.Y., Xiong L., Li W., Zhu J.K., Zhu J. The plant cuticle is required for osmotic stress regulation of abscisic acid biosynthesis and osmotic stress tolerance in Arabidopsis. Plant Cell. 2011;23:1971–84. doi: 10.1105/tpc.110.081943. doi:10.1105/tpc.110.081943. [DOI] [PMC free article] [PubMed] [Google Scholar]
- 77.Baxter I., Hosmani P.S., Rus A., et al. Root suberin forms an extracellular barrier that affects water relations and mineral nutrition in Arabidopsis. PLoS Genet. 2009;5:e1000492. doi: 10.1371/journal.pgen.1000492. doi:10.1371/journal.pgen.1000492. [DOI] [PMC free article] [PubMed] [Google Scholar]
- 78.Franke R.B., Dombrink I., Schreiber L. Suberin goes genomics use of a short living plant to investigate a long lasting polymer. Front. Plant Sci. 2012;3:4. doi: 10.3389/fpls.2012.00004. doi:10.3389/fpls.2012.00004. [DOI] [PMC free article] [PubMed] [Google Scholar]
Associated Data
This section collects any data citations, data availability statements, or supplementary materials included in this article.