Abstract
A highly-automated method for the segmentation of airways in serial block-face cryomicrotome images of rat lungs is presented. First, a point inside of the trachea is manually specified. Then, a set of candidate airway centerline points is automatically identified. By utilizing a novel path extraction method, a centerline path between the root of the airway tree and each point in the set of candidate centerline points is obtained. Local disturbances are robustly handled by a novel path extraction approach, which avoids the shortcut problem of standard minimum cost path algorithms. The union of all centerline paths is utilized to generate an initial airway tree structure, and a pruning algorithm is applied to automatically remove erroneous subtrees or branches. Finally, a surface segmentation method is used to obtain the airway lumen.
The method was validated on five image volumes of Sprague-Dawley rats. Based on an expert-generated independent standard, an assessment of airway identification and lumen segmentation performance was conducted. The average of airway detection sensitivity was 87.4% with a 95% confidence interval (CI) of (84.9, 88.6)%. A plot of sensitivity as a function of airway radius is provided. The combined estimate of airway detection specificity was 100% with a 95% CI of (99.4, 100)%. The average number and diameter of terminal airway branches was 1179 and 159 μm, respectively. Segmentation results include airways up to 31 generations. The regression intercept and slope of airway radius measurements derived from final segmentations were estimated to be 7.22 μm and 1.005, respectively. The developed approach enables quantitative studies of physiology and lung diseases in rats, requiring detailed geometric airway models.
Keywords: airway segmentation, rat lung, serial block-face imaging cryomicrotome
I. Introduction
Mice and rats are the primary laboratory animal models used to study exposure to cigarette smoke, air pollution and airborne chemicals. Computer modeling of these exposures require detailed and anatomically correct geometries of the airway trees in these animals [1]. Traditional approaches using corrosion casting and hand measurements are time consuming and too tedious to measure every airway segment. Modern imaging methods using micro-CT scanning and magnetic resonance imaging (MRI) in living animals provide digital information but at a lower spatial resolution. Most recently, investigators have combined corrosion methods with micro-CT scanning to obtain high-resolution geometries.
In this work, we utilize a serial block-face imaging cryomicrotome to acquire digital images of rat lungs, because of its high-resolution capabilities in combination with the option to measure regional deposition of fluorescent aerosols and/or microspheres. Consequently, this imaging method enables us to obtain function and structure from the same animal [2], [3]. For example, to measure regional ventilation and perfusion, fluorescent aerosols are administered and microspheres are injected intravenously in vivo. The regional distribution of the fluorescent ventilation and perfusion markers can then be measured postmortem in the serial block-face cryomicrotome (multi-spectral) images. This information is not available from casting methods as they are not able to measure regional fluorescence. For this imaging modality, we present a new highly-automated airway tree segmentation method for rats that enables extracting many generations of the airways.
Our method is based on a new approach for extraction of centerline based representations of airway trees. Initially, starting from a root point inside the trachea, the whole image is explored in an exhaustive manner, searching for airway candidates and calculating a centerline path from the root of the airway tree to each candidate. In a subsequent step, suitable centerline paths of the airway tree are identified and all other paths are discarded. Because the image domain is explored exhaustively, the method is quite robust against local disturbances in the image data. For this approach, we present a novel path finding algorithm for extraction of centerline paths that addresses the problem of erroneous shortcut paths, as they would occur with standard minimum cost path algorithms. The method is evaluated on five serial block-face cryomicrotome image data sets of Sprague-Dawley rat lungs. The presented approach can be adapted to other applications like human airway segmentation in multidetector CT data.
II. Rat Lung Imaging
Details of the imaging device and protocol are provided in the following sections.
A. Experimental Protocol
The University of Washington Animal Care Committee approved the experimental protocol. Five male Sprague-Dawley rats weighing between 244 and 276 g were anesthetized by intraperitoneal injection of 80 mg/kg ketamine and 10 mg/kg xylazine, sufficient to prevent withdrawal of paw after pinch. A tracheostomy was performed, and an internal jugular vein was cannulated. The animals were mechanically ventilated at a rate of 50 breaths/min with a tidal volume of approximately 3 mL, using a piston pump ventilator. The rats were then deeply anesthetized with an intraperitoneal injection of ketamine/xylazine; their chests widely opened, and exsanguinated. The pulmonary artery was cannulated; the main aorta tied off, and blood was injected to fill the vasculature (1.3 ± 0.5 mL). The lungs were removed from the chest, filled via the trachea with Optimal Cutting Temperature media (OCT, Sakura Finetek Inc., Torrance, CA) until they appeared inflated to total lung capacity (10.5±0.7 mL) and then frozen. The frozen lung was surrounded by a mixture of 99.25% OCT and 0.75% India ink and returned to the freezer. The ink was used to create a contrast between the lung parenchyma and the surrounding OCT.
B. Serial Block-Face Cryomicrotome Imaging
The serial block-face imaging cryomicrotome (Barlow Scientific, Inc. Olympia WA) is a computer driven instrument that acquires multi-spectral digital images of en face tissue blocks that are serially sliced. It enables the three-dimensional imaging of fluorescence and fluorescent microspheres at a microscopic level. The instrument has previously been described in detail [2], but has been upgraded recently. The instrument comprises a cryostatic microtome, a Redlake MegaPlus II ES3200 camera (San Diego CA) with a resolution of 2184 × 1472 pixels, a Micro-Nikkor 200 mm f/4D IFED lens (Nikon Corp, Tokyo Japan), a metal halide lamp (PE300BF Cermax, Excelitas Technologies, Fremont CA), a set of excitation/emission filters that allow isolation of specific spectral channels, and a computer controlling the device and storing images. The microtome serially sections thin slices of a frozen tissue block of up to 54×36 mm in size along the x- and y-direction. Following every cut, images of the tissue block are captured with different pairings of excitation/emission filters. Note that the tissue slices themselves are not utilized and are discarded. The sequence of two-dimensional images results in a three-dimensional image with potentially several spectral channels for each voxel.
C. Imaging Protocol
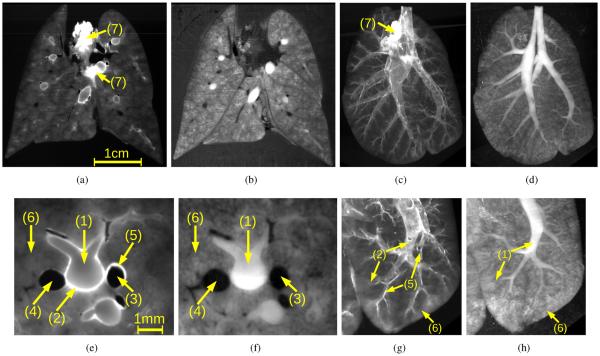
The lung blocks were mounted in the serial block-face imaging cryomicrotome and imaged at a spatial resolution of 25 × 25 × 25 ×m with different excitation/emission filter settings. We refer to each of these filter pairs and resulting image stacks as channels. In this work, only two channels were utilized for segmenting airways: a) an outline channel (OL) that is excited with a broad spectrum white light and read with an emission filter of 450 nm and b) an autofluorescent (FL) pairing (excitation=485 nm, emission=530 nm) to highlight the airways. If needed, other channels can be acquired to image deposited aerosolized microspheres and/or microspheres administered to the pulmonary capillaries. The resulting data sets have a typical size of 2184 × 1472 × 1800 voxels per channel. Examples of 2D cross-sectional images and maximum intensity projections (MIPs) of image volumes are depicted in Fig. 1.
Fig. 1.
Volumetric serial block-face cryomicrotome images of a rat lung. (a, c, e and g) FL and (b, d, f and h) OL image channel. (a and b) 2D cross-sectional images and (c and d) corresponding maximum intensity projections of the spectral channels. (e–h) Renderings of image details corresponding to data depicted in (a–d), respectively. Note that the same anatomical structures appear differently in OL and FL image channels. Main structures are: (1) airways, (2) airway walls, (3) arteries, (4) veins, (5) artery walls, (6) lung parenchyma, and (7) heart tissue.
Airways and vascular structures can be identified in both spectral channels (Fig. 1). The lumen is brighter than the background in the OL channel, while the airway lumen is almost indistinguishable from the parenchyma in the FL channel. However, small airways can only be identified in the FL channel based on their bright airway wall. Also, blood vessels–in particular larger arteries–show a wall similar to the airways in the FL channel. The lumen of vessels is dark in both spectral channels, but smaller vessels can be identified better in the OL channel.
The serial block-face cryomicrotome provides high-resolution images. However, image data can have artifacts or disturbances that are related to imaging and/or animal preparation. For example, single slices or a few consecutive slices in the images may be over- or underexposed, bright structures have a halo in the transverse direction of the data sets, the lung parenchyma or other structures may appear inhomogeneous, sometimes (parts of) tissue slices can get stuck on the face of the tissue block, etc. Some of these disturbances are depicted in Fig. 2. In addition, there can be other tissues with similar gray-values attached to the airway wall (e.g., heart tissue in Figs. 1(a) and 1(c)). These issues make segmentation of airways in serial block-face cryomicrotome images a nontrivial task.
Fig. 2.

Examples of imaging artifacts. (1) Overexposed image slice. (2) Nearby highly fluorescent non-lung tissue. (3) ”Halo” of bright structures due to light that is piped through the OCT. (4) Inhomogeneous appearance of lung tissue.
III. Airway Tree Segmentation
Our method for segmenting airway trees from fluorescent serial block-face cryomicrotome images utilizes a multi-scale airway medialness function in combination with a novel path extraction method to obtain a centerline based representation of airway tree structure. The main processing steps of the algorithm are as follows. First, a root point of the airway tree is manually specified. Then, a set of candidate airway centerline points is automatically identified. By utilizing our novel path extraction method, a path between the root of the airway tree and each point in the set of candidate centerline points is obtained. Local disturbances (see Section II-C) that might be present in the data set are robustly handled by the path extraction approach. The union of all these paths is utilized to generate the initial airway tree structure. A pruning algorithm is applied to automatically remove erroneous subtrees or branches resulting from false candidate centerline points. Finally, after extraction of the airways structural information (centerline plus radius information), an optimal surface segmentation method is applied to obtain accurate segmentations of the airway lumen.
To cope with the large size of the image data sets, the medialness calculation and airway centerline extraction are applied in a multi-scale fashion. First, the volumetric image data sets are downsampled by a factor of 4 in each direction and large-scale airway structures are extracted starting from a single root point inside of the trachea. Second, the initial data sets are downsampled by a factor of 2 in each direction and smaller airways are extracted utilizing the large-scale airways centerline points as start points. In addition, all “small-scale” analysis steps are only performed inside a given rough lung mask, which speeds up processing. This mask also excludes larger airway structures such as the trachea and parts of the main bronchi, which have been already identified in the first processing step. Third, the segmentation of the airway lumen is performed in the full resolution data set. The details of our approach are presented below.
A. Medialness Calculation
In a first processing step, airways in the volumetric image data set are enhanced and an airway-medialness value is derived for each voxel of the image, which can be transformed into a cost-image for the subsequent path extraction algorithm (Section III-B).
For airway enhancement, several scale-space based tube-likeliness measures (medialness functions) have been proposed in the literature like Frangi's ”vessel” enhancement filter [4], which is based on an analysis of the eigenvalues of the Hessian-matrix . Let I be the input image, Gσ be a Gaussian function at scale σ, then represents the scale-space normalized second order derivative (Hessian matrix) at a location x. Based on the eigenvalues vesselness |e1| ≤ |e2| ≤ |e3| of the Hessian matrix, Frangi's vesselness measure Fσ(x) [4] is calculated as:
| (1) |
with RA = |λ2|/|λ3| to distinguish between plate-like and line-like structures, indicating blob-like structures and to suppress random noise effects. The parameters α, β, and c allow weighting of the components RA, RB, and S, respectively. To account for the different sizes of the structures, the measure is calculated at different scales and the maximum response across all scales is utilized as the final result.
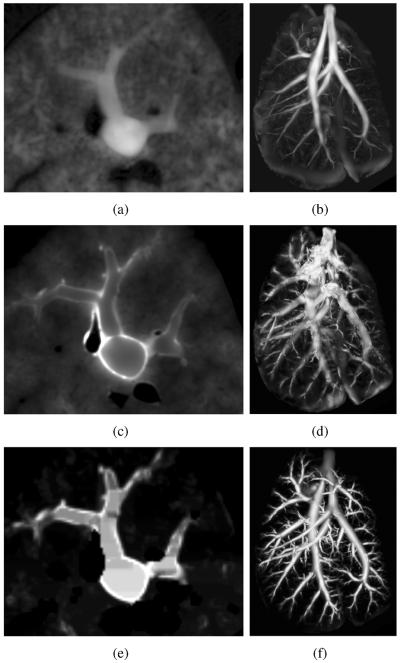
Figs. 3(b) and 3(d) show the result of applying Frangi's ”vessel” enhancement filter to the OL and FL channels of the serial block-face cryomicrotome rat lung images, respectively. In the OL channel, airways appear enhanced as desired, and other structures are suppressed. However, smaller airways are not visible in this channel (Fig. 3(b)). On the other hand, conventional scale-space based medialness functions are not directly applicable to the FL image channel (Fig. 3(d)), because these functions typically require a solid, homogeneous and tubular structure surrounded by brighter or darker tissue. The gray-value of the airway lumen in the FL channel (Fig. 3(c)) is almost indistinguishable from the surrounding parenchymal tissue and only the airway wall is well contrasted. Consequently, conventional multi-scale medialness functions are not directly applicable.
Fig. 3.
Results of medialness functions on serial block-face cryomicrotome image data. (a) OL image cross-section and (b) corresponding Frangi's vesselness measure. (c) FL image cross-section and (d) corresponding Frangi's vesselness measure. (e) FL image cross-section after preprocessing (Section III-A1) and (f) our airway medialness function (Section III-A2) result. Note that all medialness responses are shown as MIPs of the whole volume data sets.
1) Preprocessing
To address the above outlined issue, we have developed a preprocessing method that transforms the original airways into a more homogeneous structure, which makes them suitable for analysis with scale-space based medialness functions.
The preprocessing approach consists of two steps. First, airway walls in the FL channel are enhanced by utilizing a multi-scale feature enhancement filter. Based on the notation of Frangi, we define a sheetness measure
to suppresses non-plate like structures. All parameters were adjusted to the size and typical contrast of the airway walls in the data sets: α = 0.5, β = 0.5, and c = 10000. The final result is calculated by
with ΣS = {25, 50, 75} μm. Second, the hollow airway structures are transformed into solid structures that are brighter than the surrounding area (tissue). For this purpose, a morphological grayscale hole filling operation [5] is applied to all 2D coronal, sagittal, and axial image slices of the enhanced volume. The results of this operation are combined using a voxel-wise maximum operator.
In the FL image channel, larger vessels can also have a bright wall, similar to the airway wall. To reduce the influence of vessels on the airway segmentation, they are roughly segmented and subsequently suppressed. First, a rough vessel mask is obtained by thresholding values smaller than 400 gray-values in the OL channel. Subsequently, a morphological dilation with a sphere of 100 μm radius is applied. Second, for all vessel voxel locations, corresponding voxels in the preprocessed volume are set to a value of zero. An example of a preprocessing result is shown in Fig. 3(e). The preprocessed FL volume is utilized to calculate an airway medialness response.
2) Airway Medialness Function
For the purpose of extracting a path at the center of airways, higher medialness values closer to the center are desirable. However, Frangi's measure was intended for enhancement of the whole tubular structures. Thus, it will generate high responses close to the surface of tubular structures where large gradient values can be observed. To achieve the desired response, we introduce a medialness function Aσ(x) that combines Frangi's measure (Equation 1) with an additional term that suppresses responses in areas with high gradients:
| (2) |
where Bσ(x) = σΔ(Gσ ★ I(x)) is the scale-space normalized gradient and δ is a parameter for suppression of gradients. The scale for suppression of gradients should be slightly larger than the scale for calculation of Frangi's measure. The relation between the two scales is adjusted by a scalar factor η. The scale dependent medialness function Aσ(x) is calculated on several scales and combined into a single multi-scale response
Note that the scale of the maximum response also provides a size-estimate of the airway which is utilized in further processing steps.
As outlined in the introduction, the airway-medialness is calculated separately for large- and small-scale airway structures. All parameters of our airway medialness are fixed and were previously determined on a test data set. For extraction of large-scale airway structures, the set of parameters utilized was ΣA = {400, 600, 800, 1000, 1200} μm, α = 0.25, β = 0.5, γ = 10, δ = 5 and η = 1.5. For detecting small-scale airway structures, the following parameters were utilized: ΣA = {200, 300, 400, 500} μm, α = 0.25, β = 0.5, γ = 50, δ = 25 and η = 1.5. The merging of results of the large-scale and small-scale airway medialness calculation is handled during the airway tree structure extraction step (see Section III-B4 for details).
An example of the airway-medialness response after combining large-scale and small-scale results on a preprocessed volume is depicted in Fig. 3(f). The outlined approach suppresses unrelated structures and enables the segmentation of small airways with low contrast. In addition, the method is well suited for subsequent processing with path extraction algorithms due to a higher response closer to the center of airways.
B. Airway Tree Structure Identification
From the airway-medialness data, a centerline based representation of the airway tree is generated. Therefore, potential centerline points of airways are identified, and for each candidate, a path to a manually identified root point inside the trachea is calculated. The union of all these pathways forms the initial airway centerline structure, which might contain some false branches due to initially incorrectly identified airway centerline candidate points. Thus, in a subsequent step, these false branches are removed by means of an automated pruning algorithm, resulting in the final airway tree structure.
1) Finding Candidate Airway Centerline Points
In the airway-medialness volume, airways form height ridges. Thus, a set of candidate centerline points can be obtained by finding ridge points in the airway-medialness image above a given threshold tc. Ridge points are defined as local maxima in the plane normal to the airway's estimated tangential direction [6].
2) Initial Tree Structure Generation
To obtain a path from the root of the airway tree to a candidate centerline point, we have developed a novel path calculation technique (Algorithms 1 and 2) that utilizes a cost volume C(x) = 1/(ε + A(x))2 derived from the previously calculated airway-medialness response A(x) (Section III-A2), where ε is set to a small positive value of 0.001 to avoid a division by zero. Starting from a given root point/voxel, a path to each voxel of the volume is generated in an iterative fashion by the path calculation algorithm (Algorithm 1). Voxels with no path to the root that are neighboring to voxels with path information are considered. The order in which voxels are linked to existing paths is determined by a cost function that is based on the costs of the last few centerline points (voxels) along the path within a path length of lmax (Algorithm 2).
This procedure may seem similar to Dijkstra's minimum cost path algorithm [7] or other minimum cost path algorithms (e.g., [8]), but the main difference is how the costs for the path expansion are calculated. Conventional algorithms (e.g., Dijkstra) accumulate the costs along the whole path from the root point. In contrast, the proposed algorithm accumulates path costs only along the last few centerline points of the path within a path length of lmax (Algorithm 2). Thus, within a path length of lmax, the algorithm shows a similar behavior as minimum cost path algorithms, but it allows us to overcome the problem of shortcuts (Fig. 4(b)), i.e., minimum cost path algorithms may shortcut through a region of high costs to avoid a longer correct path with several smaller disturbances (high costs) along the path (Fig. 4). Consequently, our algorithm handles smaller disturbances (e.g., gaps) in the medialness function without the problem of potentially occurring shortcuts (Fig. 4(c)). Extracting the paths for all airway candidate points results in a fully-connected loop-free tree structure (see Fig. 5(a)).
Fig. 4.
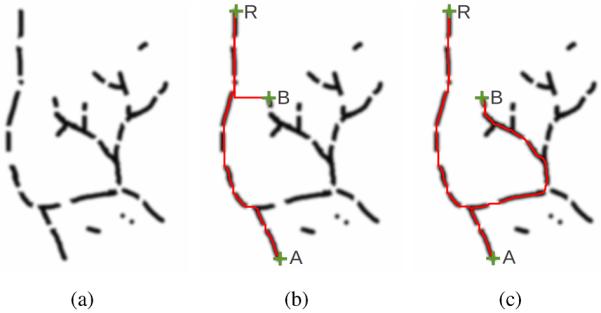
Path extraction on a 2D phantom data set of a tree-like structure. (a) Cost image of the phantom data set with some disturbances in the image (areas of high costs on the path); areas of low cost are dark. (b) Paths extracted between the root of the tree structure (R) and selected endpoints (A and B) using a conventional minimum cost path extraction algorithm. For point B, the algorithm shortcuts through an area with high costs instead of extracting a longer path with smaller disturbances on the path. (c) Result of the proposed algorithm. The algorithm robustly handles the disturbances on the paths and avoids shortcuts.
Fig. 5.
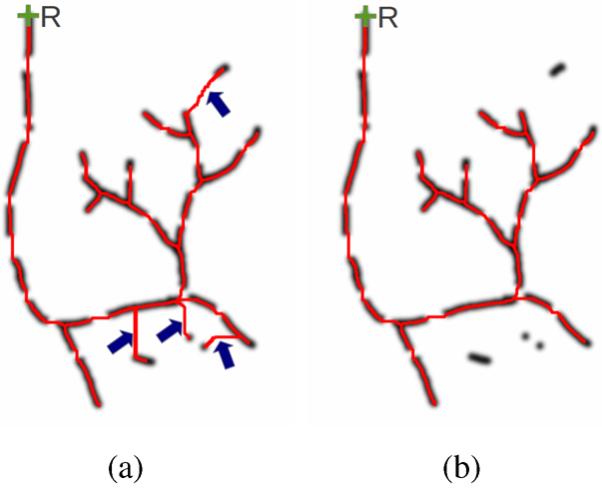
Airway tree pruning. (a) Paths extracted between the root (R) and the set of all candidate tree centerline points using the proposed path calculation algorithm. False candidate centerline points are still connected to the actual tree structure (blue arrows). (b) Final tree structure after pruning.
|
|
| Algorithm 1 Path calculation algorithm. |
|
|
| input: cost image C |
| input: set of start point(s) S |
| input: local path length parameter lmax |
| output: map with predecessor points on path pred |
| function CalculatePaths(C, S) |
| ▷ Initialize |
| Q ← empty priority queue |
| for each voxel v in C do |
| pred[v] ← undefined |
| end for |
| for each point v in S do |
| pred[v] = root |
| for each neighbor x of v do |
| Q ← Q ⋃ {(C[x], x, v)} |
| end for |
| end for |
| ▷ Extend paths |
| while Q is not empty do |
| tuple t ← popmin(Q) |
| v ← second(t) |
| if pred[v]= undefined then |
| pred[v] ← third(t) |
| for each neighbor x of v do |
| c ← LocalPathCosts (C, pred, v, x) |
| Q ← Q ⋃ {(c, x, v)} |
| end for |
| end if |
| end while |
| return pred |
| end function |
|
|
|
|
| Algorithm 2 Local path cost calculation. |
|
|
| function Local Path Costs(C, pred, p, x) |
| c ← C[x] |
| l ← dist(x,p) |
| while l ≤ lmax and pred[p] ≠ root do |
| c ← c + C[p] |
| l ← l + dist(p,pred[p]) |
| p ← pred[p] |
| end while |
| return c |
| end function |
|
|
Note that Algorithm 1 calculates a path to every voxel of the volume. Thus, once it has been applied, a path from the root point to any point in the volume can be obtained computationally efficiently by means of reverse iteration of the “predecessor” points on the path (see Algorithm 1).
3) Tree Pruning
In the generated airway tree structure (Section III-B2), incorrect centerline parts may be included due to incorrectly identified airway centerline candidates (Section III-B1), as depicted in the example in Fig. 5(a). To deal with this issue, an automated pruning algorithm is applied. Our pruning strategy is based on the observation that incorrectly identified airway centerline candidates are typically connected to the correct part of the airway tree by a quite long path through high cost areas (see blue arrows in Fig. 5(a)). Thus, we define a benefit-to-cost measure for an arbitrary subtree as the number of all centerline points in the subtree that are ridge points above the threshold tc minus the number of all other centerline path points in the subtree. Using this measure, the final airway tree structure is determined using the global graph-partitioning algorithm [9], which prunes all subtrees with a negative benefit-to-cost measure in a bottom-up fashion. Fig. 5(b) illustrates the result of the pruning step on the phantom data set.
4) Two-scale Airway Tree Reconstruction
The above outlined airway tree structure extraction approach is applied twice on different scales to deal with the large size of the volume data. First, starting from a single root point placed inside the trachea, large-scale airway structures are extracted using tc = 0.15 and lmax = 500 μm. Second, the centerline points of the initially extracted large-scale airway structure are considered as start points for the extraction of small-scale airway structures (tc = 0.05 and lmax = 500 μm). All parameters of our algorithm were set to fixed values, which were determined on a test data set.
For both scales, the set of candidate airway centerline points (Section III-B1) is restricted to ridge points inside the given lung mask. In addition, for the extraction of small-scale airways, airway candidate points inside of the previously extracted large-scale airway tree are excluded, to avoid duplicate extraction of centerlines at different scales. An example of results on the two scales is depicted in Fig. 6.
Fig. 6.
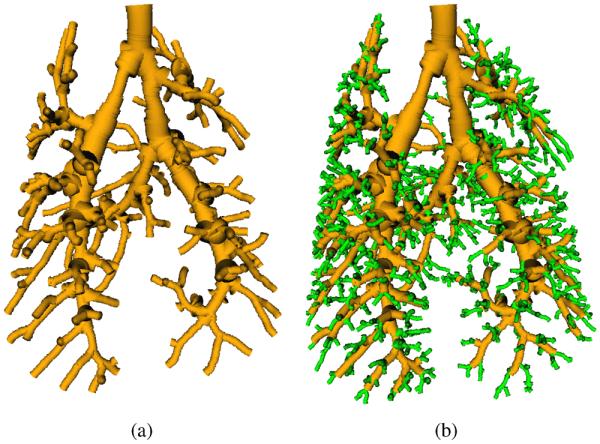
Two-scale airway tree reconstruction. (a) Initial tree structure after extracting large-scale airways. (b) Final tree structure after adding small-scale airways. Note that the airways are rendered using centerline and estimated radius information obtained from the multi-scale airway-medialness calculation (Section III-A2).
C. Airway Lumen Segmentation
To obtain a segmentation of the airway lumen, an optimal surface segmentation (OSS) approach is utilized [10]. By using the OSS framework, a segmentation problem is transformed into a graph-optimization problem, which enables obtaining a globally-optimal solution based on the underlying cost-function. For this purpose, an initial mesh-based segmentation is required, which is generated as follows. Utilizing the centerline and radius information, a distance map representing the signed distance to the estimated airway wall is calculated by means of a fast marching method [8]. The initial surface is obtained as the zero level set in this distance map using a marching cubes algorithm [11]. In addition, a binary segmentation is generated based on thresholding with a value of zero (Fig. 7(c)). Based on the generated mesh, search profiles with equidistant graph nodes are constructed (Fig. 7(a)) for each mesh vertex by utilizing a Gradient Vector Flow (GVF) based approach [12] to avoid mesh folding artifacts. The gradients in the binary segmentation are calculated and the GVF [13] is applied to achieve an anisotropic diffusion of the gradient information. The search profiles are constructed by following the vectors in the GVF field for a range of ±500 μm. Close to the medial structures, the GVF field magnitude vanishes. Thus, the search profile construction is terminated early if the magnitude of the GVF vector falls below a threshold of 0.025 to avoid artifacts that might occur otherwise at the medial axis of the airways. An example of the constructed search profiles at a bifurcation is shown in Fig. 7(a). Note that the search profiles do not interfere (i.e., cross). Equidistantly placed nodes on profiles that are 25 μm apart represent possible locations of the luminal airway surface. All nodes are assigned costs derived from image properties. In addition, neighboring search profiles are coupled to guarantee a smooth segmentation result [10].
Fig. 7.
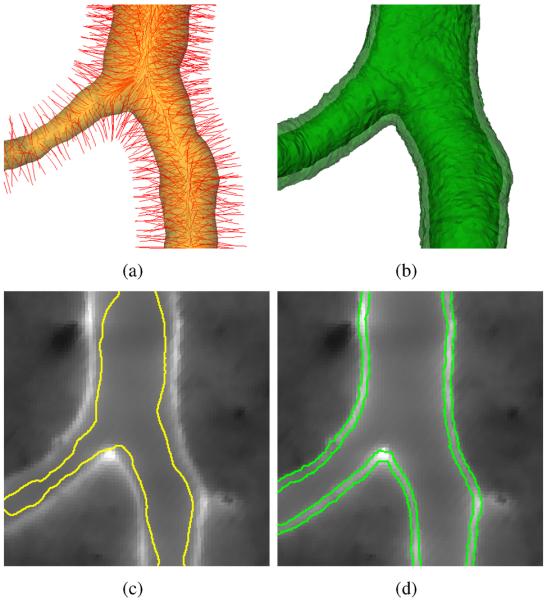
Segmentation of lumen and outer airway wall. (a) OSS search profiles (red) and initial surface (yellow) constructed based on centerline and radius information. For visualization, only a subset of the actual search profiles is shown, because of the high density of search profiles. (b) OSS segmentation result showing luminal (opaque) and outer airway wall surface (semi-transparent). (c) Fluorescent channel and initial surface estimate in a 2D cross-sectional image. (d) OSS segmentation result with luminal and outer airway wall surface.
OSS enables segmenting multiple (layered) surfaces of an object with two coupled graph structures [10]. In our case, we are primarily interested in segmenting the airway lumen. However, we utilize a dual-surface segmentation approach of lumen and outer airway wall, because it facilitates the robust segmentation of the airway lumen, especially in low contrast situations or in proximity to pulmonary vessels. OSS costs for lumen and outer wall are Ci(x) = Lmax − Li(x) and Co(x) = Lmax − Lo(x), respectively, where Lmax = maxx∈G (max(Li(x),Lo(x)) represents the maximum edge likelihood of all search profile points in the Graph G. The utilized edge-likelihood functions for the luminal Li(x) = I′H(I′) and outer surface Lo(x) = −I′H(−I′) are based on the image gradient I′, which is calculated as the central difference of the gray-values at node locations. The Heaviside step function H is utilized to penalize unsuitable gray-value transitions (i.e., from bright to dark for the inner surface and from dark to bright for the outer surface).
The parameters for the minimal and maximal distance between the inner and outer airway wall surface were determined on a test data set and set to 100 μm and 200 μm, respectively. The maximum allowed difference between neighboring final surface nodes (smoothness constraint) was one node. Examples of the resulting inner (luminal) and outer airway wall segmentations are shown in Figs. 7(b) and 7(d).
The output of the presented airway tree segmentation method is a mesh representing the luminal airway wall (Fig. 9). In addition, a structural description of the airway tree is generated, describing the parent-child relationships between airway segments. For further analysis, the mesh and structural information are stored in data formats supported by the Insight Segmentation and Registration Toolkit (ITK)1.
Fig. 9.

Airway segmentation results on evaluation data sets. (a) to (e) Results for Rat 1 to Rat 5, respectively. Manually identified errors are marked in red.
IV. Evaluation Methodology
Our method is assessed on five rat lung data sets (the imaging protocol is described in Section II), which have not been utilized for method development or parameter selection. First, the sensitivity and specificity of the airway structure identification step is determined and, in addition, all airway trees are manually inspected for errors. Second, the airway lumen segmentation accuracy is analyzed. For all experiments, the parameters provided in Section III were utilized, which were experimentally determined on a test data set consisting of lung image volumes of three rats.
A. Independent reference standard
a) Airway Structure
For each of the five rats, two sets of random sample points (S1 and S2) inside of the lung were generated, which were utilized by an expert to produce an independent standard for airway structure evaluation. First, the expert navigated to each random sample point in S1 and marked the nearest airway in the image data set by drawing a contour of the lumen in a cross-sectional plane using 3D Slicer2, a software package for medical image visualization and computing. Second, the expert navigated to each random sample point in S2 and decided if it is a true background location (no visible airways at sample point). All random points inside of airways were discarded from the set of background samples S2.
With the above outlined procedure, true airway and background locations were identified, respectively. From the contours of the airway samples, radius estimates were derived. Table I summarizes the number of random samples in sets S1 and S2, per imaged rat, and Fig. 8 shows a histogram of the airway radii. Note that identifying true background (non-airway) locations is more time-consuming than finding the airway nearest to a random location. Thus, fewer background samples were produced by the expert. However, for Rat 3, significantly more background points were investigated to assess the impact on specificity and its 95% confidence interval (CI) estimate.
Table I.
Utilized sample sizes per case.
| Rat | Number of samples in set S1 | Number of samples in set S2 |
|---|---|---|
| 1 | 100 | 29 |
| 2 | 100 | 27 |
| 3 | 102 | 485 |
| 4 | 100 | 27 |
| 5 | 100 | 28 |
Fig. 8.
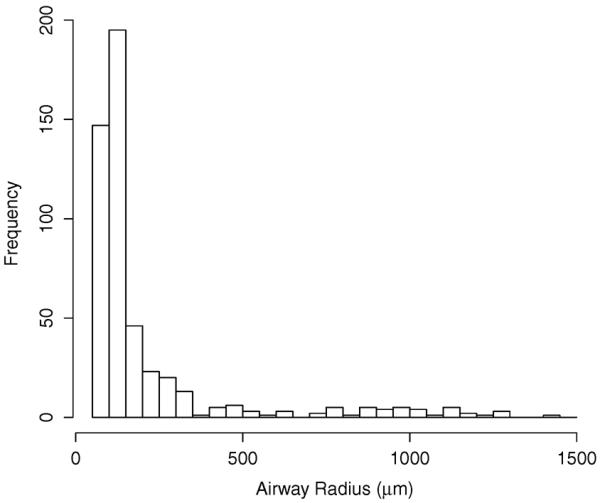
Histogram of examined airway radii.
b) Airway Lumen
From all expert identified airway reference locations (branches), a stratified random selection was performed. For stratification, three airway size categories (< 100 μm, ≥ 100 μm & ≤ 250 μm, and > 250 μm) were utilized, and a random selection of 20 samples per category and rat was performed. Note in some cases, less than 20 samples were available. For each sampled airway branch that was also present in the segmentation result generated by the algorithm (true positive branch), a 2d cross-sectional image perpendicular to the flow direction of the branch was derived from the FL channel volume. An expert traced the inner airway wall in the selected slices using 3D Slicer, which will be denoted as reference segmentation. If the cross-sectional image showed a bifurcation, the expert excluded this sample from further analysis. In addition, for the selected cross-sections, a radius calculation based on the luminal area was performed based on the expert tracing as well as the segmentation result produced by the algorithm.
B. Error Measures and Statistical Analysis
Based on the independent reference standard and the segmentation result, sensitivity and specificity of airway structure identification were calculated. Sensitivity is defined as the probability that the segmentation includes an expert-identified airway point. Specificity is the probability that points identified as being background are not in the segmentations. Logistic regression was used to model sensitivity as a continuous function of airway radius. Estimates were obtained with the method of generalized estimating equations [14], in order to account for repeated measurements within each of the five animals. Exact binomial confidence intervals were calculated for rat-specific estimates of specificity. Furthermore, all airway tree structures were manually inspected, and the number of incorrectly identified airway subtrees/segments are reported.
To assess airway lumen segmentation performance, the signed and unsigned surface distance errors were calculated. The signed and unsigned surface distance error between the border of the segmentation C and the contour of the expert tracing C′ are defined as and , respectively, where d(x, C′) = minx′ ∈ C′ ∥x − x′∥ and s(x, C′) = − if x inside of C′ and 1 otherwise. Boxplots of both surface error indices are utilized to depict the median (central mark), lower quartile (lower edge of box), and upper quartile (upper edge of box). The whiskers of the boxplots extend to the most extreme data points not considers to be outliers, and the outliers are plotted individually.
Linear regression was used to regress airway radii on segmented airway radii, which were derived based on cross-sectional area measurements.
V. RESULTS
Results of the sensitivity analysis as a function of expert defined airway radii are given in Fig. 10. Selected airway radii sensitivity and corresponding 95% CIs are provided in Table III. The average sensitivity was 87.4% with a 95% CI of (84.9, 88.6)%. Specificity and corresponding 95% CIs for the five test cases are given in Table IV. The combined estimate for specificity was 100% with a CI of (99.4, 100)%.
Fig. 10.
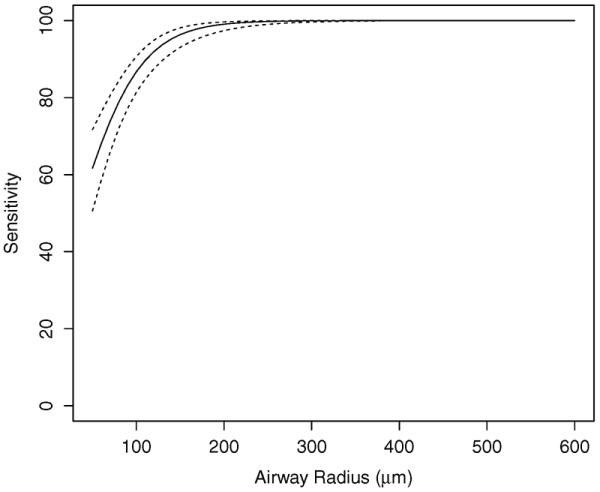
Estimated mean sensitivity (solid line) and 95% confidence intervals (dashed lines) as a function of airway radius. Note that sensitivity and corresponding CI are not plotted for radii larger than 600 μm, because the indices do not change.
Table III.
Estimated sensitivity for select airway radii.
| Airway radius (μm) | Estimate (%) | 95% CI (%) |
|---|---|---|
| 50 | 61.7 | (50.6, 71.7) |
| 100 | 86.7 | (81.4, 90.7) |
| 150 | 96.4 | (93.1, 98.1) |
| 200 | 99.1 | (97.4, 99.7) |
| 250 | 99.8 | (99.0, 99.9) |
| 300 | 99.9 | (99.6, 100.0) |
Table IV.
Estimated specificity for each rat in the experiment. N is the number of samples utilized to estimate specificity.
| Rat | N | Estimate (%) | 95% CI (%) |
|---|---|---|---|
| 1 | 29 | 100 | (88.1, 100) |
| 2 | 27 | 100 | (87.2, 100) |
| 3 | 485 | 100 | (99.2, 100) |
| 4 | 27 | 100 | (87.2, 100) |
| 5 | 28 | 100 | (87.7, 100) |
Manual assessment of the correctness of segmented airways showed that the mean and standard deviation of the number of incorrect subtrees was 9.4 ± 3.6 (min. 5; max. 13) with 20.8 ± 12.9 (min. 7; max. 39) incorrect airway segments. Segmentation results for all five data sets are depicted in Fig. 9, which also shows incorrect branches. After removing incorrect branches from the segmentations, the mean and standard deviation of the number of terminal branches was 1179±167, and the diameter of terminal branches was 159±57 μm. Additional indices that summarize the complexity of segmented airway trees are provided in Table II.
Table II.
Complexity of segmented airway trees. Note that the statistics were obtained after removing incorrect branches from the segmentation.
| Measure | Number of airway segments | Max. number of generations | Centerline length (mm) |
|---|---|---|---|
| mean ± stdev | 2222 ±250 | 27.4 ±2.5 | 1889±103 |
| median | 2160 | 27 | 1876 |
| min | 1972 | 24 | 1773 |
| max | 2617 | 31 | 2018 |
Fig. 11 shows a scatter plot comparing the radii derived from expert tracings and algorithm segmentation. A summary of the estimated regression line is given in Table V. There was a small amount of statistically significant intercept bias (p<0.001) and negligible scale differences (p=0.2038). Furthermore, 99.8% of the variation in airway radii are explained by the segmented airway radii (R2 = 0.998). Boxplots of the signed and unsigned surface distance error are depicted in Fig. 12. The mean and standard deviation for signed and unsigned surface distance error are −3.75±12.9 μm and 15.5 ± 15.5 μm, respectively. A comparison between segmentation result and manual expert tracings for airways of two different sizes is provided in Fig. 13.
Fig. 11.
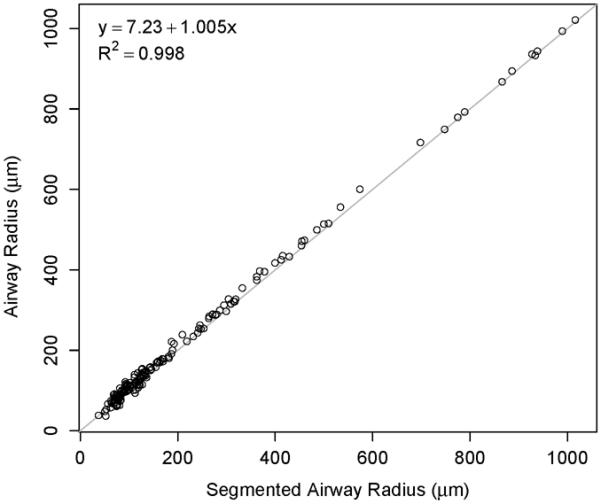
Scatter plot of segmented and independent reference airway radii, along with the estimated regression line fit to the data.
Table V.
Estimated intercept and slope from regressing airway radii (independent reference) on segmented radii.
| Parameter | Estimate | 95% CI | p-value |
|---|---|---|---|
| Intercept (μm) | 7.23 | (5.03, 9.42) | < 0.0001 |
| Slope | 1.005 | (0.997, 1.012) | 0.2038 |
Fig. 12.
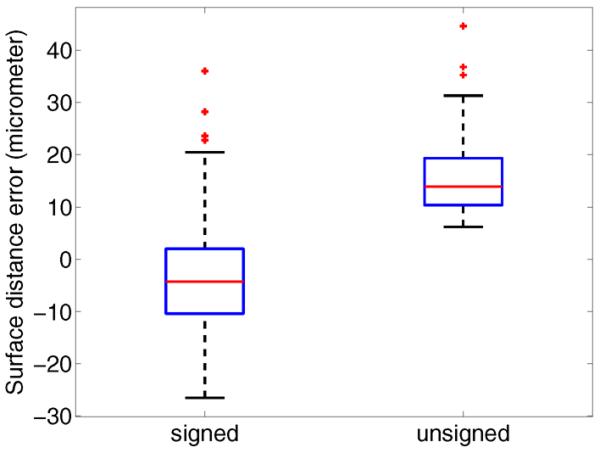
Boxplots of signed and unsigned airway lumen surface distance errors.
Fig. 13.
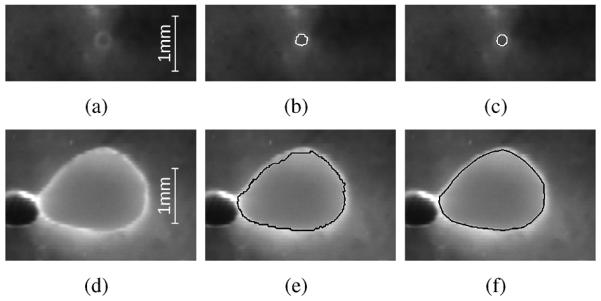
Airway lumen segmentation accuracy. (a)–(c) Small airway at the distal end of the airway tree. (d)–(f) Large airway. (a) and (d) Fluorescence color channel. (b) and (e) Segmentation result. (c) and (f) Manual tracing.
Preparing a rat lung and subsequent imaging took approximately 26 h; more than 95% of this time was consumed by the automated imaging. About 1 min per data set was required to specify the airway root point. The subsequent automated airway segmentation step required about 2.5 hours of computing time per data set on a 12-core workstation with 2.4 GHz processor frequency. Manual inspection of segmentation results to identify incorrect airway segments typically took less than 15 min.
VI. DISCUSSION
The presented method allows extracting airway trees from volumetric serial block-face cryomicrotome image data with high complexity (Fig. 9 and Table II) paired with good sensitivity and specificity (Fig. 10, Tables III and IV) estimates. Airway lumen radii measurements derived from segmentation results of our approach showed high correlation with the manually generated independent reference standard (Fig. 11 and Table V).
Manual inspection of segmentation results showed a low number of incorrectly identified airway subtrees/segments (Fig. 9) and some local segmentation inaccuracies were observed (Fig. 14). These problems are typically caused by non-lung tissue that was not properly removed during animal preparation (Fig. 14(a)) or occurred at the distal airway locations where the airway wall is quite fuzzy due to poor contrast (Fig. 14(c)). Incorrect airway segments are easily identifiable by the user and require little user interaction to correct; the user identifies the location where the error occurs and the whole airway subtree is removed automatically. Thus, on the five cases investigated, an average of 9.4 “mouse clicks” per data set would be needed. Alternatively, an additional pruning step could be designed to remove these problems automatically by utilizing structural properties of the segmented airway tree like branching angle or features assessing local surface expansion.
Fig. 14.
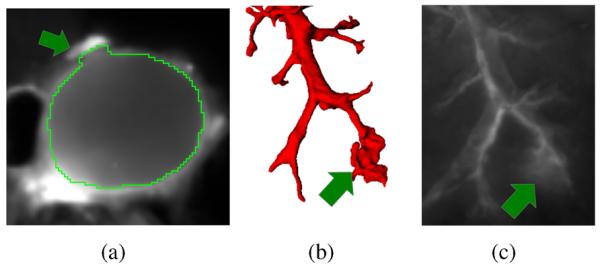
Examples of local segmentation inaccuracies. (a) Airway segmentation in the area of the mediastinum. The adjacent heart tissue, which was not properly removed before imaging, causes a local segmentation inaccuracy. (b) Distal end of an airway tree with low contrast and (c) corresponding image data shown as MIP of the FL channel.
So far, the extraction of rat airway trees from high-resolution three-dimensional image data has been studied only by a few groups, utilizing different approaches for animal/specimen preparation, imaging and segmentation. Table VI provides an overview and summarizes indices of segmented or analyzed airway tree complexity. To enable a direct comparison, Table II provides the same complexity indices for our approach. The majority of approaches reported are based on airway corrosion casts, which enable high contrast between airways and background (i.e., good signal to noise ratio). Therefore, such approaches (e.g., [15]) allow segmenting more airway segments compared to our approach. However, the maximum number of detected airway generations is comparable, even to manual analysis [16]. This suggests that approaches based on corrosion casts enable a more consistent detection of smaller airways, which is also reflected by our sensitivity analysis (Fig. 10 and Table III), showing lower sensitivity for smaller airways due to lower contrast. Because airway detection performance depends on the whole image processing chain, it is hard to contribute this point to a single factor like utilized animal/specimen preparation, imaging, or segmentation algorithm. Analysis of corrosion casts is not without its own problems and limitations. For example, the high complexity of corrosion casts in combination with limited imaging resolution can cause loops in the segmented airway trees. Consequently, this issue needs to be resolved in a post-processing step [1]. In addition, a corrosion casting approach does not allow one to derive airway geometry and regional maps of lung function like perfusion or ventilation.
Table VI.
Overview of related methods for 3d rat airway tree segmentation. Note that the same indices are summarized for our method in Table II.
| Method | Rat strain | Number of airway segments | Max number of generations | Airway centerline length (mm) | Imaging technique | Segmentation approach and remarks |
|---|---|---|---|---|---|---|
| De Backer et al. [17] | Sprague-Dawley | - | 12 | 174 | Micro-CT of dead rats | Thresholding based segmentation |
| Oakes et al. [18] | Winstar | - | 16 | - | MRI of sihcone corrosion cast | Manually specify centerline points along airway branches and lumen contours, resulting models had up to 81 terminal branches |
| Wang et al. [19] | Fisher | - | - | - | 3He MRI of alive rats | Scale-based fuzzy connectedness and thresholding, only few airway branches could be extracted from the data sets |
| Einstein et al. [20] | Sprague-Dawley | 234 | 21 | - | MRI of silicon corrosion cast | Background normalization followed by region growing and manual editing |
| Lee et al. [15] | Sprague-Dawley | 4712 | 28 | - | Micro-CT of airway cast | Fitting of flexible bifurcation models to obtain statistical measurements, discarded segments with radius < 100 μm from analysis |
| Raabe et al. [16] | Long-Evans | 4087 | 28 | - | Silicon cast, no imaging | Manual measurements |
A potential limitation of our imaging approach is that the lungs are removed from the chest and filled with OCT. This may lead to airway geometries that differ from those in vivo.
To allow extraction of centerline paths of vessels in presence of stenosis or other disturbances, minimum cost path techniques with manually specified start and end points have been utilized (e.g., [21], [22]). However, a manual specification of all endpoints of an airway tree is impractical due to the high complexity of the structures. Our approach addresses this issue by automatically identifying candidates for airway end points. Subsequently, suitable centerlines of the airway tree are identified based on a quality measure of potential subtrees and false candidate end points are discarded. This allows the algorithm to robustly cope with disturbances. The utilized path calculation algorithm also guarantees that the extracted tree structure is fully connected and loop free.
Minimum cost path techniques are commonly utilized for extraction of centerline paths of tubular structures (see e.g. [21], [22]), but they are prone to shortcuts. To reduce the risk of shortcuts, Lesage at al. utilized a normalization of the cost term [23]. However, such an approach cannot overcome problems of disturbances in the image data that induce portions of higher costs along the correct centerline path, because the costs of all disturbances along the whole path would still accumulate. Other authors have proposed to apply the minimum cost path calculation only in a small region around a given seed point, analyze the result, and identify new seed points starting from which the algorithm is applied again in a small region ([24], [25], [26]). Methods of this category vary in the strategies utilized for identifying new seed points, which may lead to very different results. Another approach is to consider only the costs at a single location (voxel) for expanding already known paths. Examples for this category are the ordered region growing algorithm [27] or the related fuzzy connectivity [28] algorithm. Such an approach avoids the shortcut problem, but can result in “fairly irregular paths in practice” [29]. Our path calculation algorithm addresses this problem and allows us to cope with smaller disturbances along the path without the problem of shortcuts. In fact, minimal cost path calculation and ordered region growing can be considered as special cases of our algorithm with lmax = ∞ and lmax = 0, respectively.
Rats are commonly used to study chemical, smoke and air pollution exposure. Our segmented airway data can be utilized to conduct computational modeling of particulate deposition in the rat lung. The anatomically correct and high-resolution volumes can also be used in computational fluid dynamic models to explore site-specific dosimetry of chemicals and gases.
Airway wall thickness has been used in CT imaging to gauge the severity of disease in asthma and emphysema [30], [31], [32]. Our approach can be utilized to measure wall thickness of rat airways (Figs. 7(b) and 7(d)), which would allow studying models of asthma, smoke exposure and emphysema in rats and enable relating treatment interventions to changes in wall thickness. Also, the vascular tree is visible in the serial block-face cryomicrotome images. In the future we plan investigating the function-structure relationship of the vascular tree and blood flow. In addition, we are planning on studying the matching between the airway and vascular trees that share embryonic signaling in their construction.
VII. CONCLUSION
A method for the segmentation of airway trees in serial block-face cryomicrotome images of rat lungs has been presented. To the best of our knowledge, it is the first highly-automated computer-aided approach for this type of segmentation problem. Our method utilizes a new approach for extracting centerline-based representations of airway trees in serial block-face cryomicrotome data. The algorithm was specifically designed to achieve high robustness to effectively deal with disturbances like imaging artifacts. For this purpose, we have introduced a path calculation algorithm that avoids the shortcut problem of standard minimum cost path algorithms. The method allows producing highly detailed segmentations of rat airways with many generations and does not require much user interaction. Segmentation results enable automated quantification of airway lumen radii, and thus, quantitative studies of physiology and lung diseases in rats, requiring detailed knowledge of airway geometries. The segmentation approach in combination with the ability of the serial block-face imaging cryomicrotome to depict regional deposition of fluorescent aerosols or microspheres opens new avenues of investigation of structure and function in laboratory animal models.
Acknowledgments
This work was supported in part by NIH/NHLBI grants R21HL110000 and R01HL073598.
Footnotes
REFERENCES
- [1].Carson JP, Einstein DR, Minard KR, Fanucchi MV, Wallis CD, Corley RA. High resolution lung airway cast segmentation with proper topology suitable for computational fluid dynamic simulations. Comput. Med. Imaging Graph. 2010;34(7):572–578. doi: 10.1016/j.compmedimag.2010.03.001. [DOI] [PMC free article] [PubMed] [Google Scholar]
- [2].Bernard SL, Ewen JR, Barlow CH, Kelly JJ, McKinney S, Frazer DA, Glenny RW. High spatial resolution measurements of organ blood flow in small laboratory animals. Am. J. Physiol. Heart Circ. Physiol. 2000;279(5):H2043–H2052. doi: 10.1152/ajpheart.2000.279.5.H2043. [DOI] [PubMed] [Google Scholar]
- [3].Robertson H, Krueger M, Lamm W, Glenny R. High-resolution spatial measurements of ventilation-perfusion heterogeneity in rats. J. Appl. Physiol. 2010;108(5):1395–1401. doi: 10.1152/japplphysiol.01161.2009. [DOI] [PMC free article] [PubMed] [Google Scholar]
- [4].Frangi AF, Niessen WJ, Vincken KL, Viergever MA. Multiscale vessel enhancement filtering. In: Wells WM, Colchester A, Delp S, editors. Medical Image Computing and Computer Assisted Intervention – MICCAI'98, ser. Lecture Notes in Computer Science. vol. 1496. Springer; Berlin Heidelberg: 1998. pp. 130–137. [Google Scholar]
- [5].Soille P. Morphological Image Analysis: Principles and Applications. 2nd ed Springer; Jun, 2004. [Google Scholar]
- [6].Eberly D, Gardner R, Morse B, Pizer S, Scharlach C. Ridges for image analysis. J. Math. Imaging Vis. 1994;4(4):353–373. [Google Scholar]
- [7].Cormen TH, Leiserson CE, Rivest RL, Stein C. Introduction to Algorithms. 3rd ed The MIT Press; Cambridge, MA: Jul, 2009. [Google Scholar]
- [8].Sethian JA. A fast marching level set method for monotonically advancing fronts. Proc. Natl. Acad. Sci. 1996;93(4):1591–1595. doi: 10.1073/pnas.93.4.1591. [DOI] [PMC free article] [PubMed] [Google Scholar]
- [9].Graham M, Gibbs J, Cornish D, Higgins W. Robust 3-d airway tree segmentation for image-guided peripheral bronchoscopy. IEEE Trans. Med. Imaging. 2010;29(4):982–997. doi: 10.1109/TMI.2009.2035813. [DOI] [PubMed] [Google Scholar]
- [10].Li K, Wu X, Chen DZ, Sonka M. Optimal surface segmentation in volumetric images: A graph-theoretic approach. IEEE Trans. Pattern Anal. Mach. Intell. 2006;28(1):119–134. doi: 10.1109/TPAMI.2006.19. [DOI] [PMC free article] [PubMed] [Google Scholar]
- [11].Lorensen WE, Cline HE. Marching cubes: A high resolution 3D surface construction algorithm. SIGGRAPH Comput. Graph. 1987;21(4):163–169. [Google Scholar]
- [12].Bauer C, Sun S, Beichel R. Avoiding mesh folding in 3d optimal surface segmentation. Proceedings of the 7th international conference on Advances in visual computing - Volume Part I, ser. ISVC'11; Berlin, Heidelberg: Springer-Verlag; 2011. pp. 214–223. [Google Scholar]
- [13].Xu C, Prince JL. Snakes, shapes, and gradient vector flow. IEEE Trans. Image Process. 1998;7(3):359–369. doi: 10.1109/83.661186. [DOI] [PubMed] [Google Scholar]
- [14].Liang K-Y, Zeger S. Longitudinal data analysis using generalized linear models. Biometrika. 1986;7(1):13–22. [Google Scholar]
- [15].Lee D, Fanucchi MV, Plopper CG, Fung J, Wexler AS. Pulmonary architecture in the conducting regions of six rats. Anat. Rec. 2008;291(8):916–926. doi: 10.1002/ar.20726. [DOI] [PubMed] [Google Scholar]
- [16].Raabe O, Yeh H, Schum G, Phalen R. Tracheobronchial geometry: Human, dog, rat, hamster – A compilation of selected data from the project respiratory tract deposition models. Inhalation Toxicology Research Institute; Lovelace Foundation for Medical Education and Research; Mar, 1976. Tech. Rep. LF-53. [Google Scholar]
- [17].De Backer JW, Vos WG, Burnell P, Verhulst SL, Salmon P, De Clerck N, De Backer W. Study of the variability in upper and lower airway morphology in Sprague-Dawley rats using modern micro-CT scan-based segmentation techniques. Anat. Rec. 2009;292(5):720–727. doi: 10.1002/ar.20877. [DOI] [PubMed] [Google Scholar]
- [18].Oakes JM, Scadeng M, Breen EC, Marsden AL, Darquenne C. Rat airway morphometry measured from in situ MRI-based geometric models. J. Appl. Physiol. 2012;112(11):1921–1931. doi: 10.1152/japplphysiol.00018.2012. [DOI] [PMC free article] [PubMed] [Google Scholar]
- [19].Wang B, Saha PK, Udupa JK, Ferrante MA, Baumgardner J, Roberts DA, Rizi RR. 3D airway segmentation via hyperpolarized 3He gas MRI by using scale-based fuzzy connectedness. Comput. Med. Imaging Graph. 2004;28(1–2):77–86. doi: 10.1016/j.compmedimag.2003.06.001. [DOI] [PubMed] [Google Scholar]
- [20].Einstein DR, Neradilak B, Polissar N, Minard KR, Wallis C, Fanucchi M, Carson JP, Kuprat AP, Kabilan S, Jacob RE, Corley RA. An automated self-similarity analysis of the pulmonary tree of the Sprague-Dawley rat. Anat. Rec. 2008;291(12):1628–1648. doi: 10.1002/ar.20771. [DOI] [PMC free article] [PubMed] [Google Scholar]
- [21].Lin Q. Ph.D. dissertation. Linköping University; May, 2003. Enhancement, Detection, and Visualization of 3D Volume Data. [Google Scholar]
- [22].Cohen LD, Kimmel R. Global minimum for active contour models: A minimal path approach. Int. J. Comput. Vis. 1997;24:57–78. [Google Scholar]
- [23].Lesage D, Angelini ED, Bloch I, Funka-Lea G. Bayesian maximal paths for coronary artery segmentation from 3D CT angiograms. Proceedings of the 12th International Conference on Medical Image Computing and Computer-Assisted Intervention: Part I, ser. MICCAI '09; Berlin, Heidelberg: Springer-Verlag; 2009. pp. 222–229. [DOI] [PubMed] [Google Scholar]
- [24].Liao W, Wörz S, Rohr K. Vessel segmentation using an iterative fast marching approach with directional prior. In: Haynor DR, Ourselin S, editors. Proceedings of SPIE. vol. 8314. Feb, 2012. pp. 831 426–831 427. [Google Scholar]
- [25].Lo P, Sporring J, Pedersen JJH, de Bruijne M. Airway tree extraction with locally optimal paths. In: Yang G-Z, Hawkes D, Rueckert D, Noble A, Taylor C, editors. Medical Image Computing and Computer-Assisted Intervention – MICCAI 2009, ser. Lecture Notes in Computer Science. vol. 5762. Springer; Berlin Heidelberg: 2009. pp. 51–58. [DOI] [PubMed] [Google Scholar]
- [26].Benmansour F, Cohen LD. Fast object segmentation by growing minimal paths from a single point on 2D or 3D images. J. Math. Imaging Vis. 2009;33(2):209–221. [Google Scholar]
- [27].Yim PJ, Choyke PL, Summers RM. Gray-scale skeletonization of small vessels in magnetic resonance angiography. IEEE Trans. Med. Imaging. 2000;19:568–576. doi: 10.1109/42.870662. [DOI] [PubMed] [Google Scholar]
- [28].Udupa J, Saha P. Fuzzy connectedness and image segmentation. Proceedings of the IEEE. 2003;91(10):1649–1669. [Google Scholar]
- [29].Lesage D, Angelini ED, Bloch I, Funka-Lea G. A review of 3D vessel lumen segmentation techniques: models, features and extraction schemes. Med. Image Anal. 2009;13(6):819–845. doi: 10.1016/j.media.2009.07.011. [DOI] [PubMed] [Google Scholar]
- [30].Lynch DA, Al-Qaisi MA. Quantitative computed tomography in chronic obstructive pulmonary disease. J Thorac Imaging. 2013 doi: 10.1097/RTI.0b013e318298733c. [DOI] [PMC free article] [PubMed] [Google Scholar]
- [31].Donohue KM, Hoffman EA, Baumhauer H, Guo J, Budoff M, Austin JH, Kalhan R, Kawut S, Tracy R, Barr RG. Cigarette smoking and airway wall thickness on CT scan in a multi-ethnic cohort: the MESA lung study. Respir Med. 2012;106(12):1655–1664. doi: 10.1016/j.rmed.2012.08.006. [DOI] [PMC free article] [PubMed] [Google Scholar]
- [32].Kosciuch J, Krenke R, Gorska K, Zukowska M, Maskey-Warzechowska M, Chazan R. Relationship between airway wall thickness assessed by high-resolution computed tomography and lung function in patients with asthma and chronic obstructive pulmonary disease. J Physiol Pharmacol. 2009;(60, Suppl. 5):71–76. [PubMed] [Google Scholar]


