

Abstract
Primary objective
The aim of this study was to investigate the effect of mild and severe TBI on young male Wistar rats' spatial learning.
Research design
Randomized repeated measure experimental design was used to examine spatial learning in three independent animal groups.
Methods and procedures
Twenty-four (severe n = 9, mild n = 8, sham n = 7) male rats were included in the study. Animals received controlled mild (1.5 mm), severe (2.5 mm) cortical impact injury or sham surgery. Spatial learning was assessed daily using a modified Morris water maze test, 20 days post-trauma, for 5 consecutive days. Percentage time travelled within each quadrant and escape latency were calculated. All animals' hippocampal brain regions were examined post-injury using neuron (MAP2) and pre-synaptic protein (Synaptophysin) biomarkers.
Main outcomes and results
It took the animals with mild injury until day 3 to reach the platform; and animals with mild and severe injury spent significantly less time in the target quadrant than the sham. The hippocampal neuron numbers differed proportionately between animals with severe and mild injury, but the percentage of synaptophysin density was significantly less in the dentate gyrus of both animals with mild and severe injury than sham group.
Conclusion
Persistent spatial learning deficits exist after mild TBI; these deficits appear equivalent to deficits exhibited after a more severe injury.
Keywords: Hippocampus, synaptophysin, Morris water maze
Introduction
Each year ∼1.4 million Americans sustain a traumatic brain injury (TBI). While many recover, ∼80 000–90 000 will live with permanent disability. According to the Centre of Disease Control, to date, ∼5.3 million Americans have chronic deficits as a result of a TBI [1].
In humans, TBI is defined as an insult to the brain from an external mechanical force, leading to permanent or temporary neurological impairments (cognitive, physical and psychosocial) with an associated altered level of consciousness [1], TBI is classified from mild-to-severe [2–4]. The head injury interdisciplinary special interest group of the American Congress of Rehabilitation Medicine established criteria to classify a TBI as mild if the Glasgow Coma Score (GCS) is greater than 12, no abnormalities on imaging studies, no neurological deficits and hospital stay length is less than 48 hours. Mild TBI has also been referred to in the literature as concussion [5, 6]. On the other hand, TBI is classified as severe if a GCS score is of 8 or less and accompanied by a period of unconsciousness or coma that may last days, weeks or months.
In animals, the TBI classification depends on the head injury model used to induce the trauma and is often based on the impact intensity and the extent of brain tissue damage that follows. Several rodent head injury models have been developed; one of the most widely used is the controlled cortical impact injury model developed by Dixon et al. [7]. This head injury model allows for controlled impact and compression depth [7]. Depending on the intensity and compression depth, this head injury model parallels to a great extent the damage that follows head injury in humans such as diffuse axonal injury, induced coma, brain oedema, elevated intracranial pressure, reduced cortical perfusion, decreased cerebral flow, neuro-endocrine and metabolic changes [8]. Dixon and his team classified the controlled cortical impact injury as low when 1 mm compression was induced; moderate when 2 mm compression was applied and high after 3 mm compression. The low intensity injury produced a ‘concussionlike’ trauma [7] or mild TBI, since the animals did not exhibit any acute neurological changes and no extensive brain tissue damage post-injury. However, the high intensity trauma led to increased acute and chronic neurological deficits and more extensive brain tissue damage [7].
In both humans and animals, acutely, the TBI is classified based on the extent of neurological and brain tissue damage that follow the injury. Chronically, as a result of the head trauma, both humans and animals exhibit neurological and cognitive deficits such as learning and memory deficits.
In humans, severe TBI leads to chronic physical, neurological and cognitive deficits; however following mild TBI most individuals show no physical abnormalities and few if any neurological deficits. Nonetheless, within days and months of the injury, multiple neuropsychological deficits including learning and memory difficulties are present [9, 10]. These cognitive deficits may persist up to 6 years after the mild TBI [11, 12]. In severe TBI patients, deficits in learning and memory were detected 10 years post-trauma [13]. Persistent spatial learning deficits have been detected after severe, moderate and mild TBI [12, 14–16], but what is still not clear is whether the injury's severity leads to proportional or equivalent spatial learning deficit post-trauma.
Similarly, in animals, spatial learning deficits have been documented after experimentally-induced severe, moderate and mild TBI [17–20].
Mild TBI leads to diffuse axonal injury and most vulnerable regions are the frontal and temporal lobes [21–26], one highly vulnerable and commonly damaged structure is the hippocampus [17–20, 27]. Damage to the hippocampus secondary to mild TBI results in impaired spatial learning; further, there is evidence that differential lesions to the hippocampus in terms of location and volume result in variable deficits in spatial learning and memory [28–31]. Damage to the hippocampus has been documented in both mild and severe TBI [18, 32], but what still needs to be explored is whether mild and severe TBI lead to comparative damage to the hippocampus, hence spatial learning deficits.
Spatial learning is essential for daily navigation within novel environments [33]. Spatial learning is the ability to form cognitive maps derived from environmental cues, co-ordinates and associations gathered while exploring a novel or a modified familiar environment. Therefore, patients who sustain a TBI that results in persistent spatial learning deficits will have persistent difficulty learning how to navigate in a novel and complex environment or a modified familiar environment. Skelton et al. [14] showed that moderate and severe TBI survivors had difficulty in spatial learning. Similarly, Chuah et al. [12] examined the visual spatial learning and memory capacity of a functional group of mild TBI university students, the results showed that the mild TBI group performed significantly worse than controls on the spatial learning task.
Therefore, the purpose of this experiment was to investigate the mild and severe traumatic brain injury effect on spatial learning performance and extent of hippocampal damage following the injury. The aim of the study was to explore spatial learning deficits in an animal model following controlled mild and severe cortical impact head injury. It was expected that spatial learning will be diminished in both mild and severe injury groups and the decrease in spatial learning performance will be greater in the severe than the mild injury group.
Materials and methods
A randomized repeated measure experimental design was used to examine spatial learning in three independent groups, severe, mild and sham animals following controlled cortical impact head injury. All work was conducted after approval from and in accordance with the University of Michigan and Henry Ford Medical System Committee on Use and Care of Animals and the Unit for Laboratory Animal Medicine. A total of 24 (severe n = 9, mild n = 8, sham n = 7) individually housed (12 hour light/dark cycle) male Wistar rats (300–350 g) with free access to chow and water were included in the study. The animals were allowed 7 days after arrival to adjust to the environment. All animals were handled and weighed on arrival day and on injury day, day 7 after arrival; they were then weighed every other day and handled for 10 consecutive days before testing.
Trauma procedure
All animals were anaesthetized intraperitoneally with chloral hydrate (10%, 350 mg kg−1). The animals were placed on a regulated water heating pad to maintain body temperature at 37°C and the head was fixed in a stereotaxic frame. Two 10 mm diameter craniotomies were performed adjacent to the central suture between lambda and bregma. A second craniotomy was performed to allow for lateral movement of cortical tissue and space for oedema [34, 35]. A controlled cortical impact device was used to induce the injury. Injury was induced by impacting the left cortex with a pneumatic piston containing a 6 mm diameter tip at a rate of 4 m s−1 and 1.5 mm compression known to produce mild injury and 2.5 mm compression known to produce severe injury [8, 36, 37]. Velocity was measured with a linear velocity displacement transducer. In sham-operated control rats, anaesthesia was given and craniotomies were performed, but no injury was induced. After the surgery, the animals were returned to transport cages and were allowed 3–4 hours recovery time. The animals were placed back in their home cages after full motor recovery was observed.
Behavioural testing
To test spatial learning, a modified Morris Water Maze test was used [32, 36, 37]. The Morris water maze spatial learning and memory paradigm requires that animals learn the submerged platform location by using constellations of external cues [38]. The Morris water maze is a well-established spatial learning test of rodents [39]. Traditionally, a fixed platform is placed within the pool for the animals to use as an escape. Therefore, escape latency, time to reach the platform, is commonly used to assess spatial learning. The number of trials varies between studies. However, each sequence of trials ends with a probe trial; the platform is removed from the pool and the time the animals spend searching where the platform was located is measured. Typically, the normal rat will spend more time searching where the platform was located; the animals retrieve encoded spatial cues to search for the escape platform. The probe trial outcome, the time spent searching in the target location for the platform, is another spatial learning and memory indicator. Since the probe trial has to be performed as the final trial of each testing interval early spatial encoding deficits cannot be detected [37]. If the probe trial following fixed location escape platform trials is performed earlier during the testing interval, the normal animal will experience ‘expectancy violation’ [37] and will learn that the platform might not be in its' target location and will start searching elsewhere within the pool, therefore, the subsequent animal behaviour will not be based on learned spatial cues. This is why a probe trial is usually performed at the end of each testing interval to capture the animals' spatial learning and memory. Also, the animals' behavioural impairment might not only indicate spatial learning deficit, but impaired search strategy and impaired ability to change the search strategy [37, 38, 40]. The Morris water maze is a well-established measure of spatial learning and memory, but does not optimally allow measuring the animals' search strategies. The modified Morris water maze test used in this study allows for the investigation of spatial learning and searching strategies. Each trial of this modified test acts like a probe trial without the expectancy violation confounding factor because the escape platform, although always located within one of the four pool quadrants, is moved every trial to a different location within the same quadrant, as seen in Figure 1. Therefore, the animals are encouraged to search in the target quadrant; the normal animal will spend a high percentage of time searching within the target quadrant for the platform which indicates spatial learning [37].
Figure 1.
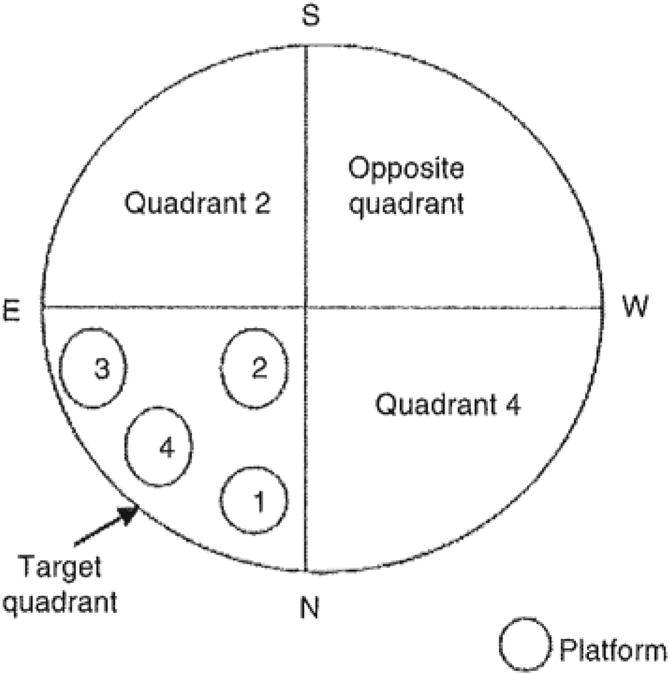
Different platform locations within the North East quadrant (target quadrant). The platform or target location was moved every trial within the North East quadrant in the fourlocations shown in the figure. Location 1, 2, 3 and 4 were fixed for all animals.
On day 20 post-trauma, all the rats were placed in a circular dark coloured water tank (180 cm in diameter and 45 cm height). An invisible platform (15 cm in diameter and 35 cm in height) was placed 1.5 cm below the water's surface. The water temperature was maintained at 30°C. The pool was located in a large testing room, where there were many external and visible cues such as pictures and lamps. The cues and the experimenter's location (Norm-East quadrant) were kept constant throughout the testing days (Figure 1). Each rat was tested for 5 consecutive days, four trials per day. The pool was divided into four equal quadrants designated as North East, South East, North West and South West. At the start of each trial, each rat was placed at one of the four quadrants. The starting point was fixed in the South quadrant followed by North then East and West. The rats were placed in each quadrant facing the tank's wall and allowed to swim until they found the platform or for a maximum of 90 seconds. Once the animals reached the platform they were left on it for 20 seconds before being returned to their cage. If the animal was unable to find the platform within 90 seconds, the trial was terminated and a maximum score of 90 seconds was assigned. In this case, the experimenter guided the animal to the platform and allowed it 20 seconds of exploration before being returned to its' cage. For each rat and on each trial, the platform was placed in a different location within the North East (NE) quadrant throughout the 5 days testing period, as seen in Figure 1. These four locations were kept constant for each trial throughout the 5 days. Because the platform was always located and moved within the NE quadrant, the animals are expected to learn the escape platform spatial location within the correct quadrant and spend more time searching within the target quadrant for the submerged platform. The percentage of time travelled within each quadrant, which is relative to the total amount of time spent swimming in all quadrants before reaching the platform and the time to platform (latency) and the swim speed in seconds were automatically calculated. Data were automatically collected by the HVS Image 2020 Plus Tracking System (US HVS Image, San Diego, CA).
Tissue preparation
On day 25 post-surgery, 3 hours after the last day of testing, the animals were anaesthetized intraperitoneally with 5–10% chloral hydrate and perfused transcardially with saline solution. The brains were then removed and fixed in 10% formalin solution for 4 days at room temperature then cut into seven consecutive coronal sections (A–G). Approximately 12 hours after cutting the brains into seven sections, the brains were processed and embedded in paraffin. A series of seven consecutive sections, 6 μm thick sections, were cut through a microtome of each of the seven brain sections.
Lesion volume analysis
To estimate the lesion volume, a series of the seven brain sections of each animal were stained with hematoxylin and eosin (H & E staining) and analysed using a 10 × objective and a computer image analysis system MCID [32, 36]. The volume of each hemisphere was calculated by measuring the area of the hemisphere and subtracting the lesion area from each section and multiplying by the section thickness and the sampling interval [41] based on Paxinos and Watson atlas of the rat brain. Using the MCID and EXCEL computer software, the lesion volume was calculated.
H&E neuron count
To estimate the number of neurons in bilateral (ipsilateral and contralateral to the injury site) hippocampal areas CA3 and dentate gyrus (DG), a series of pictures of the two hippocampal regions were captured from a light microscope (200× magnification) for each animal. Manually using the Metamorph computer software, the images were viewed and the neurons were counted in both CA3 and dentate gyrus. Linear measurement (mm) of the brain regions was obtained and number of neuron by distance (mm) was calculated and analysed for each brain region.
Immunofluorescence
Because H&E is not a neuron-specific stain and the cells cannot be differentiated using this type of stain, microtubule associated protein 2 (MAP 2) immunofluorescent stain was used. Also, because the authors were interested in examining the synaptic density after TBI, synaptophysin immunofluorescent stain was used as well. Synaptophysin is a synaptic vesicle glycoprotein; it is a specific marker of the presynaptic terminal [42]. MAP2 is found in the nerve cells and participates in the function of differentiating between the different structures of the cell, it is mostly found in the dentrites of the nerve cells [43].
After dehydration, two brain sections (E and F through the dorsal DG) were boiled in 1% citric acid buffer (ph 6.0) in a microwave oven for 10 minutes and cooled down at room temperature and incubated in 1% saponin for 3 hours. Then the sections were incubated in 1% BSA to block the non-specific signals. Using the same buffer solution, the sections were incubated overnight at 4°C in primary antibodies. Two sets of slides containing hippocampal brain region CA3 through the dorsal DG from each animal were used to stain for each antibody separately (monoclonal mouse anti-MAP2 and monoclonal mouse anti-Synaptophysin (chemicon, Temecula, CA)) followed by 2 hours at room temperature in corresponding fluorochrome conjugated goat secondary antibodies (anti-mouse FITC, Jackson ImmunoResearch, West Grove, PA). The sections were counterstained with propidium iodide (PI, Dako). Each of the above steps was followed by a series of 5 minutes rinses in PBS. The sections were mounted with ProLong antifade medium (Molecular probes, Eugene, OR). Sections were then observed under a fluorescent microscope of 200× magnification and a series of digital images of the hippocampal regions CA3 and DG was captured.
Cell counting
Cell counting was performed by the experimenter who was blind to the group each animal belonged to at the time of the analysis. MAP2/PI positive cells were defined as the survival neurons and counted manually in the CA3 and DG regions. Two sections with 50 μm interval were analysed (E and F) under a fluorescent microscope at 200× magnification. The positive cells were counted in bilateral (ipsilateral and contralateral to the injury) hippocampal regions using the MCID image analyser. The number of neurons per mm2 was estimated and compared among groups [32].
Density measurement of synaptophysin
Another two sections with 50 μ interval (E and F) were stained and images were digitized using a fluorescent microscope of 200× magnification. Synaptophysin density (pixel/mm2) was calculated using MCID image analyser computer software. Then, the percentage density was measured in both ipsilateral and contralateral CA3 and DG brain regions using MCID image analyser computer software [32].
Statistical analysis
The histology results were entered into Excel spreadsheets and imported into SPSS software. One-way ANOVA with Bonferroni correction was performed to analyse the difference between the groups.
The behavioural raw data were automatically entered into Excel spreadsheets and imported into SPSS software. Graphical methods were used for individual observation to identify outliers. All data points were included in the analysis. The dependent variables that were calculated for each group are escape latency (time to platform) and percentage of time spent swimming in each one of the four quadrants relative to the total time spent in the pool (90 seconds). All measurements are expressed as the group mean escape latency (seconds) ± standard error of the mean and mean percentage time spent in each quadrant (%) ± standard error of the mean. Non-parametric Wilcoxin-Mann-Whitney two-sample U-test with p < 0.05 was used due to the small sample size to examine the mean differences per day within and between the groups. Mixed model repeated measures analysis was performed to test the mean differences between groups over five experiment days; with injury vs non-injury as fixed effect (group effect) and 5 days of testing (4 trials/day) as the random effect.
Results
Lesion volume
The lesion volume was calculated using the MCID image analyser software. The mean percentage lesion volume of the animals with severe injury (n = 8; 15.95%± 1.69) was significantly greater than the animals with mild injury (n = 7; 4.85%±0.58). The results indicate that a mild controlled cortical impact head injury using 1.5 mm compression leads to significantly smaller lesion volume, as seen in Figure 2, and less damage to the cortex and adjacent structures, as seen in Figure 3.
Figure 2.
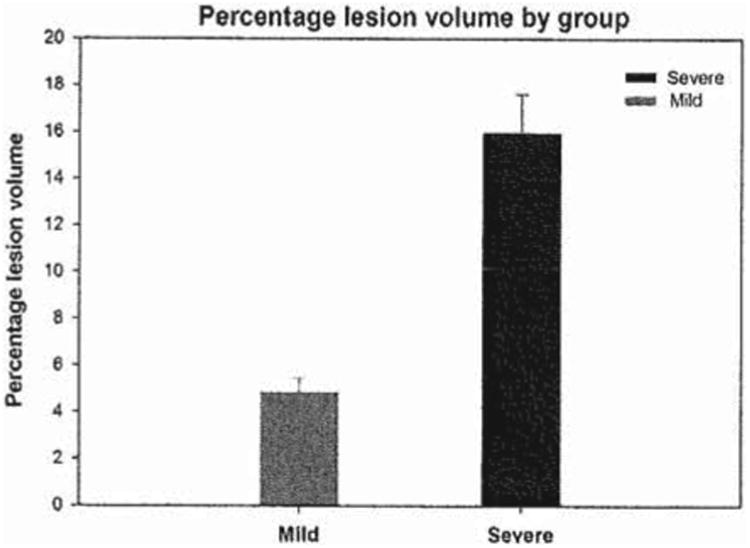
Mean percentage lesion volume by group. The mean percentage lesion volume of animals with severe injury was 15.95% ±1.69 (n = 8). The mean percentage lesion volume of animals with mild injury was 4.85% ±0.58 (n = 7). The difference between the two groups is statistically significant (p<0.05).
Figure 3.
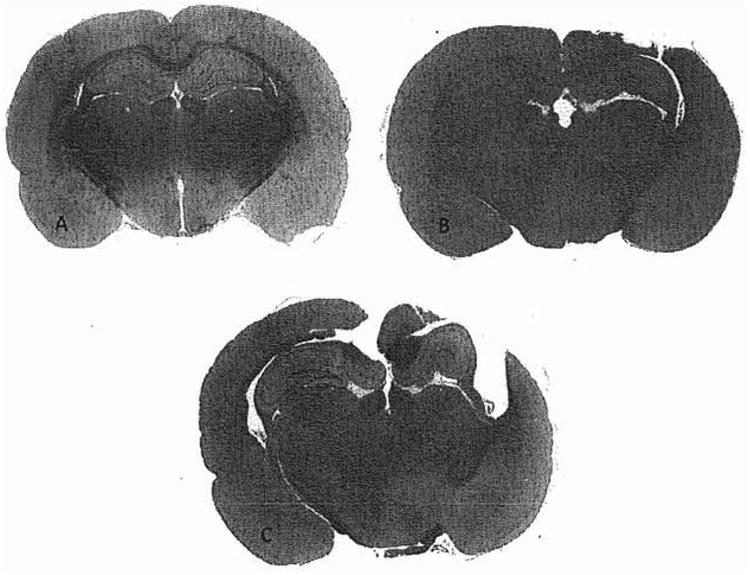
Representative brain sections of each animal group. Images show significantly smaller cortical and adjacent structures damage between the groups. (a) Sham. (b) Mild injury. (c) Severe injury.
H&E neuron count
The H&E stained cells were counted manually using Metamorph computer software in bilateral CA3 and dentate gyrus. As expected, the mean cell count of the animals with severe injury in CA3 ispsilateral hemisphere was significantly smaller than the cell count of the mildly injured and sham animals. Interestingly, the mean cell count of the animals with severe injury in the CA3 contralateral was significantly greater than the cell count of the sham group; but not significantly different between the animals with mild injury. The difference in cell count between the group with mild injury and sham animals was not statistically significant in ipsilateral and contralateral CA3 regions, as seen in Table I. In the dentate gyrus the animals with severe injury had significantly fewer H&E stained cells in the ipsilateral DG region than animals with mild injury and sham animals (Table I). In the ipsilateral DG region, the cell count was not different between the animals with mild injury and sham animals. Interestingly, the contralateral H&E cell count showed a significantly greater cell number in the dentate gyrus of the animals with mild injury than animals with severe injury and sham animals. The cell count difference between the sham group and animals with severe injury was not statistically significant in the contralateral dentate gyrus area; however, it was significantly different between the sham group and the animals with mild injury. These results suggest that a compensatory neurogenesis in the contralateral CA3 and dentate gyrus may be taking place, but since the H& E stain is not a neuron-specific stain, neuron counting was performed using MAP 2 staining. Nonetheless, these results showed that an estimate of the number of neurons in animals with mild injury was not significantly altered in the ipsilateral CA3 and DG region and not smaller than the sham animals in contralateral CA3 and DG at 25 days post-injury.
Table I.
Histology results by group (severe, mild and sham) and for each brain region (hippocampal regions: CA3 and dentate gyrus).
| CA3 ipsilateral | CA3 contralateral | DG ipsilateral | DG contralateral | |
|---|---|---|---|---|
| H&E stain | ||||
| Severe injury group (n = 5) | 140.52 ± 8.81* | 178.02 ± 9.41* | 359.51 ± 8.48* | 474.70 ± 8.20 |
| Mild injury group (n = 5) | 171.16 ± 6.68 | 174.16 ± 5.68 | 48l.46 ± 14.36 | 609.79 ± 34.12** |
| Sham (n=5) | 154.39 ± 16.47 | 164.39 ± 6.47 | 490.74 ± 41.36 | 492.18 ± 24.20 |
| MAP 2 neuron count | ||||
| Severe injury group (n = 5) | 740.52 ± 17.61* | 878.02 ± 17.21* | 1238.2 ± 30.48* | 1360.3 ± 29.20* |
| Mild injury group (n = 5) | 1634.2 ± 22.58** | 1744.16 ± 27.88** | 2481.4 ± 33.26** | 2378.7 ± 39.22** |
| Sham (n = 5) | 1844.3 ± 55.37 | 1876.49 ± 51.37 | 2643.3 ± 81.36 | 2754.4 ± 84.20 |
| Synaptophysin percentage density | ||||
| Severe injury group (n = 5) | 36.34% ± 6.36* | 38.25% ± 5.11*** | 37.48% ± 7.09*** | 46.41% ± 4.74*** |
| Mild injury group (n = 5) | 43.35% ± 1.53 | 43.43% ± 6.15 | 40.80% ± 3.86**** | 46.58% ± 3.43**** |
| Sham (n = 5) | 43.40% ± 2.70 | 43.75% ± 2.32 | 56.06% ± 5.17 | 53.77% ± 4.03 |
p < 0.05; Animals with severe injury compared to animals with mild injury and sham animals.
p < 0.05; Animals with mild injury compared to animals with severe injury and sham animals.
p < 0.05; Animals with severe injury compared to sham animals.
p < 0.05; Animals with mild injury compared to sham animals.
MAP 2 neuron count
The mean number of neurons per mm2 was calculated for the ipsilateral and contralateral regions and compared between the groups. One-way ANOVA analysis with Bonferroni correction showed a significant group effect on number of MAP2 neurons in ipsilateral and contralateral CA3 and dentate gyrus (CA3 ipsi; F(2,21) = 3056.77, p<0.0001; CA3 contra; F(2,21) = 2374.25, p< 0.0001; DG ispsi; F(2,21) = 2156.29, p<0.0001; DG contra; F(2,21) = 1601.32, p< 0.0001). As anticipated, the animals with severe injury showed a decreased number of neurons in bilateral areas CA3 and DG compared to the sham (p < 0.0001) and animals with mild injury (p < 0.0001), as seen in Table I. Similarly, the animals with mild injury showed a significantly lower number of neurons in bilateral CA3 and DG regions than sham animals (p < 0.0001). The animals with severe injury had a significantly lower number of neurons compared to the animals with mild injury and sham animals (Table I).
Synaptophysin percentage density
One-way ANOVA analysis with Bonferroni correction showed a significant group effect on synaptophysin density in the ipsilateral and contralateral CA3 and dentate gyrus (CA3 ipsi; F(2, 21) = 10.79, p = 0.001; CA3 contra; F(2, 21) = 4.068, p = 0.034; DG ispsi; F(2,21) = 12.52, p< 0.0001; DG contra; F(2, 21) = 12.52.32, p< 0.0001). As seen in Table I, the fluorescent density signal of synaptophysin was the highest in both sham and animals with mild injury in both brain regions CA3 and DG bilaterally. The mean percentage synaptophsyin density in the CA3 of the mild and sham animals was equivalent. However, in the animals with severe injury, the percentage synaptophysin density in ipsilateral CA3 region was less than both animals with mild injury (p = 0.002) and sham animals (p = 0.003). However, the synaptophysin density in contralateral CA3 area between the animals with severe injury and the animals with mild injury and sham animals was not statistically significant.
Similarly, the synaptophysin signal density in the contralateral CA3 of the animals with mild injury was not different than the sham group. Yet, in the dentate gyrus, ipsilateral and contralateral region, the synaptophysin density was significantly lower in the animals with severe injury than the sham group (p < 0.0001 and p = 0.001) and not different than the animals with mild injury (Table I). The mean percentage of synaptophysin density in the dentate gyrus of the sham animals was significantly greater than both animals with mild and severe injury.
These results suggest that a mild controlled cortical impact head injury leads to deficits in synaptophysin density in the dentate gyrus equivalent to the severe injury with a significantly smaller neuronal loss at 25 days post-trauma
Behavioural testing
On day 20 post-trauma, a total of three animals had died secondary to complications related to the induced trauma. The number of animals that survived within each group was as follows, severe n = 8, mild n = 7 and sham n = 6.
Swim speed
Swim speed was examined between the groups and as expected the results showed that swim speed was not significantly different between the three groups of animals, as seen in Figure 4.
Figure 4.
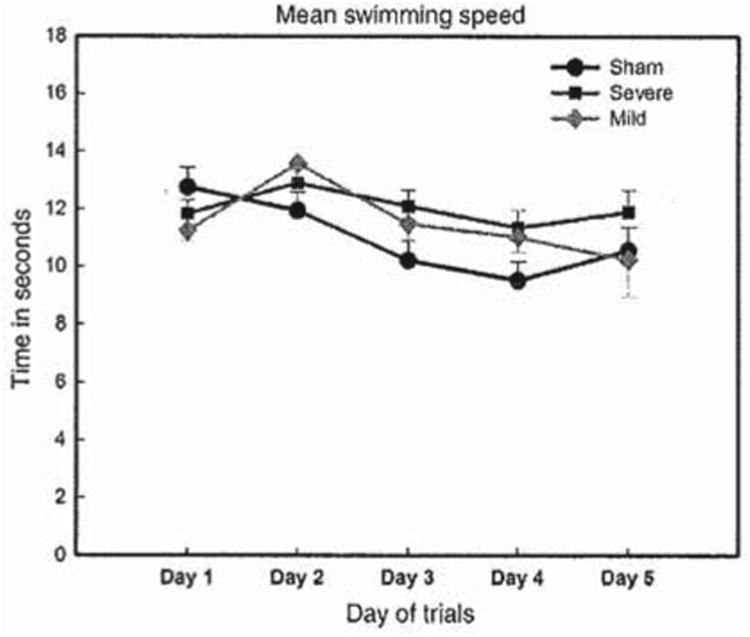
Mean swim speed to target location per group, mild, severe and sham, in a water maze task over 5 testing days. The swim speed of the three animal groups did not differ significantly from day 1–5. The animals with severe injury maintained the same speed from day 1–5; however, the animals with mild injury and sham reached the platform faster on day 5. Nonetheless, the difference between the three groups was not statistically significant.
Escape latency (time taken to reach the platform)
On day 1 of testing, trial one, each one of the rats followed a different swim path to come across the submerged platform and the time to reach the platform varied. A few rats did not find the platform and were guided by the experimenter as described earlier in the behavioural testing section. All animals were able to climb onto the platform and exhibited exploratory behaviour such as rearing, sniffing and looking around.
As expected, the time the sham animals needed to reach the escape platform declined consistently over the 5 testing days, as seen in Figure 5. Similarly, the escape latency of the group with mild injury decreased from day 1 to day 5, as shown in Table II. However, the animals with severe injury maintained a rather flat escape latency curve over the 5 testing days. Within each group, Mann-Whitney U-test analysis showed that the decline in escape time between day 1 and day 5 is statistically significant [sham (U = 223, z = −1.348, p < 0.03); mild (U = 245, z = −1.683, p < 0.04); severe (U = 381, z = −1.82, p < 0.055)].
Figure 5.
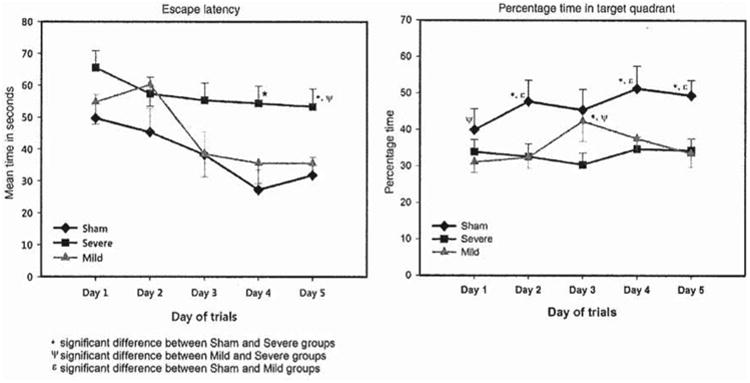
Mean escape latency (seconds) and percentage time spent in target quadrant per group; mild, severe and sham, in a water maze task over 5 testing days. The difference in escape latency between animals with mild injury and sham animals on days 4 and 5 was statistically significant (p < 0.05). The difference in escape latency between animals with severe injury and sham groups on days 4 and 5 is statistically significant (p < 0.05). The difference in escape latency between animals with severe and animals with mild injury is statistically significant on day 5 (p < 0.05). The difference in percentage time spent in the target quadrant between animals with severe injury and sham animals on days 2, 3, 4 and 5 was statistically significant (p < 0.05). The difference in percentage time spent in the target quadrant between animals with mild injury and sham animals on days 2, 3 and 5 was statistically significant (p <0.05). The difference in percentage time spent in the target quadrant between animals with severe injury and animals with mild injury was statistically significant on days 1 and 3 (p < 0.05).
Table II.
Behavioural measures results by group; severe, mild and sham, on testing days 1 and 5.
| Severe injury group | Mild injury group | Sham | ||||
|---|---|---|---|---|---|---|
|
|
|
|
||||
| Day 1 | Day 5 | Day 1 | Day 5 | Day 1 | Day 5 | |
| Mean escape latency (seconds) | 65.53 ± 5.35 | 53.29 ± 5.49 | 54.78 ± 6.87 | 35.57 ± 4.24 | 49.73 ± 7.37 | 31.83 ± 5.63 |
| Percentage time in target quadrant | 33.9 ± 3.36 | 34.34 ± 3.21 | 31.10 ± 2.86 | 33.44 ± 3.81 | 39.96 ± 5.73 | 49.33 ±4.13 |
All animals showed some degree of learning; the sham animals exhibited the greatest and consistent learning curve over time, followed by the animals with mild TBI. However, the declining pattern shown by the animals with mild TBI was not as consistent as that of the sham animals. It took the animals with mild injury until testing day 3 to reach their lowest escape time and from day 3 to day 5 they did not improve their escape latency time and maintained a flat learning curve. As expected, the animals with severe injury maintained a consistent and relatively flat learning curve over 5 testing days (Figure 5).
Group differences over the 5 testing days were revealed by the mixed model repeated measure analysis which showed a significant group effect (df=2, F = 15.059, p < 0.002) and day effect on escape latencies (df=4, F = 7.654, p < 0.007). However, the group-by-day effect on escape latency was not statistically significant (df=8, F= 0.814, p = 0.590). In addition, group differences over 5 testing days between animals with mild injury and sham animals, animals with severe injury and sham groups and animals with severe and animals with mild injury were statistically significant (mild vs sham (df = 254, F = 0.115, p = 0.04); severe vs sham (df =278, F = 1.417, p < 0.0001); severe vs mild (df =294, F = 0.860, p = 0.003)) (Table II).
To conclude, the severe injury group escape latency outcome indicates significant spatial learning impairment. However, the mild TBI revealed delayed spatial learning abilities. The animals with mild TBI injury escape time on days 3, 4 and 5 did not indicate spatial learning deficits.
Spatial learning patterns
The sham animals spent an increasing percentage of time in the target quadrant searching for the platform, which indicates that the sham animals learned the task properly and searched extensively for the escape platform location within the correct quadrant, as seen in Table II. Yet again, as expected, the animals with severe injury spent less percentage time in the target quadrant and exhibited a flatter learning curve between day 1 and day 5 than the sham animals. However, the performance of the animals with mild injury was surprising. Although the animals with mild injury's escape latency time was equivalent to the sham group on days 4 and 5, the percentage time spent searching for the platform in the target quadrant was equivalent to that of the animals with severe injury, as seen in Figure 5. The mixed model repeated measure analysis revealed a significant group effect on percentage time spent in the correct quadrant (df = 2, F= 16.108, p < 0.002); however, there was no effect of testing days on percentage time spent swimming in the target quadrant.
The different spatial learning search patterns were explored over the 5 testing days within each group. Also, using Mann-Whitney U-test the mean difference in percentage time spent searching for the platform in the target quadrant between the groups on days 4 and 5 showed that on days 4 and 5, the group with mild injury spent significantly less percentage time than the sham animals in the target quadrant. Similarly, the group with severe injury' spatial learning performance did not improve and was significantly worse than the sham animals (day 4: mild vs sham (U = 226, z = −2.019, p <0.02); severe vs sham (U = 246, z = −2.227, p < 0.01); day 5: mild vs sham (U =144, z = −2.969, p <0.001); severe vs sham (U = 203, z = −2.997, p < 0.003)) (Table II and Figure 5).
Because the experimenter was consistently standing near the target quadrant, the experimenter became an important constant spatial cue. Therefore, this spatial cue was expected to aid the animals greatly when searching for the escape platform in the target quadrant. Hence, it was predicted that the mean (four trials/day) percentage time spent in the target quadrant would be higher than the percentage time spent in the target quadrant on trial one of day 1, since the rats are still naïve and did not learn the task expectation yet. Also, it was expected that the animals would encode the experimenter location as a spatial cue and successfully retrieve it and make use of it over the 5 testing days; therefore the time spent in the target quadrant on trial one of each day will approach the mean of the four trials over the following testing days. Therefore, the percentage time spent in the target quadrant on trial one of each testing day per group was compared to the mean percentage time per trial on each testing day among all animal groups, as seen in Figure 6.
Figure 6.
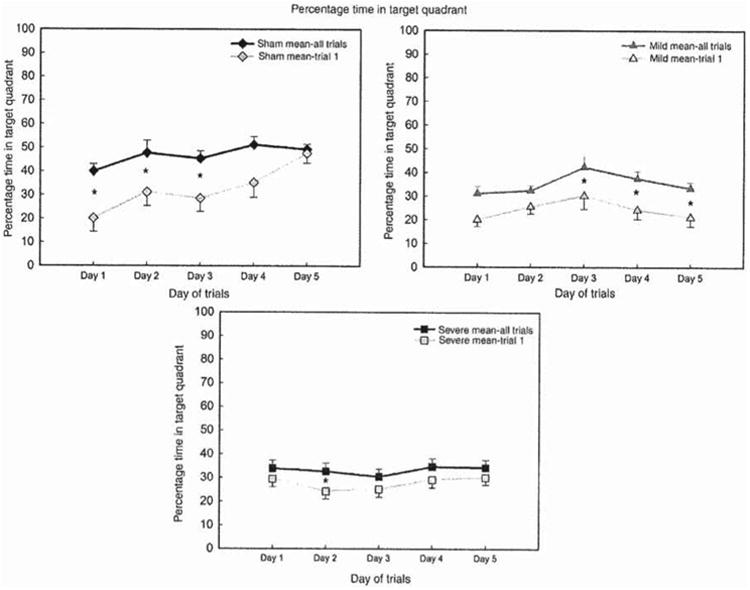
Sham, mild and severe groups; mean percentage time (fourr trials/day) spent in the target quadrant and percentage time spent in target quadrant on trial one each day over 5 testing days. The difference in percentage time spent in target quadrant on Trial 1 and the mean of the four trials per day was statistically significant for the sham group on days 1, 2 and 3 (p < 0.05), indicating that by day 4 and 5 the learning and retention across trials was achieved and equivalent. Whereas, the difference in percentage time in target quadrant on trial 1 and the mean of the four trials per day was statistically significant (p < 0.05) for the animals with mild injury on days 3, 4 and 5, indicating that memory overnight of the spatial location was impaired; however, they retained some shorter-term spatial learning capacity across trials. On the other hand the difference between trial one and the mean time spent in the target quadrant of the animals with severe injury was statistically significant (p < 0.05), only on day 2 indicating a more severe spatial learning and memory impairment.
As expected, on day 1, the sham animals were able to take advantage of the experimenter location as a major spatial cue, as seen in Figure 6; on trial one of day 1, the sham animals spent ∼20% of the trial time in the target location, subsequently the mean percentage of the four trials time on day 1 increased to ∼40%. Also, as anticipated, the sham animals' spatial learning performance on trial one consistently improved over the following testing day. On day 5, the sham animals' spatial learning performance (percentage time spent in the target quadrant) on trial one and the mean percentage time of the four trials were equal. This indicates intact spatial learning and memory abilities of the sham animals.
However, the animals with mild and severe injury showed a completely different spatial learning and memory curve on trial one of each testing day. The animals with mild and severe injury exhibited, in addition to spatial learning deficits, an inability to encode and retrieve what is expected to be a major spatial cue to aid their spatial learning performance, as seen in Figure 6. For both animals with mild and severe injury, the percentage time spent in the target quadrant did not improve over the 5 testing days on trial one of each day. The results show that there was random searching of all groups on the very first trial, with improvement over trials on each day, but only the sham group showed memory for the location on the first trial of each subsequent testing day; in other words, overnight memory was impaired in both groups with mild and severe TBI.
The animals with mild injury's mean percentage time spent in the target quadrant on each testing day was consistently greater than the percentage time spent in the correct quadrant on trial one. This indicates that the animals with mild injury preserved some spatial learning abilities and encoded for a short period of time spatial information and cues more than the animals with severe injury; however, this spatial information was not retained over the 5 testing days.
Since trial one of each consecutive testing day is the most sensitive indicator of learning and retention of information, the escape latency and percentage time spent in the target quadrant was normalized to trial one of day 1; which is the first learning trial. The first time the animals learn the location of the platform. Hence, trial 1 of day 1 was assigned the value of 1. Subsequently, trial 1 values of days 2, 3, 4 and 5 of both escape latency and percentage time spent in the target were divided by the day 1/trial 1 value; as seen in Figure 7.
Figure 7.
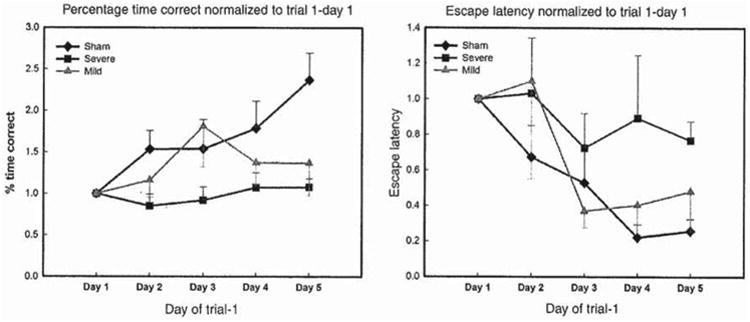
Escape latency and percentage time spent in target quadrant performance normalized to trial 1 of day 1 per group; sham, mild and severe. The sham animals escape latency decreased from 1 to 0.2 by day 5, the animals with mild injury' escape latency decreased from 1 to 0.5; however, the animals with severe injury' escape latency decreased only from 1 to 0.8. The percentage time the sham animals spent in the target quadrant increased from 1 to 2.5 on day 5. The percentage time the animals with mild injury spent in the target quadrant increased from 1 to 0.5; however, the animals with severe injury spent approximately the same percentage time in the target quadrant from day 1 to 5.
The trial 1 escape latency over 5 days of testing results showed that the animals with mild injury's performance was not as good as the sham animals on day 5 of testing. The sham animals escape latency improved by ∼80% by day 5 of testing. Nevertheless, the animals with mild injury's escape latency decreased by ∼50% on day 5 compared to the animals with severe injury's escape latency that decreased only by 20%, as seen in Figure 7.
Similarly, the sham animals' spent 1.5 time more percentage time in the target quadrant by day 5 of testing; however, the animals with severe injury maintained almost a flat learning curve and did not show any improvement in their search strategies over time. On the other hand, the animals with mild injury spent more time in the target quadrant than the animals with severe injury, which indicates slight preservation of spatial learning and retention abilities. The animals with mild injury spent ∼0.5 time more percentage time in the target quadrant on day 5 of testing. Still, on day 25 post-injury the animals with mild injury did not recover their spatial learning abilities in comparison to the sham animals, as seen in Figure 7; but their performance was better than those with severe injury.
In summary, both mild and severe TBIs lead to proportional learning deficits in animals. Minimal spatial learning abilities seem to be better preserved after mild TBI than severe TBI.
Discussion
The main finding of this experiment indicates that mild TBI may significantly impair spatial learning abilities. In addition, these deficits seem to be proportional to deficits exhibited as a result of more severe injury and persist up to 25 days post-injury.
Mild TBI animals' observations are in line with previous findings that suggest that mild TBI leads to spatial behavioural deficits [18, 44]. Similarly, the performance of the severe TBI group is consistent with previous work that showed diminished performance on spatial learning and memory in a modified Morris water maze task [32, 36].
The group with mild TBI's spatial learning was impaired following the trauma, but they exhibited a different pattern of deficits than the group with severe injury. When examining escape latency as a spatial learning indicator, animals with mild injury show a delayed improvement in performance. The animals reached their best time on day 3 and maintained a flat learning curve on testing days 4 and 5. In other words, the animals with mild injury need a longer time to learn the task and to reach an escape time comparable to the sham. This finding is consistent with previous results described by Henninger et al. [44] that showed that animals with mild TBI needed longer times, until 3rd day of testing, to improve their escape latency time.
Although the animals with mild injury improved their escape latency time on testing days 4 and 5, escape latency alone was not a good indicator of spatial learning abilities. The delayed improvement in escape time indicates that animals with mild injury retained some spatial learning abilities more than animals with severe injury. However, if only escape latency was measured, the extent of spatial deficits would have not been detected. Based on the improved escape latency performance, it would have been reasonable to conclude that the animals with mild injury need a longer time to learn than the sham animals. However, examining the percentage search time spent in the target quadrant revealed a more complex picture of spatial learning deficit after mild TBI.
Despite the improved escape time, the animals with mild injury spent significantly less percentage time in the target quadrant than the sham animals and an almost equal percentage time as the animals with severe injury on days 20–25 post-injury. These findings are consistent with previous findings by Sheff et al. [18] who showed that the percentage search time in the target location of the animals with mild injury was impaired compared to sham animals and as impaired as the animals with severe injury, except that these deficits were present on days 7 and 14 post-injury. Moreover, Sheff et al. [18] used a different paradigm to test spatial learning; the traditional model of the Morris water maze. In this model, the platform location is fixed within one quadrant of the pool throughout the testing trials followed by a probe trial at the end of testing trials. The probe trial result is a reliable indicator of spatial learning since the animals retrieve encoded spatial co-ordinates to search for the platform in the target location. In the present study, each trial acted as a probe trial. The significant decrease in percentage time spent in the target quadrant that was shown is consistent with the decreased percentage time spent in target location on probe trial administered by Sheff and his team. Sheff et al, [18] showed that animals with mild TBI performed significantly worse than controls and equivalent to animals with moderate injury on the probe trial following spatial learning.
Yet, moving the platform within the target quadrant not only acts as a probe trial, but allows measuring the animals' flexibility and ability to change their search strategy [37]. Therefore, the performance of animals with mild injury indicates a decrease in flexibility and impaired search strategy comparable to animals with more severe injury. The animals with mild injury seem to be able to get to the target; however, their ability to modify their search strategy is impaired. An inflexible search strategy may be manifested as taking longer routes to get to target, retracing paths or making more turns to orient direction in space. Moreover, inflexible spatial search may indicate altered cognitive spatial maps and routes representations within the hippocampus or inability to modify already formed place cells following modified spatial information. This data suggest that animals with mild head injury show sub-optimal search strategies.
These findings suggest that a significant spatial learning deficit follows mild TBI, but these deficits are manifested differently following mild and severe injury. The animals with mild injury preserved some intact spatial learning capacities, as indicated by the escape time. Also, the animals with mild injury were able to limit their search and their search was not completely random within the pool, which indicates residual learning capacity; nonetheless, its' ability to generate an effective spatial search is impaired.
The spatial learning deficits seem to be secondary to impaired encoding abilities. Improving the search time, but having impaired search strategies indicate ineffective use of spatial co-ordinates and cues. Despite many available and constant spatial cues including the experimenter, an important cue being the rescuer, the injured animals were not able to encode the environment and familiarize to it. After gathering spatial information and cues, normal animals retrieve it in order to quickly and directly locate the goal using an allocentric search strategy. Following mild TBI, animals seem unable to associate the experimenter with the goal effectively. These finding may suggest that animals are using an allocentric search strategy that is not informed and is also inflexible.
Scheff et al. [18] examined both encoding or acquisition abilities of the animals with mild injury in addition to retention. The animals with mild injury were only impaired during acquisition. However, it is important to note that Scheff et al. [18] examined spatial learning on days 7 or 14 and performed the three learning trials block during one testing day. Nonetheless, spatial information learned before the injury was retained. This indicates that the spatial learning deficits are secondary to impaired encoding capacity. Similarly, this study's results showed that animals with mild injury exhibit prolonged encoding difficulties.
The histology results of the animals with mild injury showed a decrease in pre-synaptic density of the neurons in the dentate gyrus, a brain region known to support encoding of spatial information. Ramirez ct al. [45] showed that spatial learning and memory leads to mossy fibre synaptogenesis in the dentate gyrus. The authors used Timm's staining method to stain the metal zinc, highly present in the mossy fibres, especially in the region that projects from the DG to CA3 (stratum oriens) and examined the brain of the animals during the acquisition and retrieval of a Morris water maze task. The results showed increased synaptogenesis in the mossy fibres that correlated with improved spatial learning and memory performance, mainly in the more septal area of the dorsal hippocampus [45]. Earlier research conducted by Moser et al. [28] showed that the most important region for spatial learning is the septal pole of the dorsal hippocampus. Lee and Kesner [46] built on Moser et al.'s [28] and Ramirez et al.'s [45] results and examined encoding and retrieval functions within the dentate gyrus. The authors suggest that the dentate gryus mossy fibres input into the hippocampal region CA3 are essential for encoding, on the other hand the perforant path inputs from the enterorhinal cortex to area CA3 (PPCA3) are essential for retrieval. Lee and Kesner [46] conducted spatial learning and memory tests after blocking each one of these regions, the mossy fibres and the PPCA3, and the results showed that the mossy fibres input into CA3 are essential for encoding and the PPCA3 blockage interfered with retrieval. Similarly, Rekart et al. [47] examined the modification of the mossy fibres circuit with CA3 during a spatial learning task and showed that the increase in synaptic markers such as synaptophysin observed in the dentate gyrus, rostral–septal region is essential for learning and maintenance of spatial information.
These results suggest that any damage to the dentate gyrus and synaptogenesis abilities within this region will lead to impaired encoding and consequently spatial learning deficits. The results showed that the mild injured animals have less synaptophysin density in the dentate gyrus, which may explain their spatial learning behavioural deficits. More work will be needed to examine the animals' brain regions at early and prolonged periods of time after the injury to investigate the pattern of damage and recovery within these regions and how it relates to spatial learning and memory. Sun et al. [48] examined the recovery of animals that sustained a fluid percussion injury of moderate intensity. Different animals were tested using a Morris water maze at 11–15, 26–30 and 56–60 days post-injury, also the animals were injected with BrdU, a neurogenesis marker, and Fluorogold, a retrograde neuronal tracer. The results showed that the animals exhibited significant spatial learning deficits at 11–15 and 26–30 days post-injury, but cognitive function recovery was seen at 56–60 days post-injury. In addition, at 56–60 days post-injury, 10% of the BrdU labelled cells became dentate gyrus neurons and some of these BrdU labelled cells were synaptophysin positive, which indicates that these cells established neuronal synaptic connections [48]. The results did not show a significant decrease in number of neurons in both CA3 and DG at 25 days post-injury, but a significant decrease in synaptophysin density. This may indicate that neuronal recovery, neurogenesis, at 25 days may have occurred, but there was not sufficient time for synaptogenesis or integration of these neurons, consistent with the observations that the mildly injured animals exhibited cognitive deficits. Given the staining method that was used in this study and the time of sacrifice, 25 days post-injury, this study was not able to verify this hypothesis. Therefore, further investigation is needed after mild head injury to examine whether animals that sustain mild injury follow the same pattern and time needed for recovery of cognitive function described by Sun et al. [48].
Although the animal model does not parallel the human TBI and subsequent spatial learning deficits accurately, these results provide a starting point. More questioning and investigations of the spatial deficits that follow TBI of different intensities is needed. Further studies are required to explore the difference in search strategies that emerge after a TBI and how that influences the quality-of-life of the patients and their interaction with the environment. The implications of such deficits on humans with history of mild TBI need further investigation. These results suggest that, after mild TBI, subjects will be able to reach spatial targets, but are more prone to wander away from the efficient path and spend longer time at a distance from the target. Also, these spatial learning deficits may be manifested as an inability to find alternative routes within a familiar environment in the case of an emergent barrier. Another possible symptom is impaired ability to find items within familiar locations.
Acknowledgments
The authors would like to extend special thanks to Anton Goussev, MD; Chang Sheng Qu, PhD; and Ye Xiong, PhD for their assistance and technical support.
This work was conducted at Henry Ford Hospital and funded from the National Institutes of Health P01 NS042345, RO1 NS04225905, RO1 NS 05228001, T32 NR 007074 and F31 NR009741.
Footnotes
Declaration of Interest:The authors report no conflicts of interest.
References
- 1.Langlois JA, Rutland-Brown W, Thomas KE. Traumatic brain injury in the United States: emergency department visits, hospitalizations, and deaths. Atlanta, GA: Centers for Disease Control and Prevention, National Center for Injury Prevention and Control; 2006. [Google Scholar]
- 2.Alexander MP. Mild traumatic brain injury: Pathophysiology natural history and clinical management. Neurology. 1995;45:1253–1260. doi: 10.1212/wnl.45.7.1253. [DOI] [PubMed] [Google Scholar]
- 3.Aubry M, Cantu R, Dvorak J, Graf-Baumann T, Johnston K, Kelly J, et al. Summary and agreement statement of the first international conference on concussion in sport Vienna (2001). Recommendations for improvement of safety and health of athletes who may suffer concussive injuries. British Journal of Sports Medicine. 2002;36:888–897. doi: 10.1136/bjsm.36.1.6. [DOI] [PMC free article] [PubMed] [Google Scholar]
- 4.Kim E, Lauterbach EC, Reeve A, et al. Neuropsychiatric complications of traumatic brain injury: A critical review of the literature (A report by the ANPA committee on research) Journal of Neuropsychiatry and Clinical Neuroscience. 2007;19:106–127. doi: 10.1176/jnp.2007.19.2.106. [DOI] [PubMed] [Google Scholar]
- 5.Halterman CI, Langan J, Drew A, Rodriquez E, Osterring L, Chou LS, et al. Tracking the recovery of visuospatial attention in mild traumatic brain injury. Brain. 2006;129:747–753. doi: 10.1093/brain/awh705. [DOI] [PubMed] [Google Scholar]
- 6.Chin-Cheng Y, Yong-Kwang T, Mau-Sun H, Sheng-Jean H. The association between post-concussion syndrome and clinical outcomes for patients with mild traumatic brain injury. Journal of Trauma Injury, Infection and Critical Care. 2007;62:657–663. [Google Scholar]
- 7.Dixon CE, Clifton GL, Lighthall JW, Yaghmai AA, Hayes RL. A controlled cortical impact model of traumatic brain injury in the rat. Journal of Neuroscience Methods. 1999;39:253–262. doi: 10.1016/0165-0270(91)90104-8. [DOI] [PubMed] [Google Scholar]
- 8.Cernak I. Animal models of head injury. The Journal of the American Society of Experimental Neurotherapeutics. 2005;2:410–422. doi: 10.1602/neurorx.2.3.410. [DOI] [PMC free article] [PubMed] [Google Scholar]
- 9.Ludin A, de Boussard C, Edman G, Borg J. Symptoms and disability until 3 months after mild traumatic brain injury. Brain Injury. 2006;20:799–806. doi: 10.1080/02699050600744327. [DOI] [PubMed] [Google Scholar]
- 10.McAllister TW, Flashman LA, McDonald BC, Saykin AJ. Mechanisms of working memory dysfunction after mild and moderate TBI: Evidence from functional MRI and neurogenetics. Journal of Neurotrauma. 2006;23:1450–1467. doi: 10.1089/neu.2006.23.1450. [DOI] [PubMed] [Google Scholar]
- 11.Dikmen S, Mclean A, Temkin N. Neuropsychological and psychosocial consequences of minor head injury. Journal of Neurology, Neurosurgery, and Psychiatry. 1986;49:1227–1232. doi: 10.1136/jnnp.49.11.1227. [DOI] [PMC free article] [PubMed] [Google Scholar]
- 12.Chuah YML, Maybery MT, Fox AM. The long term effects of mild head injury on short term memory for visual form, spatial location and their conjunction in a well-functioning university students. Brain and Cognition. 2004;56:304–312. doi: 10.1016/j.bandc.2004.08.002. [DOI] [PubMed] [Google Scholar]
- 13.Zee RF, Zeller D, Belman J, Miller J, Mathews J, Ferneau-Belman D, Robbs R. Long–term consequences of severe closed head injury on episodic memory. Journal of Clinical and Experimental Neuropsychology. 2001;23:671–695. doi: 10.1076/jcen.23.5.671.1247. [DOI] [PubMed] [Google Scholar]
- 14.Skelton RW, Bukach CM, Laurance HE, Thomas KGF, Jacobs JW. Humans with traumatic brain injuries show place-learning deficits in computer-generated virtual space. Journal of Clinical and Experimental Neuropsychology. 2000;22:157–175. doi: 10.1076/1380-3395(200004)22:2;1-1;FT157. [DOI] [PubMed] [Google Scholar]
- 15.Hartley T, Bird CM, Chan D, Cipolott L, Husain M, Vargha-Khadem F, Burgess N. The hippocampus is required for short-term topographical memory in humans. Hippocampus. 2007;17:34–48. doi: 10.1002/hipo.20240. [DOI] [PMC free article] [PubMed] [Google Scholar]
- 16.Shrager Y, Bayley PJ, Botempi B, Hopkins RO, Squire LR. Spatial memory and the human hippocampus. Proceedings of the National Academy of Sciences; 2007; pp. 2961–2966. [DOI] [PMC free article] [PubMed] [Google Scholar]
- 17.Hamm RJ, Dixon CE, Gbadebo DM, Singha AK, Lyeth BG, Jenkins LW, Hayes RL. Cognitive deficits following traumatic brain injury produced by controlled cortical impact. Journal of Neurotrauma. 1992;9:11–20. doi: 10.1089/neu.1992.9.11. [DOI] [PubMed] [Google Scholar]
- 18.Scheff SW, Baldwin SA, Brown RW, Kraemer PJ. Morris water maze deficits in rats following traumatic brain injury: Lateral controlled cortical impact. Journal of Neurotrauma. 2007;14:615–627. doi: 10.1089/neu.1997.14.615. [DOI] [PubMed] [Google Scholar]
- 19.Kline AE, Massucci JL, Marion DW, Dixon CE. Attenuation of working memory and spatial acquisition deficits after a delayed and chronic bromocriptine treatment regimen in rats subjected to traumatic brain injury by controlled cortical impact. Journal of Neurotrauma. 2002;19:415–425. doi: 10.1089/08977150252932370. [DOI] [PubMed] [Google Scholar]
- 20.Whiting MD, Hamm RJ. Traumatic brain injury produce delay dependent memory impairment in rats. Journal of Neurotrauma. 2006;23:1529–1534. doi: 10.1089/neu.2006.23.1529. [DOI] [PubMed] [Google Scholar]
- 21.Povlishock JT. Pathobiology of traumatically induced axonal injury in animals and man. Annals of Emergency Medicine. 1993;22:980–986. doi: 10.1016/s0196-0644(05)82738-6. [DOI] [PubMed] [Google Scholar]
- 22.Kant R, Smith-Seemiller L, Isaac G, Duffy J. Tc-hmpaospect in persistent post-concussion syndrome after mild head injury: Comparison with MRI/CT. Brain Injury. 1997;11:115–124. doi: 10.1080/026990597123700. [DOI] [PubMed] [Google Scholar]
- 23.Umile EM, Plotkin RC, Sandel ME. Functional assessment of mild traumatic brain injury using spect and neuropsychological testing. Brain Injury. 1998;12:577–594. doi: 10.1080/026990598122340. [DOI] [PubMed] [Google Scholar]
- 24.Umile EM, Sandel ME, Alavi A, Terry CM, Plotkin RC. Dynamic imaging in mild traumatic brain injury: Support for the theory of medial temporal vulnerability. Archives of Physical Medicine & Rehabilitation. 2002;83:1506–1513. doi: 10.1053/apmr.2002.35092. [DOI] [PubMed] [Google Scholar]
- 25.Inglese M, et al. Diffuse axonal injury in mild traumatic brain injury: A diffusion tensor imaging study. Journal of Neurosurgery. 2005;103:298–303. doi: 10.3171/jns.2005.103.2.0298. [DOI] [PubMed] [Google Scholar]
- 26.Belanger HG, Vanderploeg RD, Curtiss G, Warden DL. Recent neuroimaging techniques in mild traumatic brain injury. Journal of Neuropsychiatry and Clinical Neuroscience. 2007;19:5–18. doi: 10.1176/jnp.2007.19.1.5. [DOI] [PubMed] [Google Scholar]
- 27.Tate DF, Bigler ED. Fornix and hippocampal strophy in traumatic brain injury. Learning and Memory. 2000;7:442–446. doi: 10.1101/lm.33000. [DOI] [PubMed] [Google Scholar]
- 28.Moser M, Moser EI, Forrest E, Andersen P, Morris RGM. Spatial learning with a minislab in the dorsal hippocampus. Proceedings of the National Academy of Sciences; 1995; pp. 9697–9701. [DOI] [PMC free article] [PubMed] [Google Scholar]
- 29.Broadbent NJ, Squire LR, Clark RE. Spatial memory, recognition memory, and the hippocampus; Proceedings of the National Academy of Sciences; 2004; pp. 14515–14520. [DOI] [PMC free article] [PubMed] [Google Scholar]
- 30.Clark RE, Broadbent NJ, Squire LR. Hippocampus and remote spatial memory in rats. Hippocampus. 2005;15:260–272. doi: 10.1002/hipo.20056. [DOI] [PMC free article] [PubMed] [Google Scholar]
- 31.Martin SJ, Clark RE. The rodent hippocampus and spatial memory: From synapses to systems. Cellular and Molecular Life Sciences. 2007;64:401–431. doi: 10.1007/s00018-007-6336-3. [DOI] [PMC free article] [PubMed] [Google Scholar]
- 32.Lu D, Mahmood A, Goussev A, Schallert T, Qu C, Zhang ZG, Li Y, Lu M, Chopp M. Atorvastatin reduction of intravascular thrombosis, increase in cerebral microvascular patency and integrity, and enhancement of spatial learning in rats subjected to traumatic brain injury. Journal of Neurosurgery. 2004;101:813–821. doi: 10.3171/jns.2004.101.5.0813. [DOI] [PubMed] [Google Scholar]
- 33.O'Keefe J, Nadel L. The hippocampus as a cognitive map. Oxford: Clarendon Press; 1978. [Google Scholar]
- 34.Posmantur Kampfl A, Siman R, Liu J, Zhao X, Clifton GL, Hayes RL. Calpain inhibitor attenuates cortical cytoskeletal protein loss after experimental traumatic brain injury in the rat. Neuroscience. 1997;77:875–888. doi: 10.1016/s0306-4522(96)00483-6. [DOI] [PubMed] [Google Scholar]
- 35.Mahmood A, Lu D, Qu C, Goussev A, Chopp M. Treatment of traumatic brain injury with a combination therapy of marrow stromal cells and atorvastatin in rats. Neurosurgery. 2007;60:546–553. doi: 10.1227/01.NEU.0000255346.25959.99. [DOI] [PubMed] [Google Scholar]
- 36.Lu D, Mahmood A, Qu CS, Goussev A, Schallert T, Chopp M. Erythropoietin enhances neurogenesis and restores spatial memory in rats after TBI. Journal of Neurotrauma. 2005;22:1011–1017. doi: 10.1089/neu.2005.22.1011. [DOI] [PubMed] [Google Scholar]
- 37.Choi SH, Woodlee MT, Hong JJ, Schallert T. A simple modification of the water maze test to enhance daily detection of spatial memory in rats and mice. Journal of Neuroscience Methods. 2006;156:182–193. doi: 10.1016/j.jneumeth.2006.03.002. [DOI] [PubMed] [Google Scholar]
- 38.Day LB, Schallert T. Anticholinergic effects on acquisition of place learning in the Morris water task: Spatial mapping deficit or inability to inhibit non-place strategies? Behavavioural Neuroscience. 2006;110:998–1005. doi: 10.1037//0735-7044.110.5.998. [DOI] [PubMed] [Google Scholar]
- 39.Morris RGM. Spatial localization does not require the presence of local cues. Learning and Motivation. 1981;12:239–260. [Google Scholar]
- 40.Day LB, Weisend M, Sutherland RJ, Schallert T. The hippocampus is not necessary for a place response but may be necessary for pliancy. Behavioural Neuroscience. 1999;113:914–924. doi: 10.1037//0735-7044.113.5.914. [DOI] [PubMed] [Google Scholar]
- 41.Swanson KL. I'll carry the fork: Recovering a life after brain injury. California: Rising Star Press; 1999. Litter and lingerie; pp. 13–17. [Google Scholar]
- 42.Bonanomi DL, Rusconi L, Colombo CA, Benfenati F, Valtorta F. Synaptophysin I selectively specifies the exocytic pathway of synaptobrevin 2/VAMP2. Biochemical Journal. 2007;404:525–534. doi: 10.1042/BJ20061907. [DOI] [PMC free article] [PubMed] [Google Scholar]
- 43.Fontaine-Lenoir V, Chambraud B, Fellous A, et al. Microtubule-associated protein 2 (MAP2) is a neurosteroid receptor. Proceedings of the National Academy of Sciences; 2006; pp. 4711–4716. [DOI] [PMC free article] [PubMed] [Google Scholar]
- 44.Henninger N, Dutzmann S, Sicard KM, Kollmer R, Bardutzky J, Schwab S. Impaired spatial learning in a novel rat model of mild cerebral concussion injury. Experimental Neurology. 2005;195:447–457. doi: 10.1016/j.expneurol.2005.06.013. [DOI] [PubMed] [Google Scholar]
- 45.Ramirez-Amaya V, Balderas I, Sandoval J, Escobar ML, Bermudez-Rattoni F. Spatial long-term memory is related to mossy fiber synaptogenesis. The Journal of Neuroscience. 2001;21:7340–7348. doi: 10.1523/JNEUROSCI.21-18-07340.2001. [DOI] [PMC free article] [PubMed] [Google Scholar]
- 46.Lee I, Kesner RP. Differential roles of dorsal hippocampus subregions in spatial working memory with short versus intermediate delays. Behavioral Neuroscience. 2007;117:1044–1053. doi: 10.1037/0735-7044.117.5.1044. [DOI] [PubMed] [Google Scholar]
- 47.Rekart JL, Sandoval J, Bermudez-Rattoni F, Routtenberg A. Remodeling of hippocampal mossy fibers is selectively induced seven days after the acquisition of a spatial but not a cued reference memory task. Learning & Memory. 2007;14:416–421. doi: 10.1101/lm.516507. [DOI] [PubMed] [Google Scholar]
- 48.Sun D, McGinn MJ, Zhou Z, Ben Harvey H, Ross Bullock M, Colello R. Anatomical integration of newly generated dentate granule neurons following traumatic brain injury in adult rats and its association to cognitive recovery. Experimental Neurology. 2007;204:264–272. doi: 10.1016/j.expneurol.2006.11.005. [DOI] [PubMed] [Google Scholar]