

Abstract
The omega-3 polyunsaturated fatty acids (ω3PUFAs) are a class of lipids biologically effective for the treatment of inflammatory disorders, cardiovascular disease and cancer. Patients consuming a high dietary intake of ω3PUFAs have shown a low incidence of metabolic disorders, including cancer. Although the effects of ω3PUFAs intake was shown to be involved in the prevention and treatment of these diseases, the underlying molecular mechanisms involved are not well understood. Here, we show that ω3PUFA, docosahexaenoic acid (DHA) enhanced the tumor suppressor function of LKB1. We observed that when LKB1 expressing cells are treated with DHA, there is an increase in LKB1 activity leading to phosphorylation of AMPK and inhibition of mTOR signaling. Abrogation of LKB1 in MCF-7 cells by siRNA reversed this phenotype. Furthermore, cellular metabolism was altered and ATP levels were reduced in response to DHA treatment, which was further attenuated in cells expressing LKB1. More importantly, in mammary epithelial cells expressing LKB1, the rate of glycolysis was decreased as a result of diminished expression of glycolytic enzymes. Functionally, these events lead to a decrease in the migration potential of these cells. Overall, our discovery shows for the first time that LKB1 function is enhanced in response to ω3PUFA treatment, thereby resulting in the regulation of cell metabolism.
Keywords: LKB1, aerobic glycolysis, cell metabolism, omega-3 PUFA, cancer, mTOR signaling, DHA, glycolytic enzymes, hexokinase, LDH-A
Introduction
Metabolic syndrome is characterized by a series of metabolic dysfunctions that leads to deregulation of homeostasis, thereby altering normal cellular metabolism. These events are responsible for hypertension, dyslipidemia, insulin resistance, and cell growth, culminating in heart diseases, diabetes and cancer. Numerous studies have shown a correlation between metabolic syndrome and aberrant signaling pathways (see reviews in refs. 1 and 2). In our study we show that changes in membrane fatty acid composition alter LKB1 signaling and how these changes affect energy homeostasis, survival and ultimately cell metabolism.
LKB1 is a tumor suppressor kinase that has many biological functions, and when mutated gives rise to cancers.3 LKB1 is the primary activator of AMP protein kinase (AMPK), a central regulator of homeostasis, when activated, AMPK leads to the inhibition of mammalian target of rapamycin kinase (mTOR).4,5 To date, regulation of LKB1 is poorly understood; however it is known that LKB1 forms a heterotrimeric complex with STE-20-related pseudokinase (STRAD), and the scaffolding protein MO25, enhancing LKB1 catalytic activity.6,7 When LKB1 catalytic activity is lost due to mutations, the oncogenic mutants drive tumorigenesis through the activation of oncogenes.8
Regulation of cell metabolism is essential for maintaining health, while diet is considerably relevant in protecting cellular metabolism and therefore promoting health. Among the various dietary products that have been implicated in promoting health are the dietary omega-3 and omega-6 polyunsaturated fatty acids (ω3PUFAs/ω6PUFAs). ω3PUFAs have been shown to contribute to the prevention of many cancers, including breast, prostate, and colon cancers;9,10 however, the anti-tumorigenic activity of ω3PUFAs is not fully understood.
The ω6PUFAs are primarily obtained from vegetable oils, such as corn oil, while the ω3PUFAs are obtained primarily from cold-water fish.11-13 Many studies revealed that mice fed a diet rich in ω3PUFAs display reduced risk of developing cancer while mice fed diets rich in ω6PUFAs have the opposite effect.14-16 These studies concluded that the fatty acid composition of a given diet significantly impacts the risk of developing cancer. However, the molecular underpinning of how dietary fatty acids affect carcinogenesis remains controversial. It is well established that the phospholipid composition of the cell membrane and therefore cell fluidity alters the manner in which cells respond to hormones and growth factors through binding to transmembrane receptors.17,18 While others provide evidence that the ω3PUFA-mediated changes made to eicosanoid molecular species leads to the inhibition of cancer progression.19-21 Previously we showed that mice fed various molecular species of ω3PUFA led to alterations in membrane phospholipids, culminating in changes in diacylglycerol (DG) formation22-24 and PKC-mediated activity.25 These data strongly support a role for ω3PUFA in regulating cellular signaling events.
Here we report that the ω3PUFA, docosahexaenoic acid (DHA; 20:6 ω3) enhances LKB1 signaling. We provide evidences that treatment of cells with ω3PUFA decreases cell growth through the inhibition of mTOR in an LKB1-dependent manner. In addition, we show that ω3PUFA treatment diminishes glycolysis by inhibiting the expression of glycolytic enzymes. Interesting, LKB1 expression enhanced glycolysis inhibition and diminishes migratory behavior upon ω3PUFA treatment. Overall our data suggests that the anti-carcinogenic properties of ω3PUFA are mediated in part through the tumor suppressor function of LKB1, leading to inhibition of mTOR activity and cellular metabolism associated with tumorigenesis.
Results
DHA increases LKB1 gene expression and stimulates LKB1 activity
To determine whether ω3PUFA treatment of cells influences LKB1 expression and/or signaling, we performed gene expression analysis and western blotting analysis. HeLaS3 cells were transiently transfected with a LKB1 expression plasmid as previously described.26 Following this, cells were treated for 24 h with the ω6PUFA arachidonic acid (AA; 25 μM), DHA (25 μM), or vehicle (EtOH) control.22 After treatment, mRNA was isolated and prepared for quantitative-PCR (q-PCR). In response to DHA, lkb1 expression was elevated compared with lkb1 expression in response to AA treatment (Fig. 1A). Protein expression of LKB1 was elevated in response to DHA treatment compared with AA and vehicle control as observed by western blot analysis (Fig. 1B). Furthermore, the phosphorylation status of AMPK (pAMPK), a direct target of activated LKB1, was enhanced compared with pAMPK in response to AA and vehicle treatments. Moreover, phosphorylation of ACC, a target of AMPK, was also enhanced (Fig. 1B).
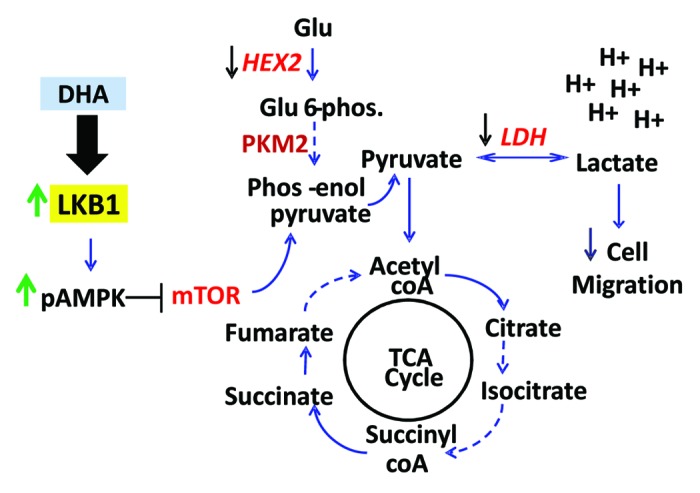
Figure 1. Dietary PUFA enhances LKB1 signaling. (A) q-PCR analysis of LKB1 gene from HeLaS3 expressing ectopic LKB1 followed by treatment with vehicle, AA and DHA at final concentration of 25 μM. Results are the mean ± SEM; n = 4. *P < 0.03. (B) Cells were treated with AA or DHA (25 μM each) followed by western blot analysis for expression of proteins using anti-LKB1 (Ley), -pAMPK, -AMPK, -pACC, and -ACC antibodies. (C) MCF7 cells were treated for 48 h with PUFAs and vehicle followed by western blot analysis of pS6 and eIF4E. (D) MCF7 cells were transfected with siRNA-LKB1, incubated then treated with PUFAs, followed by western blot analysis for expression of proteins using anti-LKB1 and -pS6 antibodies. (E) HeLaS3 cells were transfected with LKB1, D194A, and expression plasmids. Cells were treated with PUFAs (25 μM) for 48 h followed by cap binding assay. Western blot analysis for cap binding proteins was determined using anti-eIF4E, -eIF4G, and -4EBP1 antibodies. Total cell lysates are also shown for LKB1 and eIF4G. Actin was used as loading control. Data are representative of 3 separate experiments.
Inhibition of mTOR by LKB1 in response to PUFAs
Using MCF7 cells, we evaluated the effect of PUFA on mTOR activity. MCF7 cells were treated with AA, DHA and vehicle. Western blot analysis showed that the phosphorylation status of S6 (pS6), a downstream target of mTOR, was decreased in response to DHA-treatment compared with treatment with AA or vehicle control (Fig. 1C). Interesting, expression of eIF4E was also decreased (Fig. 1C). To confirm whether DHA played a role in LKB1-mediated inhibition of mTOR signaling, we selectively knocked down the expression of LKB1 in MCF7 using LKB1 siRNA as previously described.26 After transfection, cells were treated with AA, DHA, and vehicle. The results showed that in the presence of endogenous LKB1, DHA treatment leads to inhibition of S6 phosphorylation; however, when LKB1 expression was attenuated, pS6 expression was similar to that of AA and vehicle control (Fig. 1D).
It is known that the activation of mTOR leads to the phosphorylation of downstream targets, culminating in translation initiation events.27 The recruitment of protein to the mRNA cap and the assembling of the cap-binding complex is the first step in this mechanism. Thus, we analyzed cap recruitment in presence of LKB1 and D194A, an oncogenic LKB1 mutant that lacks catalytic activity.28 In response to DHA treatment, recruitment of eIF4G to the cap was considerably reduced in the presence of LKB1, compared with recruitment in the presence of D194A and vector control (Fig. 1E). Among transfectants, we observed no difference in the recruitment of eIF4G in response to AA or vehicle control (EtOH).
ω3PUFA-mediated alterations in cellular ATP levels is enhanced by LKB1
The Warburg effect provides an explanation for how cancer cells are able to maintain high metabolic rates thereby generating elevated ATP levels that are necessary to provide the elevated energy requirements of a growing cancer.29
In recent years, ω3PUFAs have been observed to inhibit glycolytic genes, having an impact on the metabolic requirements of cancer cells.30,31 Therefore we asked whether DHA alters cell metabolism in the presence of LKB1. To address this question we used two cell lines, MCF-7 and HeLaS3. Briefly, MCF-7 cells were transiently transfected with control (scrambled) and siRNA-LKB1 as previously described26 and HeLaS3 cells were transiently transfected with a LKB1 expression plasmid. Following transfections, cells were treated with PUFA, and ATP assays were performed. In the presence of endogenous LKB1, ATP levels from MCF-7 cells were reduced compared with MCF-7 cells where LKB1 expression was attenuated by siRNA (Fig. 2A). In HeLaS3 cells, ectopic expression of LKB1 resulted in a reduction in ATP levels compared with HeLaS3 cells alone (LKB1null) (Fig. 2B).

Figure 2. DHA treatment contributes to LKB1-mediated depletion of cellular ATP. (A) ATP levels were determined in MCF7 and MCF-7 siRNA-LKB1 cells in response to PUFA treatment. Results are representative of 3 experiments in triplicate, mean ± SEM, *P < 0.001 and **P < 0.05 compare with MCF-7 siRNA LKB1 cells. (B) ATP levels were determined in HeLaS3 cells alone and HeLaS3 cells transfected with a LKB1 expression plasmid. Results are representative of 3 experiments in triplicate, mean ± SEM,*P < 0.001 compare with AA treatments. (C) HeLaS3 cells were transfected with LKB1 and D194A expression plasmids followed by treatment with AA, DHA, and vehicle for 24 h. (D) Expression of HEX2, PKM2, and LDH-A were determined by western blot analysis. Actin was used as loading control.
ω3PUFA treatments lead to decrease in glycolytic enzymes
Aerobic glycolysis consists of a chain of reactions which converts glucose into pyruvate yielding two molecules of ATP. In this process there are a number of enzymes involved in each step, some of which are strongly associated with the metabolic switch that lead to the Warburg effect. The gene expression of these enzymes was shown to be inhibited by ω3PUFA.31 Here we investigated whether LKB1 played a role inhibiting glycolysis and therefore enzymes expression upon ω3PUFA treatments. HeLaS3 cells were transiently transfected with LKB1 and D194A expression plasmids (Fig. 2C), followed by treatment with vehicle, AA (25 µM) and DHA (25 µM) for 24 h. Cells were harvested and protein expression of hexokinase 2 (HEX2), pyruvate kinase (PKM2) and lactate dehydrogenase (LDH-A) was determined by western blot analysis. Expression of HEX2 and LDH-A were decreased in presence of DHA. The expression of LKB1 lead to a decrease in LDH protein levels under all the treatments. We did not observe any effect in PKM2 expression. Treatment with AA did not alter the expression of these proteins (Fig. 2D).
We investigated whether LKB1 catalytic mutants, shown to have oncogenic properties,28 would reverse DHA-mediated inhibition of these glycolytic enzymes. HeLaS3 were transiently transfected with vector, LKB1, kinase dead K78I (KI), and oncogenic mutants of LKB1 found in PJS and breast cancer, namely D194A (DA) and R304W (RW) expression plasmids,26,28 followed by treatment with DHA. In presence of LKB1 catalytic mutants, there was a distinct effect in the expression of these enzymes compared with the expression observed in cells harboring wild-type LKB1 in response to DHA treatment. The expression of HEX2 (Fig. 3A) was significantly enhanced by D194A and K78I mutants (P < 0.01); similarly the expression of LDH-A was significantly increased by K78I mutant, compared with LKB1 expression (P < 0.007) (Fig. 3C). PKM2 expression was not significantly affected by any of the LKB1 mutants (Fig. 3B).
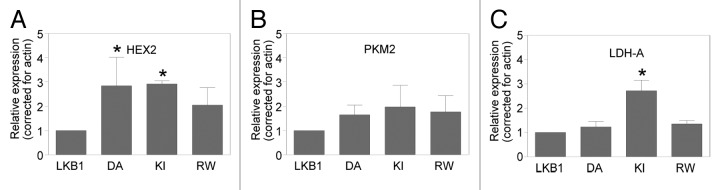
Figure 3. LKB1 activity in response to ω3PUFA treatment alters expression of glycolytic enzymes. (A) HeLaS3 cells were transfected with vector (V), LKB1 (LK), oncogenic mutants D194A (DA), R304W (RW), and catalytic deficient mutant K78I (KI) as previously described,8,48 followed by treatment with DHA. Western blot analysis shows the expression of HEX2 (A), PKM2 (B), and LDH-A (C); actin was used as loading control. Data are representative of three experiments and expressed as relative expression corrected for actin and compared with expression of LKB1, mean ± SD; HEX2 *P < 0.01 and LDH-A, *P < 0.0006.
ω3PUFA treatment decreases glucose metabolism and cell migration
We investigated the effects of DHA treatment in the metabolism of mammary epithelial cells. To gain insights into the effects of DHA in mammary energy metabolism, we use the Seahorse XF Analyzer to measure the cells extracellular acidification rates (ECAR), reflecting glycolysis rates32 and oxygen consumption rates (OCR). Mammary epithelial cells harboring flox-lkb1 alleles were infected with cre-recombinase adeno-virus to excise the lkb1 gene (Fig. 4A). After successfully excision, the cells were treated for 1 h with DHA and control, following ECAR and OCR analysis.

Figure 4. LKB1 signaling promotes inhibition of glycolysis in primary cells. (A) To determine the MOI of adenovirus, primary epithelial cells were infected with AdGFP-Cre for 24, 36, and 48 h to identify appropriate multiplicity of infection (MOI). (B) Extracellular acidification rate (ECAR) using an MOI of 500 was used to infect cells with AdGFP and AdGFP-Cre. Values are representative of 4 experiments in duplicate, mean ± SEM, *P < 0.03. Western blot analysis of -LKB1, pAMPK, AMPK, HEX2, PKM2, and LDH-A expression in cells treated with DHA and infected with AdGFP and AdGFP-Cre. (C) Oxygen consumption rate (OCR) in cells treated with DHA and control. The data are representative of 3 independent experiments.
Overall, we observed that in primary cells expressing LKB1fl/fl (AdGFP) there was a decrease in ECAR compared with cells lacking LKB1−/− (AdGFP-cre) expression (Fig. 4B) in response to DHA. Because this decrease in glycolysis could be related to changes in the expression of glycolytic enzymes, we analyzed the protein levels of HEX2, LDH-A, and PKM2. In cells expressing LKB1fl/fl (AdGFP), the expression of HEX2 and LDH-A was decreased compared with cells lacking LKB1−/− (AdGFP-cre) expression (Fig. 4B). We did not observe any changes in PKM2 expression. Similarly, in HeLaS3 expressing ectopic LKB1, we observed low expression of HEX2 and LDH-A in response to DHA treatment. As in primary cells, we did not observe any changes in PKM2 expression. Therefore the expression of LKB1, in both transfected and primary cells results in an impairment of aerobic glycolysis upon ω3PUFA treatment. In addition, we observed that treatment with DHA led to a modest increase in OCR compared with vehicle (EtOH) treated cells. Further to this, we did not observe differences in OCR between LKB1fl/fl (AdGFP) and LKB1−/− (AdGFP-cre) cells (Fig. 4C). These results suggest that cells lacking LKB1 expression are more inclined to rely on glycolysis as the main source of energy, a mechanism commonly observed in malignant cells transformation.
The acidic environment caused by lactate production and co-secretion of protons leads to destruction of extracellular matrix thereby promoting cell migration and therefore metastasis.33,34 Because of the low glycolytic rate in cells expressing LKB1, we investigated whether LKB1 expression would affect the ability of cells to migrate in response to DHA. Here, primary mammary epithelial cells harvested from LKB1fl/fl mice were infected with AdGFP and AdGFP-Cre, following transwell migration assays. Immunofluorescence was performed simultaneously to confirm expressing of GFP (Fig. 5A). We observed that cells expressing LKB1fl/fl (AdGFP) have reduced migration compared with cells lacking LKB1−/− (AdGFP-cre) expression in response to DHA treatment (Fig. 5B). Based on these results we proposed a model of how the activation of LKB1 signaling in response to DHA treatment lead to inhibition of glycolysis and consequently to a decrease in cell migration (Fig. 6).

Figure 5. LKB1 modulate cell migration in response to ω3PUFA treatment. (A) Mammary epithelial cells infected with AdGFP and AdGFP-Cre, followed by fluorescence staining for actin using Rhodaminephalloidin (red) and for nuclei using 4′,6-diamidino-2-phenylindole (DAPI) (blue). (B) Transwell assays of cell treated with DHA or control. Data shows fold increase of cells migration. Data are representative of 3 experiments in triplicate, mean ± SEM,*P < 0.03.

Figure 6. Proposed model for LKB1 modulation of glycolysis and cell migration. In response to ω3PUFA treatment, LKB1 signaling is activated, leading to the phosphorylation and activation of AMPK. pAMPK, in turn, inhibits mTOR signaling leading to the attenuation of aerobic glycolysis. Activation of LKB1 significantly decreases the expression of HEX2 and LDH-A whereby the conversion of pyruvate to lactate is diminished, thus lowering the release of protons (H+) and restoring pyruvate to the tricarboxylic acid cycle (TCA) cycle. These events reduce the production of ATP through aerobic glycolysis and decrease cell migration. Conversely, the attenuation of LKB1 expression promotes an increase in glycolysis and hyper expression of HEX2 and LDH-A. These enzymes favor the production of lactate which, in turn, increases acidification of the environment and leads to the destruction of extracellular matrix, promoting cell migration.
Discussion
While the benefits of a ω3PUFA diet on cancer are recognized, the mechanism by which these fatty acids are able to suppress tumor growth is poorly understood. Here, we show that DHA enhances the tumor suppressor function of LKB1. LKB1 protein and gene expression levels were elevated by DHA treatment, thereby furthering LKB1-mediated suppression of mTOR signaling. We show that DHA activates LKB1 signaling by promoting AMPK phosphorylation, whereas the more common ω6PUFA, AA does not alter LKB1 activity. The activation of AMPK is implicated in reducing cell proliferation and regulation of cell metabolism;35,36 also AMPK reduces lipid accumulation in peripheral tissues (liver and skeletal muscle) by inhibition of fatty acid synthesis and stimulation of fatty acid oxidation.37 Therefore, a high ω3PUFA diet may regulate the activation of AMPK and play a role in cancer metabolism as well as in other metabolic diseases such as diabetes and cardiovascular disease. Recently, others have shown that ω3PUFA enhances activation of the LKB1-AMPK pathway in rats during partial hepatectomy. This study showed a significant increase in the phosphorylation of AMPK upon ω3PUFA administration.38 Interestingly, another study showed that LKB1 activity was enhanced by DHA and decreased by AA in the brain of rats.39
Unlike most normal cells, tumor cells derive a significant amount of energy from glycolysis rather than through oxidative phosphorylation (known as the Warburg effect).29 Therefore, inhibition of glycolysis can greatly affect tumor growth, since the majority of energy produced by the cancer cells is through glycolysis. We showed that LKB1 tumor suppressor activity is enhanced by ω3PUFA thereby mediating the inhibition of glycolysis and glycolytic enzymes. Recently, the p53 tumor suppressor was shown to suppress glycolysis by controlling the expression of p53-inducible glycolysis and apoptosis regulator (TIGAR), in part through the activation of AMPK.40 The similarity between the two tumor suppressors, LKB1 and p53, is the activation of AMPK in the suppression of glycolysis.
Although aerobic glycolysis is recognized as an inefficient energy process, the Warburg effect is a mechanism by which cancer cells acquire growth advantage over normal cells (see review in ref. 41). Since mTOR is found to enhance transcription of glycolytic enzymes, thereby increasing the capacity of cells to execute glycolysis,42-44 the inhibition of mTOR signaling leads to the suppression of glycolysis. Here we show that in the presence of LKB1, DHA treatment results in a decrease in ATP production and aerobic glycolysis as observed by the inhibition of glycolytic enzymes expression (HEX2 and LDH-A). In addition, we show that the reduction in the expression of rate-limiting glycolytic enzymes was dependent on LKB1 catalytic activity since the expression of HEX2 and LDH-A was enhanced in the presence of LKB1 oncogenic mutants. Interestingly, others have shown that activation of AMPK suppresses the Warburg effect and inhibits tumor growth in vivo. This study also showed that cells lacking AMPK had elevated ATP levels,36 supporting our discovery that LKB1 activation of AMPK signaling plays a vital role in cell metabolism, driving the Warburg effect.
We found that mammary epithelial cells expressing LKB1 displayed decreased glycolysis as measured by ECAR. Expression of LKB1 in these cells also contributed to reduced protein expression of HEX2 and LDH-A. These effects were influenced by DHA treatment, implying that dietary intake of ω3PUFA could attenuate excessive aerobic glycolysis. Functionally, cell migration is highly influenced by glucose metabolism. In the past decade, many studies have shown that an increase in glucose metabolism promotes cell migration by increasing lactate levels.33,34,45 Consequently, elevated lactate leads to cellular acidification which then promotes the destruction of the extra cellular matrix and predispose cells to migration.33,34,45 In our study we show that cells expressing LKB1 migrate significantly less than cells that do not express LKB1 when treated with DHA.
Recently, we showed that primary mammary epithelial cells that lack LKB1 expression in combination with gain of ErbB2 expression showed an aggressive tumor development with abnormal metabolism caused by the Warburg effect.46 In our current study, we showed for the first time that LKB1 tumor suppressor function is enhanced in response to DHA treatment, resulting in the inhibition of mTOR signaling. In the presence of LKB1, the suppression of cellular ATP levels and reduced expression of glycolytic enzymes was enhanced in response to DHA treatment, thus confirming the importance of diet in the regulation of cellular metabolism. This discovery is an example of how ω3PUFA can affect signaling pathways to control elevated glycolysis in cancer cells and decrease glucose metabolic rates. Hence, the effects of DHA on LKB1 signaling would benefit patients with metabolically active tumors. Recent efforts to develop anti-tumorigenic strategies that target the glycolytic process have yet to prove successful. Therefore the enhanced tumor suppressor activity of LKB1 associated with DHA treatment may represents an effective strategy in conjunction with traditional therapeutics to suppress tumor growth.
Material and Methods
Cell culture and transfection
MCF7 and HeLaS3 (American Type Culture Collection) were maintained in DMEM supplemented with 8% fetal bovine serum (Invitrogen). Cells were transfected with expression plasmids, as indicated, using PEI (Polysciences, Inc.). Cell cultures were maintained at 37 °C in a humidified atmosphere of 5% CO2.
Cell lysis and western blot analysis
Cells were harvested and lysed as described previously.47 Protein concentration was determined by Bradford analysis. Proteins were resolved by SDS-PAGE then transferred to Immobilon-P membrane (Millipore). Membranes were initially blocked in fatty acid free skim milk (1%)/TBS or BSA/TBS. The following antibodies were used: anti-eIF4G, -phosphoribosomal protein S6 (S235/236), -ACC, -pACC (S79), -pAMPK (T172), -AMPK, glycolytic proteins -LDH-A, -Hex2, -PKM2, and -PDH (all from Cell Signaling), anti-LKB1 (Ley 37D), and actin (Santa Cruz Biotechnologies). Membranes were prepared for chemiluminescence (ECL) as previously described.28
Cap-binding assay
Cells lysates (500 μg) were incubated with the m7-GTP-Sepharose 4B at 4 °C for 1.5 h. Following incubation, the complex was washed 3 times and prepared for western blot analysis as described above, cap-binding affinity was accessed. Membranes were blotted for recruitment of eIF4E and eIF4G to the cap affinity resin using anti-eIF4E and -eIF4G antibodies.
ATP bioluminescent assay
MCF7 and HeLaS3 cells were seeded in 12-well plates followed by treatment with PUFA in DMEM/1%FBS. After 48 h cells were harvested and lysed in 100 μL lysis passive buffer (Promega). Protein concentrations were measured using Bradford analysis (BioRad) and 2 μg of protein was used to determined cellular ATP level. The ATP Bioluminescent Kit (Sigma) was used according to the manufacturer’s protocol to measure cellular ATP concentrations on a Berthold multi-chain luminometer.
Metabolic assays
Extracellular acidification rate (ECAR) and oxygen consumption rate (OCR) were measured using XF analyzer (Seahorse Bioscience). Cells were plated at 5 × 10³/well in Dulbecco modified Eagle’s medium (DMEM) and treated with DHA and EtOH for 1 h in serum free DMEM. Following this, medium was changed to non-buffered DMEM containing 25 mM glucose and 1 mM pyruvate and cells were incubated for 1 h in a CO2-free incubator prior loading into the XF24 analyzer. During the assay glucose (10 mM), oligomycin (0.2 µM), and 2-deoxyglucose (10 mM) were added sequentially.
Migration assay
Cells were either mock-infected with control virus (AdGFP) or infected with AdGFP-Cre (AdGFP-Cre) recombinase (Vector Biolabs) for 48 h after which cells were trypsinized, then plated into the upper chambers of transwell migration plates (BD BioCoat; 8 μm pore diameter; 6.4 mm polyethylene terephthalate membrane diameter). Cells were allowed to adhere to the surface of the upper chamber insert (24 h). FBS media (8%) was added (1 mL) to the lower chamber to serve as a chemoattractant. Cells were either treated with ethanol control or DHA (25 μM). Plates were returned to the incubator to allow migration for up to 8 h. Non-migrated cells were swabbed off using flat-ended cotton swabs. Migrated cells were fixed and permeabilized with methanol (15 min), stained with crystal violet solution (15 min), and washed three times with Milli-Q water (2 min per wash). Stained inserts were mounted onto Superfrost Plus glass slides with Zeiss immersion oil (ImmersolTM). Images of inserts were acquired using a microscope (Nikon Eclipse TE2000-E) mounted with a camera (RetigaEX 7099) coupled to the SimplePCI imaging program as previously described.26 Cells were photographed under 2× and 10× objective magnifications. Counts were averaged and reported as average cells per field. Graphical analysis and statistics was completed using Graph Pad Prism software.
Fatty acids
Arachidonic acid (20:4, ω6) and docosahexaenoic acid (22:6, ω3) were purchased from Enzo Life Sciences. Stock solutions of fatty acids were prepared in ethanol and stored at −80 °C under a blanket of N2 as previously described.22,23
Statistics
Experiments were conducted in triplicate, and reported as mean ± SEM and mean ± SD. The statistical analysis was performed by repeated measures one-way ANOVA, followed by Newman–Keuls multiple comparison test and two-way ANOVA. Values were statistically significant at P < 0.05. The statistical analyses were performed using GraphPad Prism software 5 (GraphPad software) and as previously described.22
Authors’ Contributions
RA contributed to the design of the experiments, acquisition of data, analysis and interpretation of data, and drafted the manuscript. JH contributed to the cell migration assays. PAM contributed to the design of the experiments, analysis and interpretation of data, and editing of the manuscript. All authors read and approved the final manuscript.
Acknowledgments
We thank members of the Marignani Lab for technical support and Drs Jason Berman and Neale Ridgeway for helpful discussion. This work was supported by The Beatrice Hunter Cancer Research Institute, and the Nova Scotia Health Research Foundation. RA is supported by SHRTP-CIHR Cancer Research Training Program. JH is supported by Norah Stephen Oncology Scholarship.
Glossary
Abbreviations:
- AA
arachidonic acid
- ACC
acetyl CoA carboxylase
- AMPK
adenosine monophosphate (AMP)-activated protein kinase
- ATP
adenosine triphosphate
- DHA
docosahexaenoic acid
- ECAR
extracellular acidification rates
- HEX2
hexokinase 2
- mTOR
mammalian target of rapamycin
- PKM2
pyruvate kinase 2
- pS6
phosphorylated ribosomal kinase
- LDH-A
lactate dehydrogenase
- OCR
oxygen consumption rates
- ω3PUFAs/ ω6PUFAs
omega-3/omega-6 polyunsaturated fatty acids
Disclosure of Potential Conflicts of Interest
The authors declare no competing interests.
Footnotes
Previously published online: www.landesbioscience.com/journals/cbt/article/26206
References
- 1.Yecies JL, Manning BD. mTOR links oncogenic signaling to tumor cell metabolism. J Mol Med (Berl) 2011;89:221–8. doi: 10.1007/s00109-011-0726-6. [DOI] [PubMed] [Google Scholar]
- 2.Laplante M, Sabatini DM. mTOR signaling in growth control and disease. Cell. 2012;149:274–93. doi: 10.1016/j.cell.2012.03.017. [DOI] [PMC free article] [PubMed] [Google Scholar]
- 3.Marignani P, Sanchez-Cespedes M. The tumour suppressor role of LKB1 in human cancer. In: Lazo PA, ed. Emerging Signalling Pathways in Tumor Biology: Transworld Research Network., 2010:71-94. [Google Scholar]
- 4.Lizcano JM, Göransson O, Toth R, Deak M, Morrice NA, Boudeau J, Hawley SA, Udd L, Mäkelä TP, Hardie DG, et al. LKB1 is a master kinase that activates 13 kinases of the AMPK subfamily, including MARK/PAR-1. EMBO J. 2004;23:833–43. doi: 10.1038/sj.emboj.7600110. [DOI] [PMC free article] [PubMed] [Google Scholar]
- 5.Shaw RJ, Bardeesy N, Manning BD, Lopez L, Kosmatka M, DePinho RA, Cantley LC. The LKB1 tumor suppressor negatively regulates mTOR signaling. Cancer Cell. 2004;6:91–9. doi: 10.1016/j.ccr.2004.06.007. [DOI] [PubMed] [Google Scholar]
- 6.Baas AF, Boudeau J, Sapkota GP, Smit L, Medema R, Morrice NA, Alessi DR, Clevers HC. Activation of the tumour suppressor kinase LKB1 by the STE20-like pseudokinase STRAD. EMBO J. 2003;22:3062–72. doi: 10.1093/emboj/cdg292. [DOI] [PMC free article] [PubMed] [Google Scholar]
- 7.Boudeau J, Baas AF, Deak M, Morrice NA, Kieloch A, Schutkowski M, Prescott AR, Clevers HC, Alessi DR. MO25alpha/beta interact with STRADalpha/beta enhancing their ability to bind, activate and localize LKB1 in the cytoplasm. EMBO J. 2003;22:5102–14. doi: 10.1093/emboj/cdg490. [DOI] [PMC free article] [PubMed] [Google Scholar]
- 8.Scott KD, Nath-Sain S, Agnew MD, Marignani PA. LKB1 catalytically deficient mutants enhance cyclin D1 expression. Cancer Res. 2007;67:5622–7. doi: 10.1158/0008-5472.CAN-07-0762. [DOI] [PubMed] [Google Scholar]
- 9.Friedrichs W, Ruparel SB, Marciniak RA, deGraffenried L. Omega-3 fatty acid inhibition of prostate cancer progression to hormone independence is associated with suppression of mTOR signaling and androgen receptor expression. Nutr Cancer. 2011;63:771–7. doi: 10.1080/01635581.2011.570892. [DOI] [PubMed] [Google Scholar]
- 10.Menendez JA, Lupu R, Colomer R. Exogenous supplementation with omega-3 polyunsaturated fatty acid docosahexaenoic acid (DHA; 22:6n-3) synergistically enhances taxane cytotoxicity and downregulates Her-2/neu (c-erbB-2) oncogene expression in human breast cancer cells. Eur J Cancer Prev. 2005;14:263–70. doi: 10.1097/00008469-200506000-00011. [DOI] [PubMed] [Google Scholar]
- 11.Hubbard NE, Chapkin RS, Erickson KL. Effect of dietary linseed oil on tumoricidal activity and eicosanoid production in murine macrophages. Lipids. 1994;29:651–5. doi: 10.1007/BF02536100. [DOI] [PubMed] [Google Scholar]
- 12.Lands WFM. Fish and human health: a story unfolded. World Aquacult. 1986;20:59–62. [Google Scholar]
- 13.Magrum LJ, Johnston PV. Effect of dietarily provided linoleic and linolenic acid on the function of rat peritoneal macrophages. Nutr Res. 1986;6:287–93. doi: 10.1016/S0271-5317(86)80132-4. [DOI] [Google Scholar]
- 14.Rose DP, Connolly JM. Effects of fatty acids and inhibitors of eicosanoid synthesis on the growth of a human breast cancer cell line in culture. Cancer Res. 1990;50:7139–44. [PubMed] [Google Scholar]
- 15.Bartsch H, Nair J, Owen RW. Dietary polyunsaturated fatty acids and cancers of the breast and colorectum: emerging evidence for their role as risk modifiers. Carcinogenesis. 1999;20:2209–18. doi: 10.1093/carcin/20.12.2209. [DOI] [PubMed] [Google Scholar]
- 16.Rose DP, Connolly JM. Dietary fat and breast cancer metastasis by human tumor xenografts. Breast Cancer Res Treat. 1997;46:225–37. doi: 10.1023/A:1005971317978. [DOI] [PubMed] [Google Scholar]
- 17.Galli C, Marangoni F, Galella G. Modulation of lipid derived mediators by polyunsaturated fatty acids. Prostaglandins Leukot Essent Fatty Acids. 1993;48:51–5. doi: 10.1016/0952-3278(93)90009-L. [DOI] [PubMed] [Google Scholar]
- 18.Raclot T, Groscolas R. Individual fish-oil n-3 polyunsaturated fatty acid deposition and mobilization rates for adipose tissue of rats in a nutritional steady state. Am J Clin Nutr. 1994;60:72–8. doi: 10.1093/ajcn/60.1.72. [DOI] [PubMed] [Google Scholar]
- 19.Zhu BT, Conney AH. Functional role of estrogen metabolism in target cells: review and perspectives. Carcinogenesis. 1998;19:1–27. doi: 10.1093/carcin/19.1.1. [DOI] [PubMed] [Google Scholar]
- 20.Singh J, Hamid R, Reddy BS. Dietary fat and colon cancer: modulation of cyclooxygenase-2 by types and amount of dietary fat during the postinitiation stage of colon carcinogenesis. Cancer Res. 1997;57:3465–70. [PubMed] [Google Scholar]
- 21.Sebaldt RJ, Sheller JR, Oates JA, Roberts LJ, 2nd, FitzGerald GA. Inhibition of eicosanoid biosynthesis by glucocorticoids in humans. Proc Natl Acad Sci U S A. 1990;87:6974–8. doi: 10.1073/pnas.87.18.6974. [DOI] [PMC free article] [PubMed] [Google Scholar]
- 22.Marignani PA, Sebaldt RJ. Formation of second messenger diradylglycerol in murine peritoneal macrophages is altered after in vivo (n-3) polyunsaturated fatty acid supplementation. J Nutr. 1995;125:3030–40. doi: 10.1093/jn/125.12.3030. [DOI] [PubMed] [Google Scholar]
- 23.Marignani PA, Sebaldt RJ. The formation of diradylglycerol molecular species in murine peritoneal macrophages varies dose-dependently with dietary purified eicosapentaenoic and docosahexaenoic ethyl esters. J Nutr. 1996;126:2738–45. doi: 10.1093/jn/126.11.2738. [DOI] [PubMed] [Google Scholar]
- 24.Marignani PA, Sebaldt RJ. n-3 polyunsaturated fatty acid-induced changes in the molecular species composition of diradylglycerol in murine peritoneal macrophages remain stable during incubation ex vivo. Lipids. 1996;31:771–6. doi: 10.1007/BF02522894. [DOI] [PubMed] [Google Scholar]
- 25.Marignani PA, Epand RM, Sebaldt RJ. Acyl chain dependence of diacylglycerol activation of protein kinase C activity in vitro. Biochem Biophys Res Commun. 1996;225:469–73. doi: 10.1006/bbrc.1996.1196. [DOI] [PubMed] [Google Scholar]
- 26.Nath-Sain S, Marignani P. LKB1 catalytic activity contributes to estrogen receptor alpha signaling. Mol Biol Cell. 2009;20:2785–95. doi: 10.1091/mbc.E08-11-1138. [DOI] [PMC free article] [PubMed] [Google Scholar]
- 27.Fingar DC, Richardson CJ, Tee AR, Cheatham L, Tsou C, Blenis J. mTOR controls cell cycle progression through its cell growth effectors S6K1 and 4E-BP1/eukaryotic translation initiation factor 4E. Mol Cell Biol. 2004;24:200–16. doi: 10.1128/MCB.24.1.200-216.2004. [DOI] [PMC free article] [PubMed] [Google Scholar]
- 28.Scott KD, Nath-Sain S, Agnew MD, Marignani PA. LKB1 catalytically deficient mutants enhance cyclin D1 expression. Cancer Res. 2007;67:5622–7. doi: 10.1158/0008-5472.CAN-07-0762. [DOI] [PubMed] [Google Scholar]
- 29.Warburg O. On the origin of cancer cells. Science. 1956;123:309–14. doi: 10.1126/science.123.3191.309. [DOI] [PubMed] [Google Scholar]
- 30.Jump DB, Clarke SD, Thelen A, Liimatta M. Coordinate regulation of glycolytic and lipogenic gene expression by polyunsaturated fatty acids. J Lipid Res. 1994;35:1076–84. [PubMed] [Google Scholar]
- 31.Dentin R, Benhamed F, Pégorier J-P, Foufelle F, Viollet B, Vaulont S, Girard J, Postic C. Polyunsaturated fatty acids suppress glycolytic and lipogenic genes through the inhibition of ChREBP nuclear protein translocation. J Clin Invest. 2005;115:2843–54. doi: 10.1172/JCI25256. [DOI] [PMC free article] [PubMed] [Google Scholar]
- 32.Wu M, Neilson A, Swift AL, Moran R, Tamagnine J, Parslow D, Armistead S, Lemire K, Orrell J, Teich J, et al. Multiparameter metabolic analysis reveals a close link between attenuated mitochondrial bioenergetic function and enhanced glycolysis dependency in human tumor cells. Am J Physiol Cell Physiol. 2007;292:C125–36. doi: 10.1152/ajpcell.00247.2006. [DOI] [PubMed] [Google Scholar]
- 33.Langbein S, Zerilli M, Zur Hausen A, Staiger W, Rensch-Boschert K, Lukan N, Popa J, Ternullo MP, Steidler A, Weiss C, et al. Expression of transketolase TKTL1 predicts colon and urothelial cancer patient survival: Warburg effect reinterpreted. Br J Cancer. 2006;94:578–85. doi: 10.1038/sj.bjc.6602962. [DOI] [PMC free article] [PubMed] [Google Scholar]
- 34.Masur K, Vetter C, Hinz A, Tomas N, Henrich H, Niggemann B, Zänker KS. Diabetogenic glucose and insulin concentrations modulate transcriptome and protein levels involved in tumour cell migration, adhesion and proliferation. Br J Cancer. 2011;104:345–52. doi: 10.1038/sj.bjc.6606050. [DOI] [PMC free article] [PubMed] [Google Scholar]
- 35.Carretero J, Medina PP, Blanco R, Smit L, Tang M, Roncador G, Maestre L, Conde E, Lopez-Rios F, Clevers HC, et al. Dysfunctional AMPK activity, signalling through mTOR and survival in response to energetic stress in LKB1-deficient lung cancer. Oncogene. 2007;26:1616–25. doi: 10.1038/sj.onc.1209951. [DOI] [PubMed] [Google Scholar]
- 36.Faubert B, Boily G, Izreig S, Griss T, Samborska B, Dong Z, Dupuy F, Chambers C, Fuerth BJ, Viollet B, et al. AMPK is a negative regulator of the Warburg effect and suppresses tumor growth in vivo. Cell Metab. 2013;17:113–24. doi: 10.1016/j.cmet.2012.12.001. [DOI] [PMC free article] [PubMed] [Google Scholar]
- 37.Zhang BB, Zhou G, Li C. AMPK: an emerging drug target for diabetes and the metabolic syndrome. Cell Metab. 2009;9:407–16. doi: 10.1016/j.cmet.2009.03.012. [DOI] [PubMed] [Google Scholar]
- 38.Yan XP, Wang S, Yang Y, Qiu YD. Effects of n-3 polyunsaturated fatty acids on rat livers after partial hepatectomy via LKB1-AMPK signaling pathway. Transplant Proc. 2011;43:3604–12. doi: 10.1016/j.transproceed.2011.10.045. [DOI] [PubMed] [Google Scholar]
- 39.Agrawal R, Gomez-Pinilla F. ‘Metabolic syndrome’ in the brain: deficiency in omega-3 fatty acid exacerbates dysfunctions in insulin receptor signalling and cognition. J Physiol. 2012;590:2485–99. doi: 10.1113/jphysiol.2012.230078. [DOI] [PMC free article] [PubMed] [Google Scholar]
- 40.Bensaad K, Tsuruta A, Selak MA, Vidal MNC, Nakano K, Bartrons R, Gottlieb E, Vousden KH. TIGAR, a p53-inducible regulator of glycolysis and apoptosis. Cell. 2006;126:107–20. doi: 10.1016/j.cell.2006.05.036. [DOI] [PubMed] [Google Scholar]
- 41.Gatenby RA, Gillies RJ. Why do cancers have high aerobic glycolysis? Nat Rev Cancer. 2004;4:891–9. doi: 10.1038/nrc1478. [DOI] [PubMed] [Google Scholar]
- 42.Cairns RA, Harris IS, Mak TW. Regulation of cancer cell metabolism. Nat Rev Cancer. 2011;11:85–95. doi: 10.1038/nrc2981. [DOI] [PubMed] [Google Scholar]
- 43.Laplante M, Sabatini DM. An emerging role of mTOR in lipid biosynthesis. Curr Biol. 2009;19:R1046–52. doi: 10.1016/j.cub.2009.09.058. [DOI] [PMC free article] [PubMed] [Google Scholar]
- 44.Sun Q, Chen X, Ma J, Peng H, Wang F, Zha X, Wang Y, Jing Y, Yang H, Chen R, et al. Mammalian target of rapamycin up-regulation of pyruvate kinase isoenzyme type M2 is critical for aerobic glycolysis and tumor growth. Proc Natl Acad Sci U S A. 2011;108:4129–34. doi: 10.1073/pnas.1014769108. [DOI] [PMC free article] [PubMed] [Google Scholar]
- 45.Walenta S, Wetterling M, Lehrke M, Schwickert G, Sundfør K, Rofstad EK, Mueller-Klieser W. High lactate levels predict likelihood of metastases, tumor recurrence, and restricted patient survival in human cervical cancers. Cancer Res. 2000;60:916–21. [PubMed] [Google Scholar]
- 46.Andrade-Vieira R, Xu Z, Colp P, Marignani PA. Loss of LKB1 expression reduces the latency of ErbB2-mediated mammary gland tumorigenesis, promoting changes in metabolic pathways. PLoS One. 2013;8:e56567. doi: 10.1371/journal.pone.0056567. [DOI] [PMC free article] [PubMed] [Google Scholar]
- 47.Marignani PA, Kanai F, Carpenter CL. LKB1 associates with Brg1 and is necessary for Brg1-induced growth arrest. J Biol Chem. 2001;276:32415–8. doi: 10.1074/jbc.C100207200. [DOI] [PubMed] [Google Scholar]
- 48.Marignani PA, Scott KD, Bagnulo R, Cannone D, Ferrari E, Stella A, Guanti G, Simone C, Resta N. Novel splice isoforms of STRADalpha differentially affect LKB1 activity, complex assembly and subcellular localization. Cancer Biol Ther. 2007;6:1627–31. doi: 10.4161/cbt.6.10.4787. [DOI] [PubMed] [Google Scholar]