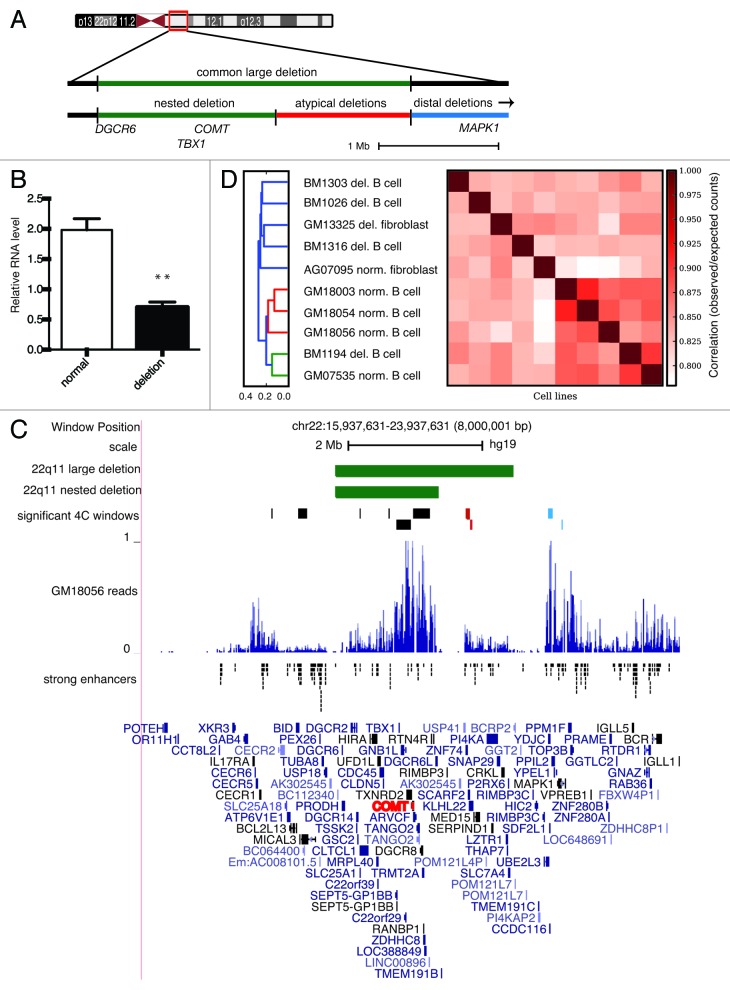
Figure 1. (A) Diagram of deletions on chromosome 22q11.2. The common large deletion (green) encompasses the shorter nested deletion (green) and the region of atypical deletions (red). The region containing distal deletions is highlighted green. Locations of DGCR6, COMT, TBX1 and MAPK1 are shown. (B) COMT expression in 4 normal and 4 deletion B lymphocyte cell lines. **, P < 0.01. (C) 4C-seq local interaction profiles observed in 4 normal B lymphocyte cell lines. The bait locus COMT (red) is located in both the large typically deleted region and the shorter nested deletion (green bars). Normalized cis reads in the normal B cell line GM18056. Image generated from UCSC genome browser GRCh37/hg19. Significant regions displayed underneath deletions were obtained using a sliding window of 20 restriction sites and a z-score cutoff of 3. Red bars indicate interactions in the region comprising atypical deletions and blue bars indicate interactions in the distal deletion region. Locations of the predicted B lymphocyte, strong enhancers were extracted from the Broad chromatin state segmentation track.26 (D) Hierarchical clustering by cis interactions profiles. Each square represents a pairwise comparison of the similarity between each cell line using Pearson correlation between the vectors of intrachromosomal z scores assigned using a sliding window of 20 restriction sites.

An official website of the United States government
Here's how you know
Official websites use .gov
A
.gov website belongs to an official
government organization in the United States.
Secure .gov websites use HTTPS
A lock (
) or https:// means you've safely
connected to the .gov website. Share sensitive
information only on official, secure websites.
