

Abstract
Inflammation and fibrosis are essential elements of diabetic nephropathy (DN). We tested the hypothesis that these elements are dependent upon Toll-like receptor 2 (TLR2) signalling by examining WT and TLR2-/- mice in an experimental model of DN. Diabetes was induced in WT and TLR2-/- mice by i.p. injection of streptozotocin. Kidney injury was assessed at 6, 12 and 24 weeks after induction of diabetes. Gene expression of TLR2, its endogenous ligands and downstream cytokines, chemokines and fibrogenic molecules were upregulated in kidneys from WT mice with streptozotocin diabetes. TLR2-/- mice were protected against the development of DN, exhibiting less albuminuria, inflammation, glomerular hypertrophy and hypercellularity, podocyte and tubular injury as compared to diabetic WT controls. Marked reductions in interstitial collagen deposition, myofibroblast activation (α-SMA) and expression of fibrogenic genes (TGF-β and fibronectin) were also evident in TLR2 deficient mice. Consistent with our in vivo results, high glucose directly promoted TLR2 activation in podocytes and tubular epithelial cells (TECs) in vitro, resulting in NF-κB activation, inflammation and TGF-β production. We conclude that TLR2 was required for the full development of inflammation, kidney damage and fibrosis in this model of DN. As TLR2 is known to be expressed by intrinsic kidney cells and as high concentration glucose stimulated podocytes and TECs in vitro to express TLR2 and TLR2 ligands, pro-inflammatory and pro-fibrotic cytokines in a TLR2 dependent manner in the present study, it appears likely that TLR2 signalling in intrinsic kidney cells contributes to the pathogenesis of diabetic nephropathy.
Keywords: Diabetic nephropathy, Toll like receptor 2, podocytes, fibrosis
Introduction
Diabetic nephropathy is a progressive disease which affects 25% to 40% of people with type 2 diabetes [1]. Given the global prevalence of type 2 diabetes, it is not surprising that diabetic nephropathy is the most common cause of both chronic kidney disease and end-stage kidney disease in the world [2]. Despite reasonable uptake of current management strategies for diabetic nephropathy including use of agents to block the renin-angiotensin axis, the prevalence and burden of diabetic nephropathy in the USA continues to increase [3]. Dissection of the pathogenesis to enable discovery of new, more effective therapies is urgently required.
Diabetic nephropathy is structurally characterised by changes within the glomerulus including podocyte injury and loss, basement membrane thickening, loss of endothelial cell fenestration and mesangial cell hypertrophy, coupled with tubulointerstitial changes of myofibroblast accumulation and fibrosis [4]. Clinically, albuminuria and progressive loss of GFR reflect these changes.
The role of inflammation in DN is increasingly recognised. Human and experimental studies suggest inflammation, both systemically and within the kidney, are characteristic of the diabetic state and harbingers of nephropathy. Resident kidney cells and infiltrating monocytes secrete proinflammatory cytokines, chemokines and growth factors [5] in response to hyperglycaemia [6]. Understanding how hyperglycaemia triggers inflammation in this context may enable strategies to prevent or delay progression of DN.
TLRs are germline-encoded innate immune receptors that are utilized by the host immune system to detect the presence of invading pathogens [7-10]. TLRs recognise specific molecular patterns that are present on invading microorganisms. They also recognise endogenous ligands expressed by or released from damaged cells or disrupted extracellular matrix and thereby mediate “sterile inflammation” [11,12]. These ligands include heat-shock proteins (HSPs), high-mobility group box 1 (HMGB1), fibronectin, biglycan, hyaluronic acid and heparan sulphate, which all bind to TLR2 and 4 [13-15]. Upon activation TLRs (except TLR3) signal via MyD88 leading to translocation of NF-κB and the activation of mitogen activated protein kinases (MAPKs) with consequent up-regulation of pro-inflammatory cytokines, chemokines and co-stimulatory molecules, in turn initiating inflammation [16-18]. TLRs are expressed by a variety of immune cell types, such as macrophages, dendritic cells, T and B cells and NK cells, and also by a number of non-immune cells, including kidney tubular epithelial cells, endothelial, podocytes and mesangial cells [19,20].
Experimental studies have provided compelling evidence that TLRs are actively involved in the development of kidney diseases in a sterile environment. TLR4 and/or 2 are required for the development of kidney damage in response to ischaemia-reperfusion injury [21], cisplatin induced nephrotoxicity [22], transplant rejection [23] and crescentic glomerulonephritis [24,25]. In animal models of Streptozocin (STZ)-induced diabetes, both TLR2 and TLR4 expression are increased co-incident with activation of their downstream pathways [26-28]. In human studies, TLR2 and TLR4 expression and activity were found to be significantly greater in diabetic patients with microvascular complications, suggesting that TLR-signalling could be involved in the pathogenesis of nephropathy [29]. Endotoxin activity, a known activator of TLR4, was predictive of progression to diabetic nephropathy in a Finnish study of patients with type 1 diabetes [30]. Studies in experimental models of diabetic nephropathy have recently demonstrated that TLR4 promotes tubulointerstitial inflammation in DN [6] and that TLR2 deficiency protected against renal injury with reductions in albuminuria, podocyte injury, macrophage infiltration and production of inflammatory mediators [27]. Given the potential importance of TLR signalling in DN, we sought to determine how TLR2 signalling is activated in experimental DN and whether the pathway is required for the development of fibrosis.
Materials and methods
Experimental animals
Wild-type (WT) Balb/c mice were obtained from the Animal Resource Centre (Perth, Australia). TLR2-deficient mice on a Balb/c background were provided by the Animal Service of Australian National University with permission from Professor S Akira (Osaka University, Osaka, Japan). The mice were housed in a specific pathogen-free facility in the University of Sydney. Male mice aged 7-8 weeks were used in all experiments. All animal experiments were performed with the approval of the animal ethics committee of the University of Sydney.
Induction of diabetes
Male WT and TLR2-/- mice were fasted for 4 hours then injected i.p. with 55 mg/kg STZ (Sigma-Aldrich, St. Louis, MO) or vehicle for 5 consecutive days. Mice with a blood glucose level above 16 mmol/L were considered to be diabetic. Animals were sacrificed at week 6 (WT n=12; TLR2-/- n=9), week 12 (WT n=10; TLR2-/- n=8) and week 24 (WT n=12; TLR2-/- n=8) after STZ injection. The control mice were 5 per group.
Sample harves
Urine was collected over 16 hours on the day prior to sacrifice. Blood and kidney tissues were harvested at sacrifice. Tissue slices were fixed with 10% neutral-buffered formalin for paraffin embedding, frozen in OCT compound (Sakura Finetek Inc., Torrance, CA) and snap frozen in liquid nitrogen for mRNA extraction.
Quantification of albuminuria and urine creatinine
Urine albumin was quantified using the Mouse Albumin ELISA Quantitation Set according to the manufacturer’s instructions (Bethyl Laboratories, Montgomery, TX, USA). Briefly, plates (BD Biosciences) were coated with a goat anti-mouse albumin antibody, then rinsed and blocked with assay diluent. Diluted urine samples were applied in triplicate to the plate, along with a reference serum albumin standard dilution series, and incubated for 1 hour. The plate was rinsed and incubated with HRP-conjugated mouse albumin antibody for 1 hour. Once washed, the plate was incubated with substrate solution for 10 min and then with stop solution. Urine albumin concentration was analysed by microplate reader software (BMG Labtech). Urine creatinine was measured enzymatically by the Biochemistry Department of Royal Prince Alfred Hospital, Sydney, Australia.
Real-time RT-PCR
Total RNA was extracted from frozen kidney tissues and cells using TRIzol (Invitrogen). cDNA was synthesized using oligo(dT)16 (Applied Biosystems, Foster City, CA) and the SuperScript III reverse transcriptase kit (Invitrogen) according to the manufacturer’s instructions. cDNA was amplified in Universal Master Mix (Applied Biosystems) with gene-specific primers and probes, using the Rotor-Gene 6000 (Corbett Life Science). Specific TaqMan primers and probes for IL-6, TGFβ, CCL2, CXCL10 and glyceraldehyde-3-phosphate dehydrogenase (GAP-DH) were previously described [21]. Specific Taqman primers and probes for TGF-β1 (Mm01178820_m1), fibronectin (Mm01328-142_m1) and KIM-1 (Mm00506686_m1) were obtained from Applied Biosystems. All of the results are expressed as ratio to GAPDH.
Histology
Periodic acid-Schiff’s (PAS) and Picrosirius red (PSR) staining were performed on 3 μm formalin-fixed kidney sections. Glomerular tuft area (AG) was measured by microscopy using DP2-BSW software V2.2, OLYMPUS. Mean glomerular volume (VG) was calculated using the formula described by Nagata et al. [31]; VG=(β/k) × (AG)3/2, where k=1.1 (size distribution coefficient) and β=1.38 (shape coefficient for sp-heres). Total glomerular cellularity was determined by tallying nuclei in hilar glomerular cross-section using Image J. Interstitial collagen on PSR-stained sections was assessed by point counting using an ocular grid as described by Mc-Whinnie et al [32] in at least 20 consecutive fields (× 400 magnification). Only interstitial collagen was counted, and vessels and glomeruli were excluded. The result was expressed as percentage of the interstitial area with positive staining.
Immunohistochemistry
Staining for CD68 was performed on acetone-fixed frozen sections (7 μm) and endogenous biotin was blocked using a biotin blocker system (DAKO, Carpinteria, CA). Sections were then incubated with 10% normal horse serum followed by 60-minute incubation with primary antibody; a rat anti-mouse CD68 antibody (ABD Serotec Inc., Oxford, UK), or concentration-mat-ched IgG as an isotype negative control. The sections were exposed to H2O2 for 5 min and then incubated with biotinylated anti-rat IgG (BD Biosciences, Pharmingen) or anti-rabbit IgG (BD Biosciences, Pharmingen) or anti-goat IgG (Vector Laboratories Inc.). A Vector stain ABC kit (Vector Laboratories Inc.) was applied to the tissue followed by DAB solution (DAKO). The slides were counterstained with Harris’ hematoxylin. Immunostaining for α-SMA was performed on formalin-fixed paraffin sections using Dako ARK™, Peroxidase for Mouse Primary Antibodies (DAKO) according to the manufacturer’s instructions. Briefly, tissue sections were deparaffinised and rehydrated. Endogenous peroxidise was quenched using Peroxidase Block. Mouse anti-α-SMA antibody (Sigma-Aldrich, St. Louis, MO) was incubated with biotinylated anti-mouse IgG Fab for 15 min and then applied to the tissue sections. Tissue sections were then incubated for 15 min with streptavidin-peroxidase followed by standard DAB procedure.
Immunofluorescence
Podocin staining was performed on 7 μm acetone-fixed frozen sections. After blocking with 10% normal horse serum, sections were incubated with a rabbit anti-NPHS2 antibody (Abcam.) at 4°C overnight. For detection, sections were incubated with an Alexa Fluor® 488-conjugated anti-rabbit antibody for 1 hour. Sections were then mounted in ProLong® Gold antifade reagent (Invitrogen).
Quantification of immunostaining
α-SMA immunostaining was assessed using ImageJ in the periglomerular area (between Bowman’s capsule and surrounding tubules) around hilar glomerular cross-sections (× 400 magnification) and expressed as the percentage of staining around the perimeter of Bowman’s capsule as described by Lim et al. [33]. Glomerular CD68+ cells were counted in hilar glomerular cross-sections (× 400 magnification). Analysis of interstitial CD68+ cells were performed by assessing twenty consecutive high-power fields (HPFs; magnification, × 400) of the cortex in each section. Using an ocular grid, the number of cells staining positively for each antibody was counted and expressed as cells per field. The glomerular area expressing podocin was assessed in glomerular cross-section using ImageJ and expressed as the percentage of positive staining of glomerular areas.
Primary culture of mouse tubular epithelia cells (TEC) and podocytes
Mouse primary TECs were isolated and cultured according to the method as described previously [21]. The isolation of mouse glomeruli was performed using the Dynabeads perfusion method [34], with modifications. The kidneys were perfused with 107 Dynabeads and harvested. The cortex was dissected, cut into small pieces (~1-2 mm3) and digested in 2 mg/mL collagenase in HBSS at 37°C for 30 min. The collagenase-digested tissue was gently pressed through a 100 μm stainless steel sieve and centrifuged at 200 xg for 5 min. The pellet was resuspended and glomeruli-containing Dyna-beads were gathered in a magnetic field and washed with HBSS. Collected glomeruli were finally resuspended in HBSS and pipetted onto a 40 μm nylon sieve to remove free Dynabeads. Finally the glomeruli were collected by washed through an inverted nylon sieve.
Isolated glomeruli were seeded on type I collagen-coated culture dishes (BD Biosciences) in the DMEM/F-12 medium containing 5% FBS supplemented with 0.5% ITSS, 100 U/mL penicillin, and 100 mg/mL streptomycin (Invitrogen) and incubated in a 37°C humidified incubator. The primary cellular outgrowth from isolated glomeruli was identified to be podocytes. The experiments were commenced after the cells had reached about 80% confluence. The cultured cells were examined for the podocyte markers podocin and nephrin by immunofluorescent staining with anti-podocin or anti-nephrin antibodies. Cells were 98% to 100% positive.
High glucose stimulation of podocytes or TEC in vitro
Cultured podocytes or TECs at 80% confluence were rinsed with PBS and incubated with serum-free DMEM/F12 medium with 0.5% ITSS supplement for podocytes or serum free K1 medium for TECs for 48 hours. The cells were exposed to 30 mM D-glucose (Invitrogen) or mannitol (5.5 mM glucose + 24.5 mM mannitol) as osmotic controls in fresh 0.5% ITSS-sup-plemented DMEM/F12 medium for podocytes or K1 medium for TECs for 12 hours. After stimulation, the cells were washed with PBS and harvested by adding 1 mL of TRIzol (Invitrogen) for mRNA extraction, or processed with Nuc-Buster™ Protein Extraction Kit (Novagen, Darmstadt, Germany) for nuclear protein extraction.
Electrophoretic mobility shift assay (EMSA)
NF-κB DNA binding activity was measured by EMSA as described previously [35]. Nuclear extracts from podocytes were prepared using a NucBuster™ Protein Extraction Kit (Novagen, Darmstadt, Germany) as per the manufacturer’s instructions. EMSA was performed using the DIG Gel Shift Kit (Roche Applied Science, Indianapolis, IN). In brief, 20 μg of nuclear extract was incubated with poly[d(I-C)] as the nonspecific competitor, poly L-lysine in a binding buffer and digoxigenin-labeled NF-κB (5’-AGT TGA GGG GAC TTT CCC AGG C-3’) consensus oligonucleotide for 30 min. The reaction mixture was electrophoresed through a 6% polyacrylamide gel, transferred onto a nylon membrane (Roche Applied Science), and then cross-linked using a UV-transilluminator. The membrane was subjected to immunological detection using anti-digoxigenin-AP conjugate and chemiluminescence. The results were analyzed using Image J software.
Statistical analysis
All data are presented as mean ± SD or mean ± SEM, as appropriate. The statistical differences between two groups were analyzed by unpaired, two-tailed t tests, and multiple groups were compared using one- or two-way ANOVA with post-hoc Bonferroni’s correction (Graph Pad Prism 5.0 software, San Diego, CA), where appropriate. P values less than 0.05 were considered statistically significant.
Results
WT and TLR2-/- mice were equally susceptible to STZ induced diabetes
WT and TLR2-/- mice displayed similar profiles in the development of hyperglycaemia and changes in body weight (Figure 1) over the 24 weeks following administration of streptozotocin. Although the WT mice tended to re-gain weight more rapidly than TLR2-/- mice, the differences were not statistically significant.
Figure 1.
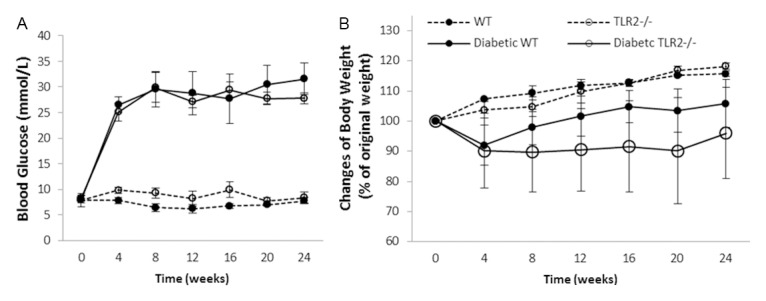
Both WT and TLR2-/- mice developed diabetes. STZ treatment induced diabetes to WT and TLR2-/- mice with similar severity as indicated by changes in blood glucose (A) and body weight (B) over a period of 24 weeks where WT n=12 and TLR2-/- n=9 for week 6 time point; WT n=10 and TLR2-/- n=8 for week 12 time point and WT n=12 and TLR2-/- n=8 for week 24 time point in diabetic groups, while age matched non-diabetic controls were 5 mice per group. Data are shown as mean ± SD.
Evidence of TLR2 activation early in the course of diabetic nephropathy
Gene expression of TLR2 and its endogenous ligands HSP70, HMGB1 and biglycan were elevated in wild type mice with diabetic nephropathy (WT-DN) compared with WT non-diabetic controls (Figure 2).
Figure 2.
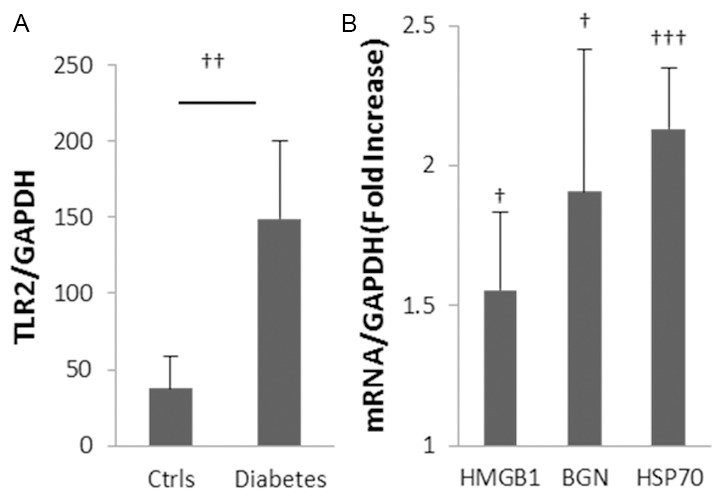
Up-regulation of TLR2 and endogenous ligands in diabetic nephropathy. Gene expression of TLR2 and its ligands were up-regulated in kidney at 10 weeks after initiation of diabetes with STZ (A, B). Data are shown as mean ± SD; †P<0.05 WT diabetic vs. non-diabetic; ††P<0.01 WT diabetic vs. non-diabetic; †††P<0.001 WT diabetic vs. non-diabetic n=7 per group.
Albuminuria in diabetic nephropathy is attenuated by TLR2 deficiency
Six weeks after the initiation of diabetes, WT+STZ mice displayed significantly increased urine albumin to creatinine ratio (UACR) (208.5 ± 25.8 mg/mmol), indicating development of diabetic nephropathy. UACR increased further by week 12 (373.9 ± 25.5 mg/mmol) and remained at that level at week 24 (Figure 3). Albuminuria was halved in TLR2-/-+STZ mice at weeks 6 and 24 (p<0.001).
Figure 3.
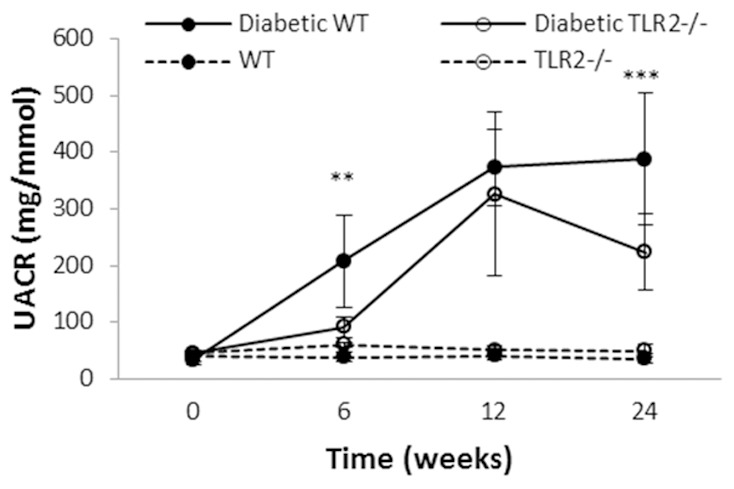
TLR2 deficiency provides partial protection against albuminuria in diabetic nephropathy. Progressive albuminuria was seen in diabetic mice as compared to controls, however among mice with diabetes, TLR2-/- mice developed significantly less albuminuria than WT. Data are shown as mean ± SD; **P<0.01 WT diabetic vs. TLR2-/- diabetic; ***P<0.001 WT diabetic vs. TLR2-/- diabetic. The number of animals per group was defined in Figure 1.
TLR2 deficiency provided protection against the development of kidney hypertrophy and glomerular injury from diabetes
Kidney hypertrophy is one of the early anatomical changes of diabetic nephropathy [36]. In STZ-diabetic mice, WT mice developed substantial kidney hypertrophy as indicated by a 20% increase in kidney to body weight ratio at week 24 (Figure 4A, p<0.001), whereas TLR2-/- mice showed no increase.
Figure 4.
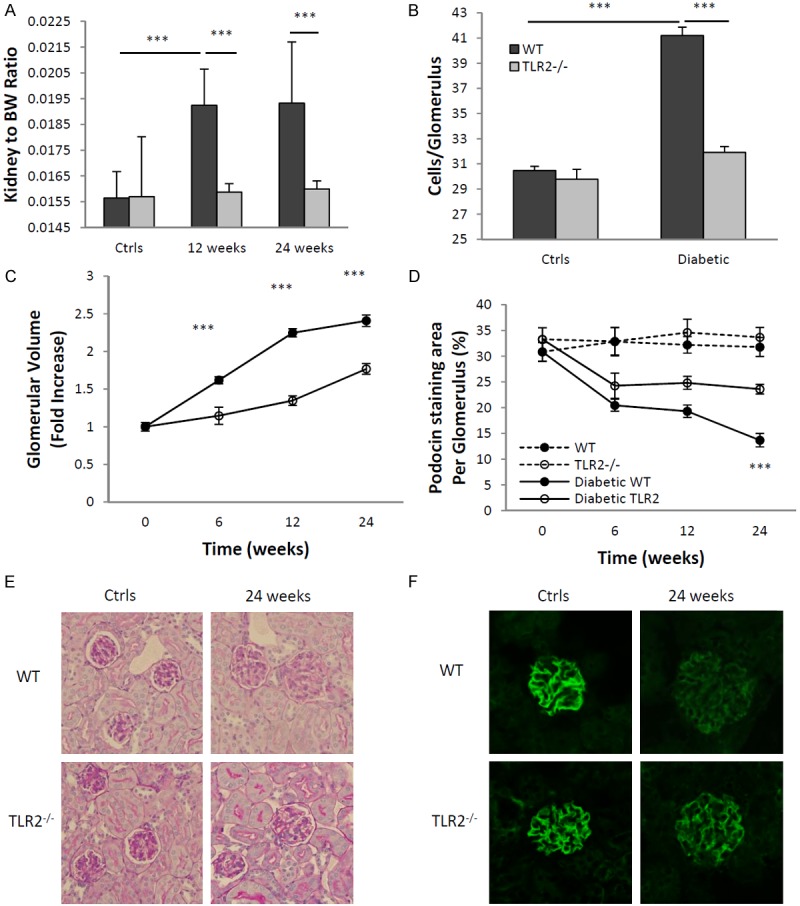
Glomerular enlargement and podocyte injury caused by diabetes were attenuated in the absence of TLR2. TLR2-/- mice with diabetes were relatively protected from development of diabetic nephropathy as compared to WT mice with diabetes, as assessed by glomerular hypertrophy indicated by increased kidney to bodyweight ratio (A) glomerular hyper-cellularity (B) and glomerular volume (C). Podocyte damage was also less severe in TLR2-/- mice with diabetes, as assessed by decreased podocin staining (D, F). (E) Representative sections of glomeruli from WT and TLR2-/-, diabetic and non diabetic mice (PAS stained, × 400). (F) Representative sections of glomeruli stained for podocin at different time points are shown, with the top panels showing reduction of podocin in WT mice with diabetes, which was less pronounced in TLR2-/- mice with diabetes (bottom panels). The data shown are the means ± SEM; ***P<0.001 WT diabetic vs. TLR2-/- diabetic; †††P<0.001 WT diabetic vs. non-diabetic. The number of animals per group was defined in Figure 1.
As compared to age-matched, non-diabetic controls, glomerular volume increased progressively in WT mice with diabetes. No increase in volume was evident in TLR2-/- mice with diabetes until week 24, where minor increases only were observed, significantly less than WT (Figure 4B, 4E).
Glomerular cellularity was assessed at week 24, disclosing a mean 30% increase in WT mice with diabetes as compared to non-diabetic controls (p<0.001), whereas TLR2 deficient mice with diabetes displayed no significant increase in glomerular cell number (Figure 4C).
Albuminuria is typically associated with podocyte damage, loss, or reorganization of podocyte-associated molecules [37]. Podocin is a conventional marker for podocytes and expression of podocin is a sensitive maker of injury to this cell type and a correlate of albuminuria [38]. Immunofluorescent staining indicated a significant reduction in podocin expression in glomeruli from WT mice with diabetes as compared to WT controls and this was progressive over the experimental time course (p<0.001). By comparison, podocin loss was less apparent in TLR2-/- diabetic mice, significantly so at week 24 (p<0.001, Figure 4D, 4E).
TLR2 deficiency attenuated kidney fibrosis and tubular injury
The degree of interstitial fibrosis is strongly associated with prognosis in patients with diabetic nephropathy, with significant fibrosis predicting a high probability of progression and kidney failure. Accumulation of myofibroblasts within the glomerulus and interstitium, indicated by the appearance of α-smooth muscle actin (α-SMA), and interstitial deposition of matrix components, such as collagen, are histological indicators of fibrosis. Immunostaining for α-SMA revealed significant periglomerular and interstitial accumulation of myofibroblasts in WT-DN at week 24 compared to non-diabetic WT controls (Figure 5A, 5C, p<0.001). This increase was not observed in TLR2-/- diabetic kidneys. Collagen deposition was also observed in WT-DN, increased 3-fold at week 12 and further at week 24 (p<0.001). Collagen staining was significantly less than WT-DN in TLR2-/- diabetic kidneys at both time points (Figure 5B, 5D).
Figure 5.

TLR2 deficiency was protective against diabetic tubular injury and fibrosis. TLR2 deficiency protected diabetic kidneys from interstitial fibrosis and tubular injuries. (A) As compared to non-diabetic controls, α-SMA expression was increased in WT but not TLR2-/- kidneys as assessed by IHC. (C) Representative sections are shown with α-SMA over-expression in WT diabetic kidney (top panels), which was reduced in TLR2-/- diabetic kidney (bottom panels). (B) Interstitial collagen expression was significantly up-regulated at 12 and 24 weeks in diabetic WT kidneys compared with diabetic TLR2-/- kidneys. (D) Representative sections of PSR staining in WT (top panels) and TLR2-/- (bottom panels) diabetic kidney. (E) Significant up-regulation of KIM-1 in WT diabetic kidney indicated tubular injury, which was attenuated in TLR2-/- diabetic kidneys. Primary TECs from WT mice and TLR2-/- mice were cultured with normal glucose (NG) (5.5 mM glucose + 24.5 mM mannitol) or high glucose (HG) (5.5 mM glucose + 24.5 mM glucose) for 12 hours. Under high glucose conditions TECs displayed up-regulation of TLR2 (G), its endogenous ligands (F) and downstream effectors, among which CCL2, IL6 and TGF-β were significant supressed by TLR2 deficiency (H). Data are shown as mean ± SEM; *P<0.05 WT HG vs. TLR2-/- HG; **P<0.01 WT HG vs. TLR2-/- HG; ***P<0.001 WT diabetic vs. TLR2-/- diabetic; †P<0.05 WT NG vs. HG; ††P<0.01 WT NG vs. HG; †††P<0.001 WT diabetic vs. non-diabetic. The number of animals per group was defined in Figure 1.
We also examined kidney mRNA expression of KIM-1 as an early marker for tubular injury. Gene expression of KIM-1 was significantly elevated in WT diabetic kidneys at week 24 compared to WT controls (Figure 5E). KIM-1 expression was not increased in diabetic TLR2-/- kidneys at any time-point, suggesting that TLR2 might be involved in the initiation of diabetic tubular injury.
In vitro, primary TECs displayed up-regulated expression of TLR2 and its ligands (HMGB1, HSP70 and biglycan) under high glucose conditions (Figure 5F, 5G). High-glucose stimulation also increased gene expression of pro-inflammatory chemokines and cytokines as well as pro-fibrotic genes (Figure 5H). By comparison, expression of CCL2, IL6, TGF-β and fibronectin were significantly attenuated in TLR2-deficient podocytes exposed to high glucose media.
TLR2 deficiency reduced macrophage accumulation in diabetic kidneys
A 2-fold increase in the number of interstitial CD68+ macrophages was evident in kidneys from WT diabetic mice throughout the time course (Figure 6A). This increase was not seen in TLR2-/- diabetic kidneys. At week 24, glomerular accumulation of macrophages was evident diabetic WT but not TLR2-/- mice (Figure 6B).
Figure 6.
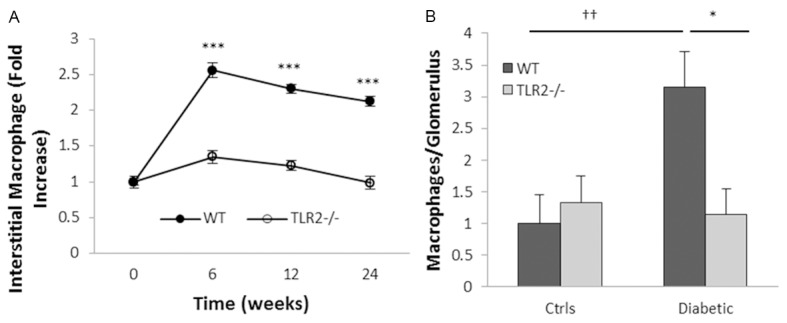
TLR2 deficiency ameliorated macrophage accumulation in diabetic kidneys (A) Interstitial and (B) glomerular CD68+ macrophage accumulation was evident in WT but not TLR2 deficient mice with diabetes. Data are present as mean ± SEM. *P<0.05 WT diabetic vs. TLR2-/- diabetic; ***P<0.001 WT diabetic vs. TLR2-/- diabetic; ††P<0.01 WT diabetic vs. non-diabetic. The number of animals per group was defined in Figure 1.
TLR2 deficiency suppressed expression of inflammatory and fibrotic genes in diabetic kidneys
TLR2 engagement initiates a signalling cascade leading to activation of transcription factor NFκB, which up-regulates multiple inflammatory genes. To investigate the impact of TLR2 signalling, mRNA expression of TLR2 downstream cytokines, chemokines and fibrosis-related genes in the kidney were examined by real-time PCR. IL-6 mRNA expression was up-regulated in WT diabetic kidney with a peak at week 6 compared with WT non diabetic controls, however up-regulation was not observed in TLR2-/- diabetic kidneys (Figure 7A). TNF-α was progressively elevated in WT diabetic kidney but not in TLR2-/- diabetic kidney (Figure 7B). Gene expression of chemokines in WT diabetic kidney was substantially increased: 20 to 35 fold for CCL2 and 7 to 15 fold for CXCL10 compared with WT non diabetic controls (p<0.001). This was greatly attenuated in TLR2-/-diabetic kidneys at all time-points (Figure 7C, 7D). TGF-β and fibronectin were also significantly upregulated in WT diabetic kidney, though not in TLR2-/- diabetic kidneys (Figure 7E, 7F).
Figure 7.

TLR2 deficiency reduced inflammatory and fibrotic gene expression in diabetic kidneys. RT-PCR demonstrated substantial up-regulation of mRNA expression of IL6 (A), TNF-α (B), CCL2 (C), CXCL10 (D), TGF-β (E) and fibronectin (F) in WT diabetic kidneys, all of which were markedly diminished by deficiency of TLR2. Data are shown as means ± SEM. *P<0.05 WT diabetic vs. TLR2-/- diabetic **P<0.01 WT diabetic vs. TLR2-/- diabetic; ***P<0.001 WT diabetic vs. TLR2-/- diabetic. The number of animals per group was defined in Figure 1.
TLR2 mediates inflammatory and pro-fibrotic responses in podocytes under high-glucose conditions
To determine whether the impact of high glucose on podocytes is mediated via TLR2, we stimulated primary podocyte cultures with either high-concentration glucose or physiological-concentration glucose plus mannitol, to control for osmolality, in vitro. The podocyte purity was tested by immunofluorescent staining with anti-podocin or anti-nephrin antibodies. Cells were 98% to 100% positive (Figure 8E). After 12 hours stimulation with high-concentration glucose, WT podocytes exhibited a 3-fold increase in TLR2 mRNA above osmotic controls (Figure 8A). High-glucose elicited a 2 to 4-fold increase in CXCL10 and CCL2 expression, a 3-fold increase in TNFα and 2 to 3-fold increases in TGF-β and fibronectin in WT podocytes over controls, and these increases were markedly diminished in TLR2-/- podocytes (p<0.05) (Figure 8B). Furthermore, we examined NF-κB activity by EMSA and found that NF-κB DNA binding activity was promoted in WT podocytes but not in TLR2-/- podocytes by 12 hour high glucose stimulation (Figure 8C, 8D).
Figure 8.
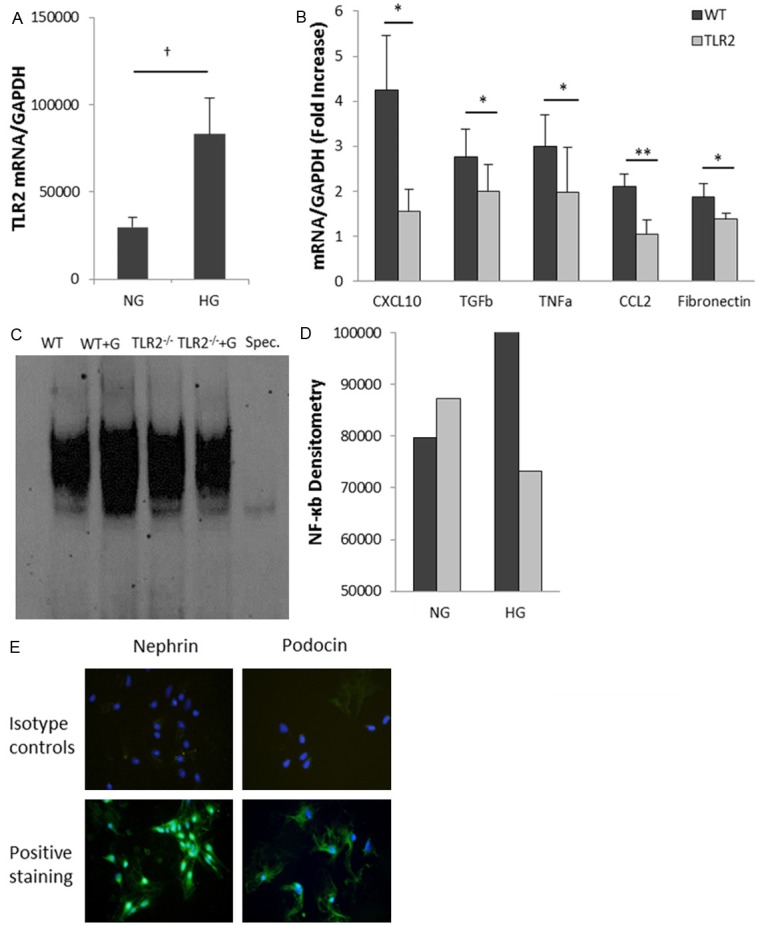
High concentration glucose induces activation of pro-inflammatory pathways in podocytes via TLR2. Primary podocytes from WT mice and TLR2-/- mice were cultured with normal glucose (5.5 mM glucose + 24.5 mM mannitol) or high glucose (5.5 mM glucose + 24.5 mM glucose) for 12 hours. (A) Real-time PCR analysis demonstrated that high glucose concentration induced up-regulation of TLR2 (A) and its downstream molecules (B). High-glucose-induced up-regulation of these molecules was significantly reduced in podocytes derived from TLR2-/- mice. (C, D) NF-κB DNA binding activity was increased in WT podocytes after high glucose stimulation for 12 hours compared with osmotic controls, but not in TLR2-/- podocytes. Primary podocyte cultures were defined by positive staining for the podocyte markers podocin and nephrin (E). Data are shown as means ± SEM; *P<0.05 WT HG vs. TLR2-/- HG **P<0.001 WT HG vs. TLR2-/- HG; †P<0.05 WT NG vs. HG.
Discussion
An important role for inflammation in the development and progression of diabetic complications has recently been established [39-41]. Previous reports have observed activation of innate immunity in patients with diabetic complications [5,29,42,43] and experimental data have demonstrated that TLR-pathway signalling in kidney triggers inflammation and injury during the development STZ-induced diabetic nephropathy [6,27,44,45]. The present study confirms a role for TLR2 in the development of diabetic nephropathy and extends this by demonstrating mechanistic involvement of this pathway in critical aspects of progression, namely podocyte damage and tubulointerstitial fibrosis.
TLR2 is present on both immune cells and kidney parenchymal cells, and recognizes endogenous ligands including HSPs, HMGB1 and biglycan expressed within damaged tissue, which trigger “sterile inflammation”. TLR2 activation recruits the adaptor molecule MyD88 and leads to translocation of NF-κB and/or the activation of MAPKs, resulting in up-regulation of proinflammatory cytokines and chemokines and thereby initiation of inflammation. Activation of the TLR2-MyD88 signalling pathway has previously been demonstrated in diabetic kidneys [27]. In our study, we confirmed a role for the TLR2 pathway as kidneys obtained from WT mice with diabetes expressed TLR2, endogenous TLR2-ligands and TLR2-downstream chemokines and cytokines. These mice exhibited albuminuria and typical histological changes of diabetic nephropathy, including glomerular hypertrophy and hypercellularity, macrophage accumulation and fibrosis at later time points. As compared to WT mice, TLR2-/- mice were significantly protected from all aspects of diabetic nephropathy.
Albuminuria is recognised as both a hallmark of diabetic nephropathy and as a marker of podocyte injury [37,46]. Podocytes have been shown to express TLRs and activation of the TLR4-pathway by endogenous ligands has recently been found to drive inflammation in experimental membranoproliferative glomerulonephritis [20]. In our study, primary cultures of podocytes displayed up-regulation of TLR2 and its endogenous ligands in response to high-glucose conditions. Increased NF-κB binding activity and upregulation of TLR2-downstream cytokines (TNF-α and TGF-β) and chemokines (CXCL10 and CCL2) were also observed, but not when podocytes isolated from TLR2-/- mice were examined under the same conditions. These in vitro findings demonstrate the potential for TLR2-pathway activation in podocytes in response to high ambient glucose. Consistent with that, WT mice with diabetes developed significant albuminuria and depletion of podocin, indicating podocyte damage, whereas TLR2-/- diabetic mice were partially protected. Taken together, these findings strongly suggest a role for TLR2 activation in podocytes in the pathogenesis of DN.
Macrophage recruitment is a well-recognised feature of inflammation in DN [47]. Macrophages induce injury in experimental models of immune-mediated kidney disease, and correlate with renal impairment in human glomerulonephritis [48,49]. Macrophage accumulation has been observed in early stages of DN in human [50] and this has been associated with overexpression of CCL2 [45]. Hyperglycaemia is known to promote monocyte TLR2 expression in patients with diabetes and elevated mRNA levels of TLR2 and its ligands have been found in circulating monocytes of Type 2 diabetic subjects [51]. In keeping with this human data, kidneys in WT diabetic mice in our study strongly expressed CCL2 and were rich in endogenous TLR2 ligand expression, thus providing ample signals to recruit and activate macrophages through TLR2. Macrophage accumulation in glomerular and tubulointerstitial compartments was strikingly absent in TLR2-/- mice with diabetes, confirming one previous report [27] and implicating TLR2 as an important instigator of macrophage mediated kidney damage in DN.
Fibrosis is the final common pathway in progressive kidney disease and DN in particular. Diabetic TLR2-/- mice in our study were substantially protected from the upregulation of TGF-β and fibronectin and accumulation of α-SMA(+) myofibroblasts and collagen that were evident in diabetic WT mice. Whether TLR2 is a specific mediator of fibrosis in DN, or simply a driver of inflammation which secondarily results in healing by fibrosis, was not specifically determined. TLR4 has been implicated in fibrotic responses in liver and heart in a TGF-β-dependent manner [52,53], and in experimental kidney disease [54,55]. Our in vitro results demonstrating that podocytes upregulated TGF-β and fibronectin in response to high concentration glucose in a TLR2-dependent manner support a direct role for TLR2 in driving fibrosis.
We conclude that TLR2 was required for the full development of inflammation, kidney damage and fibrosis in this model of diabetic nephropathy. As TLR2 is known to be expressed by mesangial and TECs and as the current study showed that high concentration glucose stimulated podocytes and TECs in vitro to express TLR2 and TLR2 ligands, as well as pro-inflammatory and pro-fibrotic cytokines in a TLR2 dependent manner, it appears likely that TLR2 signalling in intrinsic kidney cells contributes to the pathogenesis of diabetic nephropathy.
Acknowledgements
We gratefully acknowledge Ms. M O’Brien and Dr J Yin for their technique assistance. This work was supported by the National Health and Medical Research Council of Australia (Project Grant #636273 to SJ.C, C P, H.W and U.P) and University of Sydney Postgraduate Award to J.M.
Disclosure of conflict of interest
None.
References
- 1.Hovind P, Tarnow L, Rossing K, Rossing P, Eising S, Larsen N, Binder C, Parving HH. Decreasing incidence of severe diabetic microangiopathy in type 1 diabetes. Diabetes Care. 2003;26:1258–1264. doi: 10.2337/diacare.26.4.1258. [DOI] [PubMed] [Google Scholar]
- 2.White SL, Cass A, Atkins RC, Chadban SJ. Chronic kidney disease in the general population. Adv Chronic Kidney Dis. 2005;12:5–13. doi: 10.1053/j.ackd.2004.10.009. [DOI] [PubMed] [Google Scholar]
- 3.de Boer IH, Rue TC, Hall YN, Heagerty PJ, Weiss NS, Himmelfarb J. Temporal trends in the prevalence of diabetic kidney disease in the United States. JAMA. 2011;305:2532–2539. doi: 10.1001/jama.2011.861. [DOI] [PMC free article] [PubMed] [Google Scholar]
- 4.Weil EJ, Lemley KV, Mason CC, Yee B, Jones LI, Blouch K, Lovato T, Richardson M, Myers BD, Nelson RG. Podocyte detachment and reduced glomerular capillary endothelial fenestration promote kidney disease in type 2 diabetic nephropathy. Kidney Int. 2012;82:1010–1017. doi: 10.1038/ki.2012.234. [DOI] [PMC free article] [PubMed] [Google Scholar]
- 5.Lim AKH, Tesch GH. Inflammation in Diabetic Nephropathy. Mediators Inflamm. 2012;2012:12. doi: 10.1155/2012/146154. [DOI] [PMC free article] [PubMed] [Google Scholar]
- 6.Lin M, Yiu WH, Wu HJ, Chan LY, Leung JC, Au WS, Chan KW, Lai KN, Tang SC. Toll-like receptor 4 promotes tubular inflammation in diabetic nephropathy. J Am Soc Nephrol. 2012;23:86–102. doi: 10.1681/ASN.2010111210. [DOI] [PMC free article] [PubMed] [Google Scholar]
- 7.Medzhitov R, Janeway CA Jr. Decoding the patterns of self and nonself by the innate immune system. Science. 2002;296:298–300. doi: 10.1126/science.1068883. [DOI] [PubMed] [Google Scholar]
- 8.Matzinger P. The danger model: a renewed sense of self. Science. 2002;296:301–305. doi: 10.1126/science.1071059. [DOI] [PubMed] [Google Scholar]
- 9.Gordon S. Pattern recognition receptors: doubling up for the innate immune response. Cell. 2002;111:927–930. doi: 10.1016/s0092-8674(02)01201-1. [DOI] [PubMed] [Google Scholar]
- 10.Medzhitov R, Preston-Hurlburt P, Janeway CA Jr. A human homologue of the Drosophila Toll protein signals activation of adaptive immunity. Nature. 1997;388:394–397. doi: 10.1038/41131. [DOI] [PubMed] [Google Scholar]
- 11.Marshak-Rothstein A. Toll-like receptors in systemic autoimmune disease. Nat Rev Immunol. 2006;6:823–835. doi: 10.1038/nri1957. [DOI] [PMC free article] [PubMed] [Google Scholar]
- 12.Beg AA. Endogenous ligands of Toll-like receptors: implications for regulating inflammatory and immune responses. Trends Immunol. 2002;23:509–512. doi: 10.1016/s1471-4906(02)02317-7. [DOI] [PubMed] [Google Scholar]
- 13.Vabulas RM, Ahmad-Nejad P, Ghose S, Kirschning CJ, Issels RD, Wagner H. HSP70 as endogenous stimulus of the Toll/interleukin-1 receptor signal pathway. J Biol Chem. 2002;277:15107–15112. doi: 10.1074/jbc.M111204200. [DOI] [PubMed] [Google Scholar]
- 14.Yu M, Wang H, Ding A, Golenbock DT, Latz E, Czura CJ, Fenton MJ, Tracey KJ, Yang H. HMGB1 signals through toll-like receptor (TLR) 4 and TLR2. Shock. 2006;26:174–179. doi: 10.1097/01.shk.0000225404.51320.82. [DOI] [PubMed] [Google Scholar]
- 15.Schaefer L, Babelova A, Kiss E, Hausser HJ, Baliova M, Krzyzankova M, Marsche G, Young MF, Mihalik D, Gotte M, Malle E, Schaefer RM, Grone HJ. The matrix component biglycan is proinflammatory and signals through Toll-like receptors 4 and 2 in macrophages. J Clin Invest. 2005;115:2223–2233. doi: 10.1172/JCI23755. [DOI] [PMC free article] [PubMed] [Google Scholar]
- 16.Akira S, Takeda K. Toll-like receptor signalling. Nat Rev Immunol. 2004;4:499–511. doi: 10.1038/nri1391. [DOI] [PubMed] [Google Scholar]
- 17.Janeway CA Jr, Medzhitov R. Innate immune recognition. Annu Rev Immunol. 2002;20:197–216. doi: 10.1146/annurev.immunol.20.083001.084359. [DOI] [PubMed] [Google Scholar]
- 18.Ando M, Shibuya A, Tsuchiya K, Akiba T, Nitta K. Reduced expression of Toll-like receptor 4 contributes to impaired cytokine response of monocytes in uremic patients. Kidney Int. 2006;70:358–362. doi: 10.1038/sj.ki.5001548. [DOI] [PubMed] [Google Scholar]
- 19.Anders HJ, Banas B, Schlondorff D. Signaling danger: toll-like receptors and their potential roles in kidney disease. J Am Soc Nephrol. 2004;15:854–867. doi: 10.1097/01.asn.0000121781.89599.16. [DOI] [PubMed] [Google Scholar]
- 20.Banas MC, Banas B, Hudkins KL, Wietecha TA, Iyoda M, Bock E, Hauser P, Pippin JW, Shankland SJ, Smith KD, Stoelcker B, Liu G, Grone HJ, Kramer BK, Alpers CE. TLR4 links podocytes with the innate immune system to mediate glomerular injury. J Am Soc Nephrol. 2008;19:704–713. doi: 10.1681/ASN.2007040395. [DOI] [PMC free article] [PubMed] [Google Scholar]
- 21.Wu H, Chen G, Wyburn KR, Yin J, Bertolino P, Eris JM, Alexander SI, Sharland AF, Chadban SJ. TLR4 activation mediates kidney ischemia/reperfusion injury. J Clin Invest. 2007;117:2847–2859. doi: 10.1172/JCI31008. [DOI] [PMC free article] [PubMed] [Google Scholar]
- 22.Zhang B, Ramesh G, Uematsu S, Akira S, Reeves WB. TLR4 signaling mediates inflammation and tissue injury in nephrotoxicity. J Am Soc Nephrol. 2008;19:923–932. doi: 10.1681/ASN.2007090982. [DOI] [PMC free article] [PubMed] [Google Scholar]
- 23.Leemans JC, Stokman G, Claessen N, Rouschop KM, Teske GJ, Kirschning CJ, Akira S, van der Poll T, Weening JJ, Florquin S. Renal-associated TLR2 mediates ischemia/reperfusion injury in the kidney. J Clin Invest. 2005;115:2894–2903. doi: 10.1172/JCI22832. [DOI] [PMC free article] [PubMed] [Google Scholar]
- 24.Brown HJ, Lock HR, Sacks SH, Robson MG. TLR2 stimulation of intrinsic renal cells in the induction of immune-mediated glomerulonephritis. J Immunol. 2006;177:1925–1931. doi: 10.4049/jimmunol.177.3.1925. [DOI] [PubMed] [Google Scholar]
- 25.Pawar RD, Patole PS, Zecher D, Segerer S, Kretzler M, Schlondorff D, Anders HJ. Toll-like receptor-7 modulates immune complex glomerulonephritis. J Am Soc Nephrol. 2006;17:141–149. doi: 10.1681/ASN.2005070714. [DOI] [PubMed] [Google Scholar]
- 26.Mohammad MK, Morran M, Slotterbeck B, Leaman DW, Sun Y, Grafenstein H, Hong SC, McInerney MF. Dysregulated Toll-like receptor expression and signaling in bone marrow-derived macrophages at the onset of diabetes in the non-obese diabetic mouse. Int Immunol. 2006;18:1101–1113. doi: 10.1093/intimm/dxl045. [DOI] [PubMed] [Google Scholar]
- 27.Devaraj S, Tobias P, Kasinath BS, Ramsamooj R, Afify A, Jialal I. Knockout of toll-like receptor-2 attenuates both the proinflammatory state of diabetes and incipient diabetic nephropathy. Arterioscler Thromb Vasc Biol. 2011;31:1796–1804. doi: 10.1161/ATVBAHA.111.228924. [DOI] [PMC free article] [PubMed] [Google Scholar]
- 28.Devaraj S, Tobias P, Jialal I. Knockout of toll-like receptor-4 attenuates the pro-inflammatory state of diabetes. Cytokine. 2011;55:441–445. doi: 10.1016/j.cyto.2011.03.023. [DOI] [PubMed] [Google Scholar]
- 29.Devaraj S, Jialal I, Yun JM, Bremer A. Demonstration of increased toll-like receptor 2 and toll-like receptor 4 expression in monocytes of type 1 diabetes mellitus patients with microvascular complications. Metabolism. 2011;60:256–259. doi: 10.1016/j.metabol.2010.01.005. [DOI] [PMC free article] [PubMed] [Google Scholar]
- 30.Nymark M, Pussinen PJ, Tuomainen AM, Forsblom C, Groop PH, Lehto M. Serum lipopolysaccharide activity is associated with the progression of kidney disease in finnish patients with type 1 diabetes. Diabetes care. 2009;32:1689–1693. doi: 10.2337/dc09-0467. [DOI] [PMC free article] [PubMed] [Google Scholar]
- 31.Nagata M, Kriz W. Glomerular damage after uninephrectomy in young rats. II. Mechanical stress on podocytes as a pathway to sclerosis. Kidney Int. 1992;42:148–160. doi: 10.1038/ki.1992.272. [DOI] [PubMed] [Google Scholar]
- 32.McWhinnie DL, Thompson JF, Taylor HM, Chapman JR, Bolton EM, Carter NP, Wood RF, Morris PJ. Morphometric analysis of cellular infiltration assessed by monoclonal antibody labeling in sequential human renal allograft biopsies. Transplantation. 1986;42:352–358. doi: 10.1097/00007890-198610000-00004. [DOI] [PubMed] [Google Scholar]
- 33.Lim AK, Ma FY, Nikolic-Paterson DJ, Thomas MC, Hurst LA, Tesch GH. Antibody blockade of c-fms suppresses the progression of inflammation and injury in early diabetic nephropathy in obese db/db mice. Diabetologia. 2009;52:1669–1679. doi: 10.1007/s00125-009-1399-3. [DOI] [PubMed] [Google Scholar]
- 34.Takemoto M, Asker N, Gerhardt H, Lundkvist A, Johansson BR, Saito Y, Betsholtz C. A new method for large scale isolation of kidney glomeruli from mice. Am J Path. 2002;161:799–805. doi: 10.1016/S0002-9440(10)64239-3. [DOI] [PMC free article] [PubMed] [Google Scholar]
- 35.Wu H, Ma J, Wang P, Corpuz TM, Panchapakesan U, Wyburn KR, Chadban SJ. HMGB1 contributes to kidney ischemia reperfusion injury. J Am Soc Nephrol. 2010;21:1878–1890. doi: 10.1681/ASN.2009101048. [DOI] [PMC free article] [PubMed] [Google Scholar]
- 36.Mauer M, Drummond K. The early natural history of nephropathy in type 1 diabetes: I. Study design and baseline characteristics of the study participants. Diabetes. 2002;51:1572–1579. doi: 10.2337/diabetes.51.5.1572. [DOI] [PubMed] [Google Scholar]
- 37.Kerjaschki D. Caught flat-footed: podocyte damage and the molecular bases of focal glomerulosclerosis. J Clin Invest. 2001;108:1583–1587. doi: 10.1172/JCI14629. [DOI] [PMC free article] [PubMed] [Google Scholar]
- 38.Mundel P, Shankland SJ. Podocyte biology and response to injury. J Am Soc Nephrol. 2002;13:3005–3015. doi: 10.1097/01.asn.0000039661.06947.fd. [DOI] [PubMed] [Google Scholar]
- 39.Nin JW, Ferreira I, Schalkwijk CG, Prins MH, Chaturvedi N, Fuller JH, Stehouwer CD. Serum high-mobility group box-1 levels are positively associated with micro- and macroalbuminuria but not with cardiovascular disease in type 1 diabetes: the EURODIAB Prospective Complications Study. Eur J Endocrinol. 2012;166:325–332. doi: 10.1530/EJE-11-0662. [DOI] [PubMed] [Google Scholar]
- 40.Miyamoto S, Shikata K, Miyasaka K, Okada S, Sasaki M, Kodera R, Hirota D, Kajitani N, Takatsuka T, Kataoka HU, Nishishita S, Sato C, Funakoshi A, Nishimori H, Uchida HA, Ogawa D, Makino H. Cholecystokinin plays a novel protective role in diabetic kidney through anti-inflammatory actions on macrophage: anti-inflammatory effect of cholecystokinin. Diabetes. 2012;61:897–907. doi: 10.2337/db11-0402. [DOI] [PMC free article] [PubMed] [Google Scholar]
- 41.Nogueira-Machado JA, Volpe CM, Veloso CA, Chaves MM. HMGB1, TLR and RAGE: a functional tripod that leads to diabetic inflammation. Expert Opin Ther Targets. 2011;15:1023–1035. doi: 10.1517/14728222.2011.575360. [DOI] [PubMed] [Google Scholar]
- 42.Devaraj S, Dasu MR, Park SH, Jialal I. Increased levels of ligands of Toll-like receptors 2 and 4 in type 1 diabetes. Diabetologia. 2009;52:1665–1668. doi: 10.1007/s00125-009-1394-8. [DOI] [PMC free article] [PubMed] [Google Scholar]
- 43.Devaraj S, Dasu MR, Rockwood J, Winter W, Griffen SC, Jialal I. Increased toll-like receptor (TLR) 2 and TLR4 expression in monocytes from patients with type 1 diabetes: further evidence of a proinflammatory state. J Clin Endocrinol Metab. 2008;93:578–583. doi: 10.1210/jc.2007-2185. [DOI] [PMC free article] [PubMed] [Google Scholar]
- 44.Kuwabara T, Mori K, Mukoyama M, Kasahara M, Yokoi H, Saito Y, Ogawa Y, Imamaki H, Kawanishi T, Ishii A, Koga K, Mori KP, Kato Y, Sugawara A, Nakao K. Exacerbation of diabetic nephropathy by hyperlipidaemia is mediated by Toll-like receptor 4 in mice. Diabetologia. 2012;55:2256–2266. doi: 10.1007/s00125-012-2578-1. [DOI] [PubMed] [Google Scholar]
- 45.Lin M, Yiu WH, Wu HJ, Chan LY, Leung JC, Au WS, Chan KW, Lai KN, Tang SC. Toll-Like Receptor 4 Promotes Tubular Inflammation in Diabetic Nephropathy. J Am Soc Nephrol. 2012;23:86–102. doi: 10.1681/ASN.2010111210. [DOI] [PMC free article] [PubMed] [Google Scholar]
- 46.Pagtalunan ME, Miller PL, Jumping-Eagle S, Nelson RG, Myers BD, Rennke HG, Coplon NS, Sun L, Meyer TW. Podocyte loss and progressive glomerular injury in type II diabetes. J Clin Invest. 1997;99:342–348. doi: 10.1172/JCI119163. [DOI] [PMC free article] [PubMed] [Google Scholar]
- 47.Chow F, Ozols E, Nikolic-Paterson DJ, Atkins RC, Tesch GH. Macrophages in mouse type 2 diabetic nephropathy: correlation with diabetic state and progressive renal injury. Kidney Int. 2004;65:116–128. doi: 10.1111/j.1523-1755.2004.00367.x. [DOI] [PubMed] [Google Scholar]
- 48.Ikezumi Y, Hurst LA, Masaki T, Atkins RC, Nikolic-Paterson DJ. Adoptive transfer studies demonstrate that macrophages can induce proteinuria and mesangial cell proliferation. Kidney Int. 2003;63:83–95. doi: 10.1046/j.1523-1755.2003.00717.x. [DOI] [PubMed] [Google Scholar]
- 49.Nikolic-Paterson DJ, Atkins RC. The role of macrophages in glomerulonephritis. Nephrol Dial Transplant. 2001;16(Suppl 5):3–7. doi: 10.1093/ndt/16.suppl_5.3. [DOI] [PubMed] [Google Scholar]
- 50.Nguyen D, Ping F, Mu W, Hill P, Atkins RC, Chadban SJ. Macrophage accumulation in human progressive diabetic nephropathy. Nephrology (Carlton) 2006;11:226–231. doi: 10.1111/j.1440-1797.2006.00576.x. [DOI] [PubMed] [Google Scholar]
- 51.Dasu MR, Devaraj S, Park S, Jialal I. Increased toll-like receptor (TLR) activation and TLR ligands in recently diagnosed type 2 diabetic subjects. Diabetes Care. 2010;33:861–868. doi: 10.2337/dc09-1799. [DOI] [PMC free article] [PubMed] [Google Scholar]
- 52.Seki E, De Minicis S, Osterreicher CH, Kluwe J, Osawa Y, Brenner DA, Schwabe RF. TLR4 enhances TGF-beta signaling and hepatic fibrosis. Nat Med. 2007;13:1324–1332. doi: 10.1038/nm1663. [DOI] [PubMed] [Google Scholar]
- 53.Timmers L, Sluijter JP, van Keulen JK, Hoefer IE, Nederhoff MG, Goumans MJ, Doevendans PA, van Echteld CJ, Joles JA, Quax PH, Piek JJ, Pasterkamp G, de Kleijn DP. Toll-like receptor 4 mediates maladaptive left ventricular remodeling and impairs cardiac function after myocardial infarction. Circ Res. 2008;102:257–264. doi: 10.1161/CIRCRESAHA.107.158220. [DOI] [PubMed] [Google Scholar]
- 54.Pulskens WP, Rampanelli E, Teske GJ, Butter LM, Claessen N, Luirink IK, van der Poll T, Florquin S, Leemans JC. TLR4 promotes fibrosis but attenuates tubular damage in progressive renal injury. J Am Soc Nephrol. 2010;21:1299–1308. doi: 10.1681/ASN.2009070722. [DOI] [PMC free article] [PubMed] [Google Scholar]
- 55.Campbell MT, Hile KL, Zhang H, Asanuma H, Vanderbrink BA, Rink RR, Meldrum KK. Toll-like receptor 4: a novel signaling pathway during renal fibrogenesis. J Surg Res. 2011;168:e61–69. doi: 10.1016/j.jss.2009.09.053. [DOI] [PMC free article] [PubMed] [Google Scholar]