Abstract
Gemcitabine (Gem)-based chemotherapies are the main therapeutic regimens for patients with unresectable advanced or metastatic gallbladder cancer (GBC). However, the modest ORR and mild benefit on survival demonstrates the need for finding biomarkers for sensitivity to Gem and hence improving the therapy. In present work, two GBC cell lines with vast difference in sensitivity to Gem were subjected to DNA microarray analysis. Dramatic expression difference was found in protein kinase A signaling, P2Y purigenic receptor signaling, ErbB signaling and p70S6K signaling. Predicted low expression of KRAS and inactivation of AKT/ERK signaling in Gem-resistant GBC cells was validated by quantitative PCR and immunoblotting, respectively. However, p70S6K, p38MAPK and NF-κB signaling was probably activated in Gem-resistant GBC cells, which deserves further investigation in more GBC cell lines and tissues. Our work provides potential pathway signatures for Gem sensitivity of GBC patients.
Keywords: Gallbladder cancer, gemcitabine, DNA microarray analysis, KRAS, AKT signaling, ERK signaling, p38MAPK, p70S6K, NF-κB
Introduction
Gallbladder carcinoma (GBC), the most common and aggressive type of biliary tract cancer (BTC), is challenging to treat due to both its inability to be detected at an early stage and its poor sensitivity to conventional therapies [1,2]. Owing to the symptoms are seldom suggestive of cancer, the majority of patients already have locally advanced or metastatic disease at the time of diagnosis [1,2]. For patients with unresectable advanced or metastatic GBC, gemcitabine (Gem)-based chemotherapies are the main therapeutic regimens. According to the phase 3 trial ABC-02, combination of Gem and cisplatin can serve as a standard care for advanced GBC patients [3]. Meanwhile, various phase 2 trials suggest that combination of Gem with irinotecan [4], capecitabine [5,6], carboplatin [7], or oxaliplatin [8,9] also exerts antitumor activity in BTC patients. Collectively, Gem-based chemotherapies present 20-30% of the objective response rate (ORR) and less than 1 year of the median overall survival. The modest ORR of Gem-based chemotherapies demonstrates the need for finding biomarkers for sensitivity to Gem to screen the patients who can benefit from these therapeutic modalities and to improve the therapy.
Gem is one of the most widely used agents with proven efficacy in non-small-cell lung cancer (NSCLC), breast cancer, pancreatic cancer, and bladder cancer among others. Its molecular targets are ribonucleotide reductase M1 (RRM1) and elongating DNA [10,11]. The highly expression of RRM1 has been associated with the resistance to Gem in various types of cancer, including GBC [12,13]. Furthermore, the expression of excision cross-complementing gene-1 (ERCC1), human equilibrated nucleoside transporter 1 (hENT1), and ribonucleotide reductase subunit M2 (RRM2) is also linked to the sensitivity to Gem in BTC patients [13]. Moreover, NF-κB signaling is proposed to be induced by Gem treatment, therefore NF-κB inhibitors combination with Gem show a synergistic inhibitory effect on proliferation of GBC cells [14-16]. In addition, inhibitor of MEK [17], IGF1R [18] and HDAC [19] potentiates the antitumor activity of Gem to GBC cells, respectively, in primary xenografts of GBC or BTC cell lines, suggesting that activation of some bypass pathways confers cancer cell resistance to Gem. Although several genes are related to the sensitivity of GBC cells to Gem, it is of great interest to investigate systematically the potential biomarkers for Gem sensitivity in the GBC cell lines.
In this work, two GBC cell lines with dramatically different sensitivities to Gem were applied to DNA microarray analysis. The differentially expressed genes were subjected to Ingenuity Pathway Analysis (IPA). IPA results were validated by qPCR or immunoblotting.
Materials and methods
Cell culture
The human gallbladder carcinoma cell lines, GBC-SD and SGC-996, were used in this work. GBC-SD cell line was purchased from China Center for Type Culture Collection, while SGC-996 cell line is a generous gift from Dr. Yao-Qing Yang, Tumor Cell Biology Research Institute of Tongji University, China. These two cell lines were maintained in RPMI 1640 or DMEM medium (Gibco) supplemented with 10% FBS (Hyclone), penicillin (100 IU/ml) and Streptomycin (100 μg/ml) (Life Technologies) in a humidified atmosphere containing 5% CO2 at 37°C. Cells in the exponential growth phase were used for all the experiments.
Determination of IC50 dose by MTS assay
GBC-SD and SGC-996 cells (4×10³) were grown in 100 μl of RPMI 1640 or DMEM medium containing serum per well in a 96-well plate. After 24 h, the cells were treated with Gem (0, 2, 6.3, 20, 63, 200, 630, 2000 nmol/L, respectively) for 72 h. Every treatment was triplicate in the same experiment. Then 20 μl of MTS (CellTiter 96 AQueous One Solution Reagent; Promega) was added to each well for 1 to 4 h at 37°C. After incubation, the absorbance was read at a wavelength of 490 nm according to the manufacturer’s protocol. The IC50 calculation was performed with GraphPad Prism 5.0 software.
Microarray analysis
GBC-SD and SGC-996 cells (8×10⁴) were grown in 2 ml of RPMI 1640 or DMEM medium containing serum per well in a 6-well plate. All the samples were homogenized with 1 ml Trizol (Invitrogen, Life Technologies) and total RNAs were extracted according to the manufacturer’s instruction.
500 ng total RNA was used to synthesize double-strand cDNA and in vitro transcribed to cRNA, purified 10 μg cRNA was used to synthesize 2nd-cycle cDNA and then hydrolyzed by RNase H and purified. Above steps were performed with Ambion WT Expression Kit. 5.5 μg 2nd-cycle cDNA was fragmented and the single-stranded cDNA was labeled with GeneChip2 WT Terminal Labeling Kit and Controls Kit (Affymetrix, PN 702880). About 700 ng fragmented and labeled single-stranded cDNA were hybridized to an Affymetrix GeneChip Human Gene 1.0 ST array, which was washed and stained with GeneChip2 Hybridization, Wash and Stain kit (Affymetrix). Functional annotation was performed to the differential expression genes with Ingenuity Pathway Analysis (IPA) online software.
Quantitative real-time PCR (qPCR)
Total RNA above isolated was synthesized to cDNA using PrimeScript RT reagent kit with gDNA Eraser (Takara, RR074A) for RT-PCR with mixture of oligo-dT and Random Primer (9 mer). The primers used for qPCR validation were list in Supplementary Table 1. Real-time qPCR was performed on CFX-96 (Bio-lab), with endogenous control hActb. Gene expression was calculated relative to expression of hActb endogenous control and adjusted relative to expression in GBC-SD cells.
Protein isolation and western blotting
Cell pellets were resuspended in 1×SDS loading buffer (1 mmol/L Na3VO4, 10 mmol/L NaF, 1 mmol/L PMSF) containing protease inhibitors. Lysates (20 μg each lane) were applied to SDS-PAGE. Immunoblotting of Abs specific for GAPDH (Abmart, 080922), AKT (Santa Cruz, sc-8312), p-AKT (Santa Cruz, SC-7985-R, pS473), ERK (Abclonal, A0228) and p-ERK (Cell signaling, #9106S, pT202/204) were detected using HRP-conjugated anti-mouse (Promega) or anti-rabbit (Promega) and visualized by chemiluminescence detection system (Millipore, WBKLS0500).
Statistical analysis
R2 values were calculated using Pearson’s correlation coefficient. The significant difference was calculated using Student’s t-test.
Results
GBC-SD and SGC-996 cells are sensitive and resistant to Gem, respectively
Two GBC cell lines, GBC-SD and SGC-996, were treated with 7 different concentrations of Gem as indicated for 72 h. Then the cell viability was determined by MTS assay (Figure 1) and IC50s of these two cell lines were calculated. IC50 doses of GBC-SD and SGC-996 cells to Gem at 72 h were 0.0052 (R2=0.986) and 4.4 (R2=0.997) μmol/L, respectively. According to the data from DTP data search (http://dtp.nci.nih.gov/dtpstandard/dwindex/index.jsp), the average IC50 dose for NCI-60 cell panel to Gem is approximately 100 nmol/L. Therefore, GBC-SD is hypersensitive to Gem, while SGC-996 is resistant to Gem.
Figure 1.
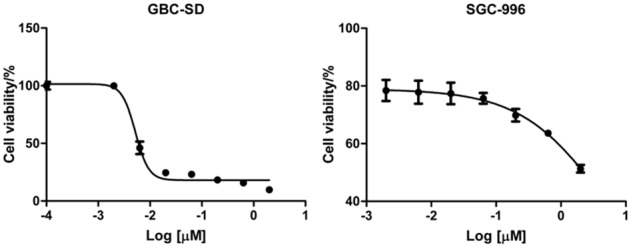
Two GBC cell lines display dramatically different sensitivities to Gem. GBC-SD and SGC-996 cells were treated with 7 distinct doses of Gem or left untreated. 72 h later, cell viability was examined by MTS assay.
Differential gene expression profile analysis
To figure out the biomarkers that determine the different sensitivities to Gem, the 2 GBC cell lines were applied to microarray analysis. The raw data of microarray showed that there was dramatically difference in basal expression between GBC-SD and SGC-996 cells. 894 genes were up-regulated by 2-fold and 1387 genes were down-regulated by 2-fold in SGC-996 compared to GBC-SD (data not shown). There was 633 genes whose expression difference was higher than 4-fold between GBC-SD and SGC-996 cells was (274 highly expressed and 359 lower expressed in SGC-996 compared to GBC-SD). The most markedly expression-altered genes were CPS1 (carbamoyl-phosphate synthase 1, mitochondrial) and EDIL3 (EGF-like repeats and discoidin I-like domains 3), the expression of CPS1 was increased by 149-fold and that of EDIL3 was decreased by 155-fold in SGC-996 compared to GBC-SD, respectively. Interestingly, the expression of SOS2, KRAS, PIK3R1 and AKT3 was decreased by 4.2-, 5.0-, 13.4- and 26.3-fold, respectively, in Gemresistant SGC-996 compared to Gem-sensitive GBC-SD cells.
And then, the differentially expressed 633 genes (expression difference was higher than 4-fold) were applied to Ingenuity Pathway Analysis (IPA). IPA results showed that these genes were mainly enriched in protein kinase A signaling, P2Y purinergic receptor signaling, ErbB signaling, p70S6K signaling (Figure 2). Although the PI3K/AKT and RAS/RAF/MEK/ERK signaling was predicted to be inactivated in SGC-996, the downstream p38MAPK (Figure 3A) and p70S6K (Figure 3B) signaling were predicted to be activated in Gem-resistant cell line.
Figure 2.
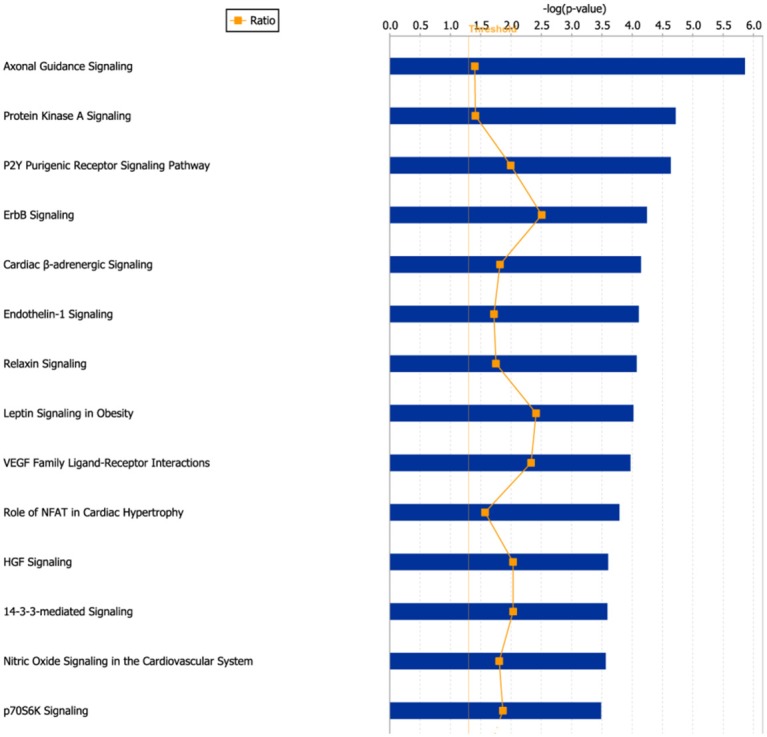
The most significant canonical pathways in which the differentially expressed genes were enriched. 633 differentially expressed genes (expression difference>4-fold) were applied to Ingenuity Pathway analysis (IPA) software, and the most significant canonical pathways were shown.
Figure 3.
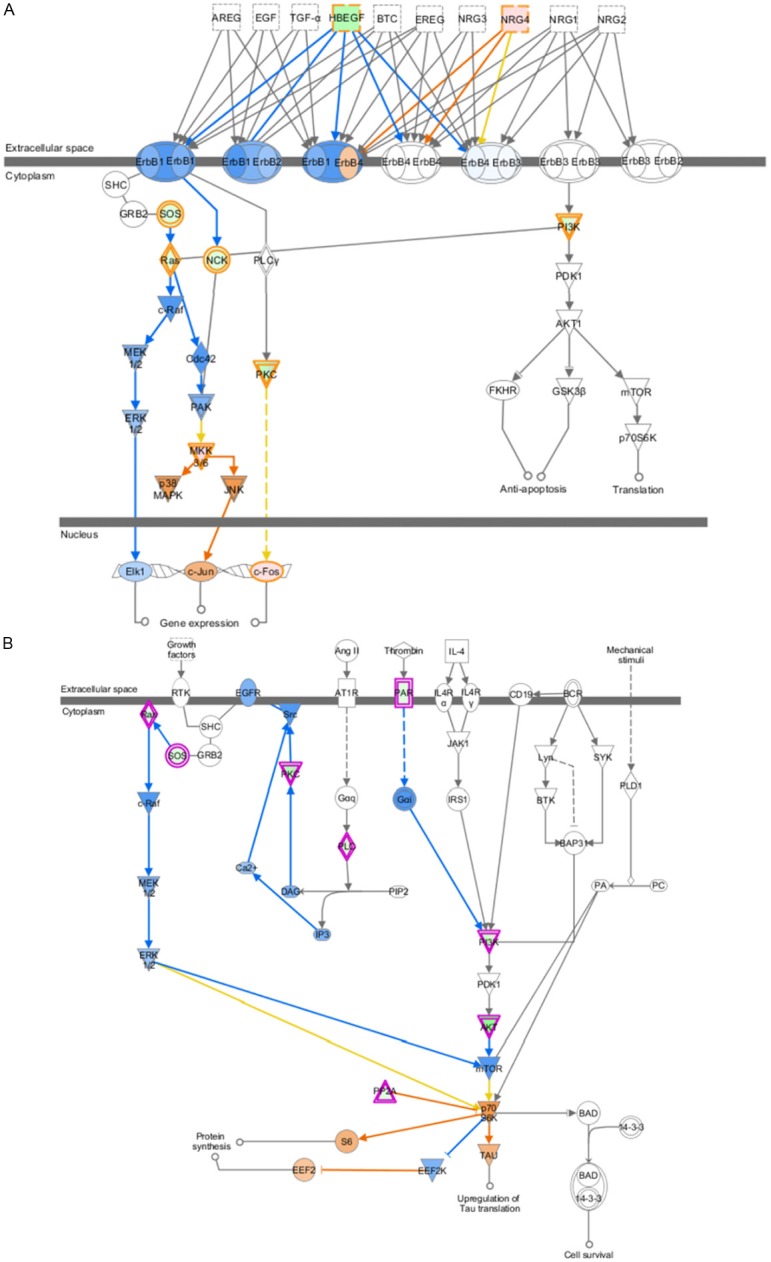
The predicted EGFR signaling and p70S6K signaling in Gem-resistant GBC cell line were shown. The prediction was based on the expression of associated genes in DNA microarray data. The orange circle and arrow represent “induce”, while the blue circle and arrow represent “inhibit”. A: EGFR signaling in Gem-resistant GBC cell line. B: p70S6K signaling in Gem-resistant GBC cell line.
qPCR validation
To validate the DNA microarray data, expression of 16 genes was investigated in SGC-996 and GBC-SD cells by qPCR assay. The relative expression of these 16 genes in SGC-996 was log2 transformed and plotted (Figure 4). The change folds varied to some extent between the microarray data and qPCR data, however, expression trends of most of genes were consistent between two data sets except that of two genes, RRM2 and CCNE2. Microarray data showed that RRM2 and CCNE2 were expressed at a low level in SGC-996, while the qPCR data demonstrated that there was no significant expression difference for these two genes in SGC-996 and GBC-SD cells. Expression trends of 88% (14/16) genes in microarray data were validated by qPCR, suggesting that the microarray data were reliable for further analysis. KRAS, SOS2 and HBEGF were validated to be decreased, while NGR4, MYC, MET and CASP1 were validated to be increased in Gem-resistant SGC-996 cells.
Figure 4.
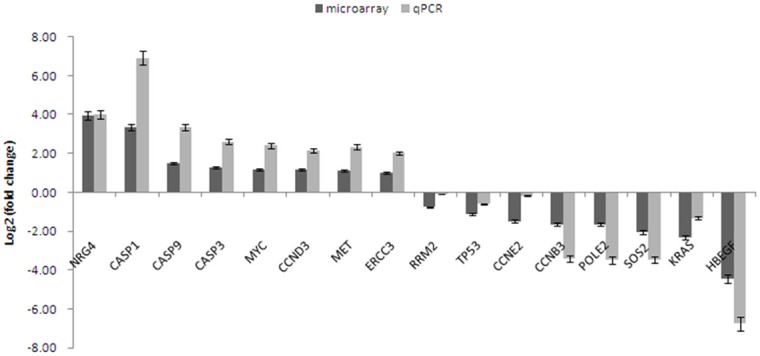
qPCR validation for microarray data. The fold change of expression in Gem-resistant GBC cell line (SGC-996) was calculated relative to Gem-sensitive cell line (GBC-SD), the error bar represents the standard deviation (SD). The fold change was log2 transformed, so the gene whose value of log2 (fold change) was higher than zero, was highly expressed in Gem-resistant GBC cell line.
Western blotting showed that AKT/ERK signaling were inactivated in Gem-resistant cell line
And then the protein samples from GBC-SD and SGC-996 cells were collected for immunoblotting. The phosphorylation of AKT and ERK was dramatically decreased in Gem- resistant SGC-996 cells compared to that in Gem-sensitive GBC-SD cells (Figure 5), suggesting that AKT/ERK signaling was inactivated in SGC-996 cells, just like the results predicted by IPA.
Figure 5.
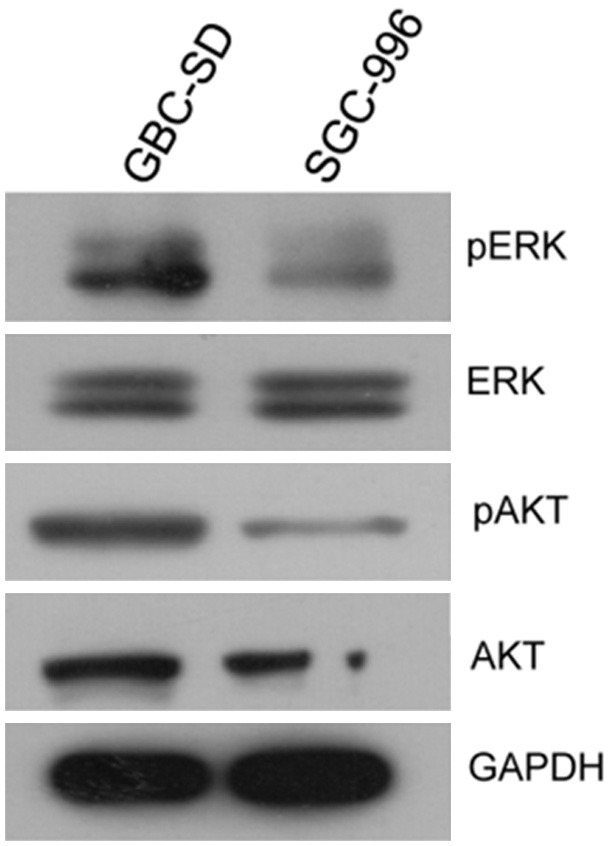
Immunoblotting of AKT/ERK for two GBC cell lines. Total proteins from GBC-SD and SGC-996 cells were subjected to SDS-PAGE and blotted onto PVDF membrane. And then the protein expression of AKT, p-AKT, ERK and p-ERK in the two cell lines was examined.
Discussion
Gem-based chemotherapies are the main therapeutic regimens for patients with unresectable advanced or metastatic GBC. However, the modest ORR and mild benefit on survival demonstrates the need for finding biomarkers for sensitivity to Gem and hence improving the therapy. In present work, two GBC cell lines with vast difference in sensitivity to Gem were subjected to DNA microarray analysis. Dramatic difference in basal expression of two GBC cell lines was found, expression difference of 633 genes was higher than 4-fold between Gem-sensitive and Gem-resistant GBC cell lines. It is a challenge to find out biomarkers for sensitivity to Gem from so many genes. However, it is proposed that oncogenic pathway signatures in various cancers can serve as biomarkers for sensitivity prediction [20-23]. Therefore, the differentially expressed genes were applied to IPA.
IPA results showed that AKT and ERK signaling was probably to be suppressed in Gem-resistant GBC cells (Figure 3A and 3B), mainly based on the lower expression of PIK3R1, KRAS and AKT3. The subsequent immunoblotting validated this prediction (Figure 5). AKT/ERK signaling is well known signaling crucial for cell growth and survival, how do SGC-996 cells grow and survive in this case? One possibility is in that AKT/RAF downstream or branch signaling is activated. As shown in Figure 3A, p38MAPK and JNK, as branch downstream signaling of RAF, were predicted to be activated. Meanwhile, p70S6K signaling, as one of downstream signaling of AKT, was probably upregulated. The activation of these signaling may promote the proliferation and survival of SGC-996, which warrants further validation in more Gem-resistant GBC cell lines. The other possibility is in that expression change of some other genes regulating cell growth and survival contribute to sustaining the normal growth and survival in SGC-996. IPA results showed that 19 upregulated genes (WNT5A, BMP2, CASP1, CD33, CDH5, FOS, L1CAM, TIMP3, and et al.) and 2 downregulated genes (TUSC3, UCHL1) make SGC-996 cells tend to proliferate (Supplementary Figure 1). For instance, CASP1 is proposed to promote tumor growth via production of interleukin-1β [24]. In our qPCR data, CASP1 was increased by 121-fold in SGC-996, compared to that in GBC-SD (Figure 4). Meanwhile, interleukin-1β was increased by 1.7-fold in SGC-996 in our microarray data. Therefore, the highly expression of CASP1 may contribute to the normal growth of SGC-996 cells. In the other hand, regarding KRAS and AKT/ERK signaling are so critical oncogenic gene (pathways), the low expression of KRAS and inactivation of AKT/ERK signaling in SGC-996 might be partial reasons that SGC-996 is less aggressive than GBC-SD cells, which is demonstrated previously [25].
Recent studies suggest that NF-κB signaling can be induced by Gem treatment in GBC cells and hence confer cancer cells resistance to Gem [14-16]. This is an acquired resistance to Gem. Is there some possibility that some GBC cell lines have de novo resistance due to aberrant activation of growth signaling, such as NF-κB signaling? Actually, IPA results showed that NF-κB signaling was predicted to be activated in SGC-996 cells by p38MAPK and IKK signaling (data not shown), which is another point deserving further investigation in more GBC cell lines and tissues. Furthermore, the predicted activation of p70S6K and p38MAPK may also contribute to the resistance of SGC-996 cells to Gem. On the other hand, the expression of RRM2, a biomarker proposed previously for Gem sensitivity, was approximately at the same level in GBC-SD and SGC-996 cells (Figure 4), which was not in line with the Gem sensitivities of these two cell lines. So, RRM2 seems unsuitable to be a biomarker of Gem sensitivity, at least in partial GBC patients. In summary, Gem sensitivity of cancer cells is mainly determined by two aspects: the capability to repair DNA damage and the status of growth signaling. For SGC-996 cells, the aberrant activation of growth signaling is possibly the major reason for Gem resistance.
Taken together, gene expression profiles of two GBC cell lines with dramatically different activities to Gem showed that p70S6K, p38MAPK and NF-κB signaling was probably activated in Gem-resistant GBC cell line, although AKT/ERK signaling in this cell line was suppressed. Our work provides potential pathway signatures for Gem sensitivity of GBC patients.
Disclosure of conflict of interest
We have no conflict of interest to declare.
Supporting Information
References
- 1.Misra S, Chaturvedi A, Misra NC, Sharma ID. Carcinoma of the gallbladder. Lancet Oncol. 2003;4:167–176. doi: 10.1016/s1470-2045(03)01021-0. [DOI] [PubMed] [Google Scholar]
- 2.Wistuba II, Gazdar AF. Gallbladder cancer: lessons from a rare tumour. Nat Rev Cancer. 2004;4:695–706. doi: 10.1038/nrc1429. [DOI] [PubMed] [Google Scholar]
- 3.Valle J, Wasan H, Palmer DH, Cunningham D, Anthoney A, Maraveyas A, Madhusudan S, Iveson T, Hughes S, Pereira SP, Roughton M, Bridgewater J ABC-02 Trial Investigators. Cisplatin plus gemcitabine versus gemcitabine for biliary tract cancer. N Engl J Med. 2010;362:1273–1281. doi: 10.1056/NEJMoa0908721. [DOI] [PubMed] [Google Scholar]
- 4.Chung MJ, Kim YJ, Park JY, Bang S, Song SY, Chung JB, Park SW. Prospective phase II trial of gemcitabine in combination with irinotecan as first-line chemotherapy in patients with advanced biliary tract cancer. Chemotherapy. 2011;57:236–243. doi: 10.1159/000328021. [DOI] [PubMed] [Google Scholar]
- 5.Koeberle D, Saletti P, Borner M, Gerber D, Dietrich D, Caspar CB, Mingrone W, Beretta K, Strasser F, Ruhstaller T, Mora O, Herrmann R Swiss Group for Clinical Cancer Research. Patient-reported outcomes of patients with advanced biliary tract cancers receiving gemcitabine plus capecitabine: a multicenter, phase II trial of the Swiss Group for Clinical Cancer Research. J. Clin. Oncol. 2008;26:3702–3708. doi: 10.1200/JCO.2008.16.5704. [DOI] [PubMed] [Google Scholar]
- 6.Iqbal S, Rankin C, Lenz HJ, Gold PJ, Ahmad SA, El-Khoueiry AB, Messino MJ, Holcombe RF, Blanke CD. A phase II trial of gemcitabine and capecitabine in patients with unresectable or metastatic gallbladder cancer or cholangiocarcinoma: Southwest Oncology Group study S0202. Cancer Chemother Pharmacol. 2011;68:1595–1602. doi: 10.1007/s00280-011-1657-1. [DOI] [PMC free article] [PubMed] [Google Scholar]
- 7.Williams KJ, Picus J, Trinkhaus K, Fournier CC, Suresh R, James JS, Tan BR. Gemcitabine with carboplatin for advanced biliary tract cancers: a phase II single institution study. HPB (Oxford) 2010;12:418–426. doi: 10.1111/j.1477-2574.2010.00197.x. [DOI] [PMC free article] [PubMed] [Google Scholar]
- 8.Sharma A, Dwary AD, Mohanti BK, Deo SV, Pal S, Sreenivas V, Raina V, Shukla NK, Thulkar S, Garg P, Chaudhary SP. Best supportive care compared with chemotherapy for unresectable gall bladder cancer: a randomized controlled study. J. Clin. Oncol. 2010;28:4581–4586. doi: 10.1200/JCO.2010.29.3605. [DOI] [PubMed] [Google Scholar]
- 9.Woo SM, Lee SH, Yoo JW, Yang KY, Seo JG, Park JK, Hwang JH, Lee WJ, Ryu JK, Kim YT, Yoon YB. A Multicenter Phase II Trial of Gemcitabine Plus Oxaliplatin in Unresectable Gallbladder Cancer. Gut Liver. 2013;7:594–598. doi: 10.5009/gnl.2013.7.5.594. [DOI] [PMC free article] [PubMed] [Google Scholar]
- 10.Plunkett W, Huang P, Searcy CE, Gandhi V. Gemcitabine: preclinical pharmacology and mechanisms of action. Semin Oncol. 1996;23:3–15. [PubMed] [Google Scholar]
- 11.Artin E, Wang J, Lohman GJ, Yokoyama K, Yu G, Griffin RG, Bar G, Stubbe J. Insight into the mechanism of inactivation of ribonucleotide reductase by gemcitabine 5’-diphosphate in the presence or absence of reductant. Biochemistry. 2009;48:11622–11629. doi: 10.1021/bi901590q. [DOI] [PMC free article] [PubMed] [Google Scholar]
- 12.Ohtaka K, Kohya N, Sato K, Kitajima Y, Ide T, Mitsuno M, Miyazaki K. Ribonucleotide reductase subunit M1 is a possible chemoresistance marker to gemcitabine in biliary tract carcinoma. Oncol Rep. 2008;20:279–286. [PubMed] [Google Scholar]
- 13.Fisher SB, Fisher KE, Patel SH, Lim MG, Kooby DA, El-Rayes BF, Staley CA 3rd, Adsay NV, Farris AB 3rd, Maithel SK. Excision repair cross-complementing gene-1, ribonucleotide reductase subunit M1, ribonucleotide reductase subunit M2, and human equilibrative nucleoside transporter-1 expression and prognostic value in biliary tract malignancy. Cancer. 2013;119:454–462. doi: 10.1002/cncr.27739. [DOI] [PubMed] [Google Scholar]
- 14.Iwase R, Haruki K, Fujiwara Y, Furukawa K, Shiba H, Uwagawa T, Misawa T, Ohashi T, Yanaga K. Combination chemotherapy of nafamostat mesylate with gemcitabine for gallbladder cancer targeting nuclear factor-kappaB activation. J Surg Res. 2013;184:605–612. doi: 10.1016/j.jss.2013.06.003. [DOI] [PubMed] [Google Scholar]
- 15.Zhang DC, Liu JL, Ding YB, Xia JG, Chen GY. Icariin potentiates the antitumor activity of gemcitabine in gallbladder cancer by suppressing NF-kappaB. Acta Pharmacol Sin. 2013;34:301–308. doi: 10.1038/aps.2012.162. [DOI] [PMC free article] [PubMed] [Google Scholar]
- 16.Yang MH, Lee KT, Yang S, Lee JK, Lee KH, Moon IH, Rhee JC. Guggulsterone enhances antitumor activity of gemcitabine in gallbladder cancer cells through suppression of NF-kappaB. J Cancer Res Clin Oncol. 2012;138:1743–1751. doi: 10.1007/s00432-012-1254-7. [DOI] [PubMed] [Google Scholar]
- 17.Xu J, Knox JJ, Ibrahimov E, Chen E, Serra S, Tsao M, Cao P, Vines D, Green DE, Metran-Nascente C, McNamara MG, Hedley DW. Sequence dependence of MEK inhibitor AZD6244 combined with gemcitabine for the treatment of biliary cancer. Clin Cancer Res. 2013;19:118–127. doi: 10.1158/1078-0432.CCR-12-2557. [DOI] [PubMed] [Google Scholar]
- 18.Wolf S, Lorenz J, Mossner J, Wiedmann M. Treatment of biliary tract cancer with NVP-AEW541: mechanisms of action and resistance. World J Gastroenterol. 2010;16:156–166. doi: 10.3748/wjg.v16.i2.156. [DOI] [PMC free article] [PubMed] [Google Scholar]
- 19.Bluethner T, Niederhagen M, Caca K, Serr F, Witzigmann H, Moebius C, Mossner J, Wiedmann M. Inhibition of histone deacetylase for the treatment of biliary tract cancer: a new effective pharmacological approach. World J Gastroenterol. 2007;13:4761–4770. doi: 10.3748/wjg.v13.i35.4761. [DOI] [PMC free article] [PubMed] [Google Scholar]
- 20.Bild AH, Yao G, Chang JT, Wang Q, Potti A, Chasse D, Joshi MB, Harpole D, Lancaster JM, Berchuck A, Olson JA Jr, Marks JR, Dressman HK, West M, Nevins JR. Oncogenic pathway signatures in human cancers as a guide to targeted therapies. Nature. 2006;439:353–357. doi: 10.1038/nature04296. [DOI] [PubMed] [Google Scholar]
- 21.Ooi CH, Ivanova T, Wu J, Lee M, Tan IB, Tao J, Ward L, Koo JH, Gopalakrishnan V, Zhu Y, Cheng LL, Lee J, Rha SY, Chung HC, Ganesan K, So J, Soo KC, Lim D, Chan WH, Wong WK, Bowtell D, Yeoh KG, Grabsch H, Boussioutas A, Tan P. Oncogenic pathway combinations predict clinical prognosis in gastric cancer. PLoS Genet. 2009;5:e1000676. doi: 10.1371/journal.pgen.1000676. [DOI] [PMC free article] [PubMed] [Google Scholar]
- 22.Chang JT, Carvalho C, Mori S, Bild AH, Gatza ML, Wang Q, Lucas JE, Potti A, Febbo PG, West M, Nevins JR. A genomic strategy to elucidate modules of oncogenic pathway signaling networks. Mol Cell. 2009;34:104–114. doi: 10.1016/j.molcel.2009.02.030. [DOI] [PMC free article] [PubMed] [Google Scholar]
- 23.Brynildsen MP, Collins JJ. Systems biology makes it personal. Mol Cell. 2009;34:137–138. doi: 10.1016/j.molcel.2009.04.004. [DOI] [PubMed] [Google Scholar]
- 24.Bruchard M, Mignot G, Derangere V, Chalmin F, Chevriaux A, Vegran F, Boireau W, Simon B, Ryffel B, Connat JL, Kanellopoulos J, Martin F, Rebe C, Apetoh L, Ghiringhelli F. Chemotherapy-triggered cathepsin B release in myeloid-derived suppressor cells activates the Nlrp3 inflammasome and promotes tumor growth. Nat Med. 2013;19:57–64. doi: 10.1038/nm.2999. [DOI] [PubMed] [Google Scholar]
- 25.Sun W, Fan YZ, Zhang WZ, Ge CY. A pilot histomorphology and hemodynamic of vasculogenic mimicry in gallbladder carcinomas in vivo and in vitro. J Exp Clin Cancer Res. 2011;30:46. doi: 10.1186/1756-9966-30-46. [DOI] [PMC free article] [PubMed] [Google Scholar]
Associated Data
This section collects any data citations, data availability statements, or supplementary materials included in this article.


