

Abstract
Rhabdomyosarcoma (RMS) is the most common soft-tissue sarcoma in children. Although associations between ARMS tumorigenesis and PAX3, PAX7, and FKHR are well recognized, the complete genetic etiology underlying RMS pathogenesis and progression remains unclear. Chromosomal copy number variations (CNVs) and the involved genes may play important roles in the pathogenesis and progression of human malignancies. Using high-resolution array comparative genomic hybridization (aCGH), we examined 20 formalin-fixed, paraffin-embedded (FFPE) RMS tumors to explore the involvement of the relevant chromosomal regions with resident genes in RMS tumorigenesis. In RMS, frequent gains were identified on chromosome regions 12q13.3-q14.1, 12q24.31, 17q25.1, 1q21.1, and 7q11.23, whereas frequent losses were observed on chromosome regions 5q13.2, 14q32.33, and 15q11.2. Amplifications were observed on chromosome regions 9p13.3, 12q13.3-q14.1, 12q15, and 16p13.11, whereas deletions were detected on chromosome regions 1p36.33, 1p13.1, 2q11.1, 5q13.2, 8p23.1, 9p24.3, and 16p11.2. Frequent gains were detected in GLI1, GEFT, OS9, and CDK4 (12q13.3-q14.1), being 60% in embryonal rhabdomyosarcoma (ERMS) and 66.67% in alveolar rhabdomyosarcoma (ARMS), respectively. However, frequent losses were detected in IGHG1, IGHM, IGHG3, and IGHG4 (14q32.33), being 70% in ERMS and 55.56% in and ARMS, respectively. Frequent gains were detected in TYROBP, HCST, LRFN3, and ALKBH6 (19q13.12) in ERMS but not in ARMS. The frequency of TYROBP, HCST, LRFN3, and ALKBH6 gains is significantly different in ERMS versus ARMS (P=0.011). The results suggest that novel TYROBP, HCST, LRFN3, and ALKBH6 genes may play important roles in ERMS. The technique used is a feasible approach for array comparative genomic hybridization analysis in archival tumor samples.
Keywords: Rhabdomyosarcoma, array comparative genomic hybridization, chromosomal imbalance
Introduction
Rhabdomyosarcoma (RMS) is the most common soft-tissue sarcoma in children, which includes at least three subtypes being alveolar rhabdomyosarcoma (ARMS), embryonal rhabdomyosarcoma (ERMS), and pleomorphic rhabdomyosarcoma (PRMS), respectively. ARMS and ERMS represent 20% and 60% of all RMS cases, respectively, but behave distinctly in clinical manifestations, biological characteristics, and genetic alterations [1]. ARMS frequently exhibits chromosomal translocations, t (2; 13) (q35; q14) or t (1; 13) (p36; q14), that produce fusion genes PAX3-FKHR or PAX7-FKHR, respectively. Evidence shows that additional genetic events occur during ARMS pathogenesis and contribute to the biological and clinical behaviors of this tumor type [2,3]. These additional events potentially function as collaborating factors. Meanwhile, ERMS is characterized by gains in whole or portions of chromosomes 2, 7, 8, 11, 12, 13, 17, 19, and 20, as well as loss of heterozygosity (LOH) on the chromosome 11 short arm (11p15.5) [4,5]. Multiple genetic mechanisms have been proposed in the development and progression of ERMS. PRMS is an uncommon form and usually observed in adults.
An increasing number of evidence shows that gene amplification or deletion is often involved in tumorigenesis and/or tumor progression. Correlations between genomic copy number and gene expression levels have been observed [6,7]. Therefore, detecting genomic imbalances and identifying these genes may be very useful in better understanding the biology of RMS and, on the other hand, these genes may serve as potential biomarkers for diagnosis and/or targets for therapy.
Traditional biological research approaches typically study one gene or several genes at a time. By contrast, high-throughput genomic and bioinformatics scanning approaches allow simultaneous measurement of changes and genome-wide gene regulation under certain biological conditions. Array comparative genomic hybridization (aCGH) enables high-resolution, genome-wide screening of segmental genomic copy number variations (CNVs). This technique can reveal numerous CNVs of unclear significance that are scattered throughout the human genome, allowing the identification of genomic gains and losses in a tumor specimen through a single experiment.
DNA extracted from freshly acquired samples is optimal for aCGH analyses but frozen fresh samples may not always be available due to practical constraints. Thus, optimized protocols are necessary to extract DNA extraction using formalin tissue blocks aimed at detecting DNA alterations in tumors. Several such protocols have been reported for genomic DNA (gDNA) extraction from formalin-fixed, paraffin-embedded (FFPE) samples for aCGH application [8,9]. To the best of our knowledge, aCGH studies on RMS are rarely reported and these studies, if any, have all been conducted in cancer cell lines or frozen tissues. In the present study, we performed high-resolution aCGH using high-quality DNA obtained from 20 FFPE samples aimed to identify CNVs and potential alteration-driving genes suggested in the pathogenesis of RMS.
Materials and methods
Patient samples
Twenty FFPE samples of RMS were selected from the archives in the Departments of Pathology, The First Affiliated Hospital of Shihezi University School of Medicine, Xinjiang, China. This study was approved by the institutional ethics committee at the First Affiliated Hospital of Shihezi University School of Medicine and conducted in accordance with the ethical guidelines of the Declaration of Helsinki. The sample set included 10 ERMS cases, 9 ARMS cases, and 1 PRMS case. The paraffin blocks were confirmed to contain tumor cells (at least 90%) prior to sectioning and DNA/RNA extraction.
Reverse transcription polymerase chain reaction (RT-PCR) analysis
RNA was extracted from tumor tissues, according to manufacturer’s protocols. Expression of the oncogenic fusion gene, PAX3/7-FKHR, in RMS tumors was detected using RT-PCR. The primer sequences for PAX3/7-FKHR fusion transcripts, reaction mixtures and PCR cycling conditions were as the same as previously described [10]. Positive, negative, and blank controls were established and run simultaneously. PCR products were purified and sequenced by the Sangon Company (Shanghai, China).
Isolation of genomic DNA
Isolation of gDNA from tumor tissues was completed using QIAamp DNA FFPE tissue kit following manufacturer protocols (Qiagen, Hilden, Germany).
Roche NimbleGen array comparative genomic hybridization
We used pooled male and female reference gDNA provided by NimbleGen for comparison of male and female patient DNA samples. Digested reference and tumor DNA fragments were labeled with Cy5 and Cy3, respectively. After clean-up, reference and tumor DNA probes were mixed and submitted to Roche NimbleGen for aCGH using the 3 × 720 K probe platform. This platform has genome-wide probe spacing at approximately every 2509 bp. The arrays are available for higher throughput and cost-effective analyses of various genome-wide CNVs. The hybridization protocol was conducted on the NimbleGen hybridization system at 42°C for 48 h, according to the manufacturer’s instructions. Washing, scanning, and data extraction were performed following standard protocols. Each hybridized array was scanned using MS200 scanner (NimbleGen).
Microarray data analysis
Using the NimbleScan software, we converted the image signal into digital signal, and computed the ratio of the Cy3 channel and the Cy5 channel signal value. Based on the ratio value, the segMNT algorithm was used for copy number analysis. In the segMNT analysis, the ratio was normalized by Qspline fit normalization [11].
Then the average log2 ratio for each probe was calculated. Mean log2 ratios of ≥0.25 for all probes in a chromosome region were classified as genomic gains, and mean log2 ratios of ≥1.0 were classified as high-level amplifications. Meanwhile, mean log2 ratios of ≤-0.25 were regarded as losses and mean log2 ratios of ≤-1.0 were regarded as deletions [12].
Statistical analysis
SPSS software package (Version 17, Chicago, IL) was used for statistical analyses. Various parameters of interest were compared using Fisher’s exact test. Differences were regarded as statistically significant when a corresponding two-sided P value was <0.05.
Results
Expression of PAX3-FKHR and PAX7-FKHR transcripts
The transcripts of β-actin gene were amplifiable in all the cases indicating the feasibility to use FFPE tissue blocks in this methodology (Figure 1A). Six cases of ARMS were positive for amplification of a 147-bp fragment from PAX3-FKHR fusion transcripts (Figure 1B), and two were positive for amplification of a 154-bp fragment from PAX7-FKHR fusion transcripts (Figure 1C).
Figure 1.
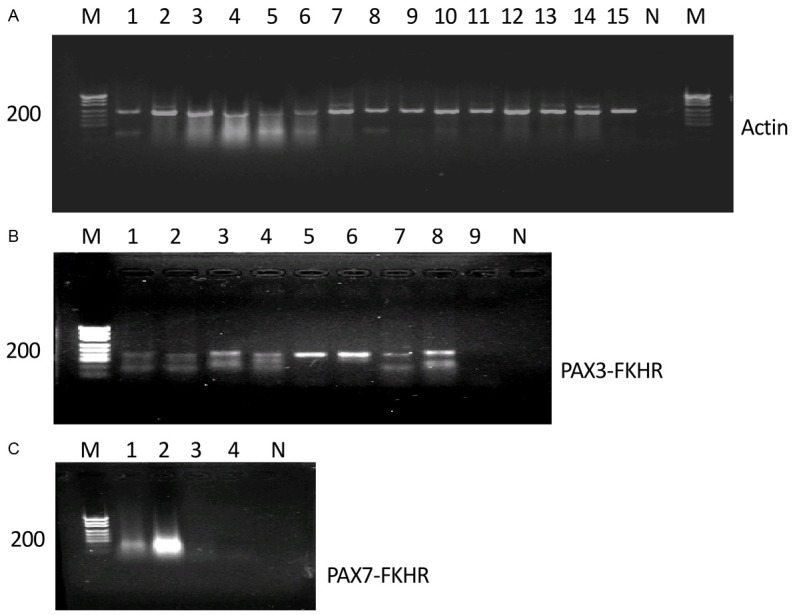
mRNA of actin and PAX3-FKHR/PAX7-FKHR is amplifiable by RT-PCR in FFPE archival tissues. A. Expected size of PCR product for actin is 234 bp and the gel patterns shown are from electrophoretic separation on 2% agarose gel. Lanes 1 to 15 are FFPE tissues from RMS patients. M, DNA marker; N, negative control. B. Lanes 3, 4, 5, 6, 8 are positive samples with PAX3-FKHR fusion transcript (147 bp); M, DNA marker; N, negative sample. C. Lane 2 is a positive sample with PAX7-FKHR (154 bp). Lanes 1 to 4, ARMS tissues; M, DNA marker; N, negative control.
In total, PAX3-FKHR/PAX7-FKHR fusion genes were positive in 8 of 9 cases (88.9%) of ARMS (Table 1). Subsequent sequencing of the PCR products confirmed the presence of the PAX3-FKHR and PAX7-FKHR fusion genes in patients with ARMS. In contrast, PAX3-FKHR/PAX7-FKHR transcripts were negative in all 10 cases of ERMS as well as in 1 case of PRMS, indicating that this marker was specific in the diagnosis of ARMS, which could distinguish ARMS from ERMS and PRMS.
Table 1.
The Expression of PAX3-FKHR/PAX7-FKHR in RMSs
| Subtype | Number of patients | PAX3-FKHR Positive, N (%) | PAX7-FKHR Positive, N (%) | PAX3/7-FKHR Positive, N (%) |
|---|---|---|---|---|
| ARMS | 9 | 6 (66.7) | 2 (22.2) | 8 (88.9) |
| ERMS | 10 | 0 | 0 | 0 |
| PRMS | 1 | 0 | 0 | 0 |
Note: RMS, rhabdomyosarcomas; ARMS, alveolar RMS; ERMS, embryonal RMS; PRMS, pleomorphic RMS.
Recurrent copy number variations in RMS detected by aCGH
The results of aCGH analyses showed that every RMS tumor was accompanied by many chromosomal abnormalities. Figure 2 summarized the copy number abnormalities in 20 RMS tumors. Frequent gains were identified on chromosomal regions 12q13.3 -q14.1, 12q24.31, 17q25.1, 1q21.1, 7q11.23, and 16p11.2, whereas frequent losses were observed on chromosome regions 5q13.2, 14q32.33, and 15q11.2. Amplifications were observed on chromosome regions 9p13.3, 12q13.3-q14.1, 12q15, and 16p13.11, whereas deletions were detected on chromosome regions 1p36.33, 1p13.1, 2q11.1, 5q13.2, 8p23.1, 9p24.3, and 16p11.2.
Figure 2.
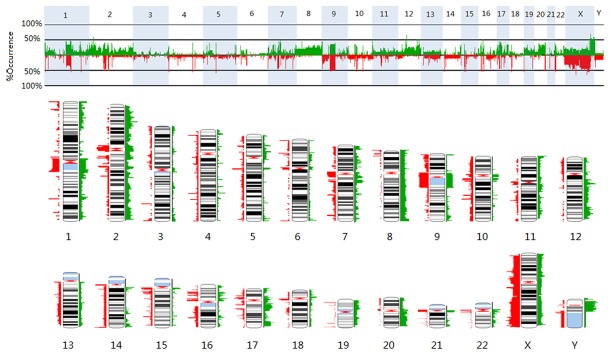
Summary of the copy number abnormalities in 20 RMS tumors. Two different representations show the frequencies of gains (in green) or losses (in red) detected at particular chromosomal locations across the genome. X-axis: chromosomes; Y-axis: frequency changes of DNA copy number (%). The height or width of the colored bands indicates the frequency at which gains or losses were detected across the tumor set. Greater width indicates more tumors that have copy number abnormality.
Using this method, we identified 11 cases with gains at GLI1 gene which encodes a transcription factor essential for mediating Hh-signaling (Figure 3A). We found 5 cases were amplified in these cases. Twelve cases were identified to carry gains at GEFT gene which is one of the specific exchange factors for Rho guanosine triphosphatases (Figure 3B). We found 6 cases were amplified in these cases.
Figure 3.
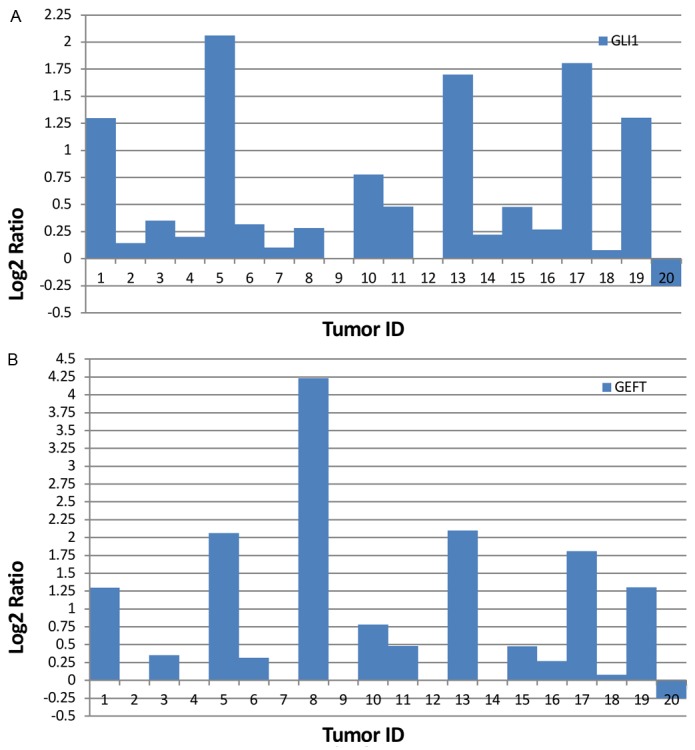
RMS tumors with gains at GLI1 and GEFT genes. A. Bars represent log2 values for GLI1 gene from 20 RMS tumors. B. Bars depict log2 values for GEFT gene from 20 RMS tumors.
Recurrent copy number variations in ERMS and ARMS detected by aCGH
We analyzed CNVs by examining chromosomal changes in ERMS and ARMS tumors. Table 2 listed chromosomal changes with high-frequencies in ERMS and ARMS.
Table 2.
Frequency chromosome imbalance in 10 ERMS and 9 ARMS
| Type | Change | Chromosome region | Frequency |
|---|---|---|---|
| ERMS | Gain | 7q11.23, 8q24.3, 12q13.13, 12q13.3-q14.1, 12q24.31, 19p13.11, 19q13.12 | 60% |
| 1q21.1, 1q32.1, 2p23.3, 2p21, 2q23.3, 2q33.1-q33.2, 7p22.1, 7q11.21, 8p11.23, 8q21.11, 8q22.1, 8q22.3, 8q24.11, 8q24.13, 8q24.21, 11p15.5, 12q13.12, 12q24.12, 17q25.1, 19p13.3, 19p13.2, 19p13.13-p13.11, 19q13.11-q13.12, 20q11.21-q11.23 | 50% | ||
| Loss | 14q32.33 | 70% | |
| 1p36.33, 5q13.2, 10q11.21-11.22, 10q23.2, 14q11.1, 15q11.2, 16p13.11, 16p11.2, 16q22.2, 17q21.31, 22q11.21 | 60% | ||
| 1p36.13, 1p13.1, 1q21.1-q21.2, 1q32.1, 2p11.1, 2q11.1, 2q14.1, 4q31.21-q31.22, 5q13.2, 6p22.1, 8p23.3, 8p23.1, 9p13.1, 9p12-p11.2, 9q12, 10q11.22, 11q14.3, 15q11.2, 15q13.3, 15q25.2, 16p13.11, 16q22.1, 17q12, 17q21.31, 17q23.2, 22q11.21 | 50% | ||
| Amplification | 12q13.3-q14.1 | 30% | |
| Deletion | 1p36.33, 1q32.1, 2q11.1, 2q13, 2q14.1, 6p22.1, 7q35, 9p24.3, 10q23.2, 9p12-p11.2-p11.1, 9q12-q13, 14q11.1, 15q26.3, 16p12.2-p12.1, 16p11.2, 17q21.32, 19p13.3, 22q11.21 | 40% | |
| 1p36.13, 1p13.1, 2q23.3, 4q31.21-q31.22, 8p23.3, 9p13.1, 10p11.21, 15q13.1, 17q12, 19 q13.33 | 30% | ||
| ARMS | Gain | 12q13.3-q14.1 | 66.67% |
| 1p12, 1q21.1, 2p11.2, 2p11.1, 8p23.3, 12q14.3-q15, 14q11.1, 16p13.11, 17p11.2, 17q25.1 | 55.56% | ||
| Loss | 5q13.2, 10q11.22, 11q11, 14q32.33 | 55.56% | |
| Amplification | 12q13.3-q14.1 | 33.33% | |
| Deletion | 2q13, 2q14.1, 5q13.2, 6p22.1, 7q35, 8p23.3, 9p24.3, 9p12, 9q12-q13, 10p11.21, 14q11.1, 15q13.1, 16p12.3 | 33.33% |
As shown in Table 2, frequent gains were observed in chromosome regions of 12q13.3-q14.1 and 1q21.1 in ERMS and ARMS, and frequent amplifications of 12q13.3-q14.1 in these two types of tumors. In ERMS and ARMS, frequent losses were also found in 14q32.33 and 5q13.2 regions, and frequent deletions in regions of 2q14.1, 6p22.1, 7q35, 9p24.3, 9q12-q13, 14q11.1. We then contrasted frequencies of gains and losses at those genes located in these chromosomal regions in ERMS and ARMS (Table 3).
Table 3.
Contrast of frequencies in gains and losses in ERMS and ARMS
| Change | Chromosome region | Frequency (%) | P | Genes | |
|---|---|---|---|---|---|
|
| |||||
| ARMS (n=9) | ERMS (n=10) | ||||
| Gain | 7q11.23 | 1/9 (11.1%) | 6/10 (60%) | 0.057 | LAT2, RFC2, CYLN2, GTF2I |
| 8q24.3 | 2/9 (22.2%) | 6/10 (60%) | 0.170 | PTK2, SLC45A4, GPR20, PTP4A3 | |
| 12q13.3- q14.1 | 6/9 (66.67%) | 6/10 (60%) | 1.0 | GLI1, MARS, DDIT3, DCTN2, KIF5A, DTX3, GEFT, OS9, CENTG1, CDK4, CYP27B1 | |
| 19p13.11 | 1/9 (11.1%) | 6/10 (60%) | 0.057 | MYO9B, NR2F6, MRPL34, DDA1, GTPBP3, PLVAP, BST2, DDX49 | |
| 19q13.12 | 0/9 (0) | 6/10 (60%) | 0.011 | HCST, TYROBP, LRFN3, ALKBH6 | |
| 1q21.1 | 5/9 (55.56%) | 4/10 (40%) | 0.656 | NBPF1, NBPF8, NBPF10, NBPF14, NBPF20, PDE4DIP, NOTCH2NL, PPIAL4 | |
| Loss | 5q13.2 | 5/9 (55.56%) | 6/10 (60%) | 1.0 | SMN1, SMN2 |
| 10q11.21-11.22 | 3/9 (33.3%) | 6/10 (60%) | 0.370 | PTPN20A, PTPN20B, SYT15, FRMPD2, ANXA8L1, ANXA8 | |
| 14q32.33 | 5/9 (55.56%) | 7/10 (70.0%) | 0.650 | IGHM, IGHG1, IGHG3, IGHG4 | |
| 16p13.11 | 3/9 (33.3%) | 6/10 (60%) | 0.370 | NOMO1, NOMO2, NOMO3, RRN3 | |
Frequent gains were detected in GLI1, GEFT, OS9, and CDK4 (12q13.3-q14.1), with a frequency of 60% for ERMS and, of 66.67% for ARMS, respectively. Frequent losses were observed in IGHG1, IGHM, IGHG3, and IGHG4 (14q32.33), with a frequency of 70% for ERMS and, of 55.56% for ARMS, respectively. Frequent gains were also detected in TYROBP, HCST, LRFN3, and ALKBH6 (19q13.12) for ERMS but not for ARMS, with a frequency of 60% for ERMS and, of 0 for ARMS, respectively. The frequency of TYROBP, HCST, LRFN3, and ALKBH6 gains is significantly different in ERMS versus ARMS (P=0.011).
Discussion
Previous studies have shown that tumor occurrence and progression involve numerous genes and processes including the activation of oncogenes and the inactivation of tumor suppressor genes. Despite improved understanding of molecular pathogenesis for RMS in the recent decades, its genetic etiology remains unclear.
Specific cytogenetic abnormalities have been useful in the diagnosis and classification of RMS. RT-PCR-based technologies have been widely used in the diagnosis of a variety of tumors including RMS. There is a clinical advantage in detecting the presence of a fusion gene using FFPE archival materials. In this study, we have examined the feasibility using FFPE archival tissues to test the presence of PAX3/7-FKHR fusion genes. Of the 9 patients with ARMS, we have been able to detect the presence of PAX3-FKHR or PAX7-FKHR fusion genes in 8 patients (88.9%), a frequency higher than that reported in an earlier study [13]. The detection of specific fusion genes has significant implications in differentiating ARMS from other subtypes of RMS.
Chromosomal DNA copy number changes in tumor development have been widely studied. The genes where these changes occur are considered either oncogenes or tumor suppressor genes because DNA copy number changes within genes often result in abnormal expression or variations in function. Identification and analysis of these changes, especially in DNA-coding regions, can contribute to understanding of tumor occurrence, progression, and prognosis. Here we have used a high-resolution oligonucleotide array comparative genomic hybridization chip to provide accurate molecular information on RMS pathogenesis. Only a few studies have reported on the chromosomal changes in RMS by aCGH, the resolution and number of genes covered by these chips vary substantially. The studies have shown frozen tissues and cell lines as materials. In our study, we use FFPE archival tissues as materials to detect chromosomal changes in RMS.
Sandra et al. have shown GLI, CDK4, and MYCN gains in two ARMS cell lines [14]. Myriam et al. have reported CDK4, GLI, and FGFR1 amplification in RMS [15]. Edoardo et al. have indicated that the overexpression of CDK4 and MYCN genes is involved in RMS tumorigenesis [16]. Frederic et al. demonstrate that in ARMS, the MYCN gene is usually overexpressed with 2p24 amplification, whereas multiple genes are overexpressed with 12q13-q14 amplification. Furthermore, 12q13-q14 amplification is associated with significantly worse failure-free and overall survival rates, which are independent of gene fusion status [17]. Daniel et al. have shown that the frequencies of many specific amplifications and gains, such as those in MYCN and CDK4, vary significantly between fusion gene-positive ARMS and fusion gene-negative ARMS and ERMS, CDK4 amplification is present in 24% of fusion gene-positive ARMS but in only 4% of fusion gene-negative ARMS and in none ERMS [18]. In this study, however, we have found similar frequencies of CDK4 amplifications for ERMS (30%) and for ARMS (33.3%), respectively, which are not statistically significant. The possible reason for this difference is the different probe resolution, the sample quantity and races.
Using an aCGH platform to examine a specific subset of 26 frozen ERMS samples, Vera et al. have found that these tumors share a common genomic program with a high frequency of gains at 12q13.3 (about 50%) in ERMS [19]. In this study, we have observed slightly higher frequencies of gains at 12q13.3, being 60% in ERMS and 66.67% in ARMS, respectively. In addition, Vera et al. have also found the inactivation of the master regulators of p53 and Rb pathways, CDKN2A/B, as well as FGFR4, Ras, and Hh signaling activation in ERMS [19]. In numerous previous studies, the 12q13.3-q14.1 region has been mentioned to have amplifications of many genes, including GLI1, PIP5K2C, GEFT, OS9, CDK4, among others. MYCN and FGFR1 have the most frequently observed gene amplifications or gains. Similarly, we have also observed amplifications and high-frequencies of changes in genes within this region.
The co-amplifications of CDK4 gene with MDM2 and GLI have been reported in human sarcomas, including RMS, Ewing’s sarcoma, osteosarcoma, and undifferentiated sarcoma [20]. These findings indicate the involvement of these important genes in the tumorigenesis of RMS, which implies potential co-effects among these genes in RMS. Several synthetic GLI1 antagonists have become available, and initial clinical trials in basal cell carcinoma and medulloblastoma have been shown to be efficacious and safe [21,22]. Recent studies have focused on GLI1 function in RMS. For example, Ulrica et al. have shown variable upregulation patterns of certain Hh signaling genes, including HHIP, PTCH1, SFRP1 and GLI1 [23]. Moreover, treatment with small molecules of Hh signaling inhibitors impedes cell proliferation in ERMS cell lines, which suggests GLI1 to be an effective therapeutic target for ERMS [23]. Betulinic acid induces apoptosis and inhibits Hh signaling in RMS, which suggests the usefulness of this compound in a multimodal therapy for this highly aggressive pediatric tumor [24]. Zibat et al. have reported that marker genes of active Hh signaling, such as PTCH1, GLI1, GLI3, and Myf5, are expressed at higher levels in ERMS and fusion gene-negative ARMS than in fusion gene-positive ARMS. GLI1 inhibitor amplification in RMS is implied [25]. Therefore, targeted inhibition of Hh signaling may be a strategy in the development of future treatment and prevention of RMS.
Rho guanine nucleotide exchange factors (GEFs) exhibit increased abundance or activity in human tumors, and potentially affect cancer progression [26,27]. GEFT was identified as a novel Rho-family-specific GEF, which is highly expressed in the brain, heart, and skeletal muscles [28]. Vera et al. demonstrate that GEFT is amplified in ERMS [19], in keeping with our results as shown in RMS. Although GEFT function in tumors is unknown, GEFT is frequently amplified in RMS suggesting the involvement of GEFT in tumor occurrence and progression.
The frequency of gains in 19q13.12 region is 60% in ERMS, but no gains in this region have been observed in ARMS. This region contains the HCST, TYROBP, LRFN3, and ALKBH6 genes. Frequent gains were also detected in TYROBP, HCST, LRFN3, and ALKBH6 (19q13.12) for ERMS but not for ARMS, with a frequency of 60% for ERMS and, of 0 for ARMS, respectively. The frequency of TYROBP, HCST, LRFN3, and ALKBH6 gains is significantly different in ERMS versus ARMS (P=0.011). Previous studies have reported that the TYROBP gene was highly expressed in brain astrocytomas and glioblastomas [29,30]. Correlations of HCST, LRFN3, and ALKBH6 genes with tumors have not been reported possibly due to recent discoveries of these genes which may be potentially important in research into ERMS.
In summary, our studies presented have demonstrated that PAX3-FKHR/PAX7-FKHR chimeric mRNA transcripts represent a sensitive and specific molecular marker for the diagnosis and classification of RMS. Whole-genome copy number profiles provide information for pathogenesis and prognosis for patients with RMS. This technology serves as a feasible approach for array comparative genomic hybridization analysis using archival tumor samples. Our data suggest that genomic gains and losses involve histopathologic characteristics of RMS subtypes, and TYROBP, HCST, LRFN3, and ALKBH6 may have important functions in ERMS. In future studies, a larger sample size of RMS cases may help the investigation of critical target genes and molecular markers aimed at improving the treatment and diagnosis of RMS.
Acknowledgements
This work was supported by grants from the National Natural Science Foundation of China (Grant Nos. 81160322 and 81060209).
Disclosure of conflict of interest
None.
References
- 1.Breneman JC, Lyden E, Pappo AS, Link MP, Anderson JR, Parham DM, Qualman SJ, Wharam MD, Donaldson SS, Maurer HM, Meyer WH, Baker KS, Paidas CN, Crist WM. Prognostic factors and clinical outcomes in children and adolescents with metastatic rhabdomyosarcoma-a report from the Intergroup Rhabdomyosarcoma Study IV. J. Clin. Oncol. 2003;21:78–84. doi: 10.1200/JCO.2003.06.129. [DOI] [PubMed] [Google Scholar]
- 2.Gordon AT, Brinkschmidt C, Anderson J, Coleman N, Dockhorn-Dworniczak B, Pritchard-Jones K, Shipley J. A novel and consistent amplicon at 13q31 associated with alveolar rhabdomyosarcoma. Genes Chromosomes Cancer. 2000;28:220–6. [PubMed] [Google Scholar]
- 3.Bridge JA, Liu J, Qualman SJ, Suijkerbuijk R, Wenger G, Zhang J, Wan X, Baker KS, Sorensen P, Barr FG. Genomic gains and losses are similar in genetic and histologic subsets of rhabdomyosarcoma, whereas amplification predominates in embryonal with anaplasia and alveolar subtypes. Genes Chromosomes Cancer. 2002;33:310–21. doi: 10.1002/gcc.10026. [DOI] [PubMed] [Google Scholar]
- 4.Anderson J, Gordon A, Pritchard-Jones K, Shipley J. Genes, chromosomes, and rhabdomyosarcoma. Genes Chromosomes Cancer. 1999;26:275–85. [PubMed] [Google Scholar]
- 5.Bridge JA, Liu J, Weibolt V, Baker KS, Perry D, Kruger R, Qualman S, Barr F, Sorensen P, Triche T, Suijkerbuijk R. Novel genomic imbalances in embryonal rhabdomyosarcoma revealed by comparative genomic hybridization and fluorescence in situ hybridization: an intergroup rhabdomyosarcoma study. Genes Chromosomes Cancer. 2000;27:337–44. doi: 10.1002/(sici)1098-2264(200004)27:4<337::aid-gcc1>3.0.co;2-1. [DOI] [PubMed] [Google Scholar]
- 6.Nigro JM, Misra A, Zhang L, Smirnov I, Colman H, Griffin C, Ozburn N, Chen M, Pan E, Koul D, Yung WK, Feuerstein BG, Aldape KD. Integrated array-comparative genomic hybridization and expression array profiles identify clinically relevant molecular subtypes of glioblastoma. Cancer Res. 2005;65:1678–86. doi: 10.1158/0008-5472.CAN-04-2921. [DOI] [PubMed] [Google Scholar]
- 7.Tsafrir D, Bacolod M, Selvanayagam Z, Tsafrir I, Shia J, Zeng Z, Liu H, Krier C, Stengel RF, Barany F, Gerald WL, Paty PB, Domany E, Notterman DA. Relationship of gene expression and chromosomal abnormalities in colorectal cancer. Cancer Res. 2006;66:2129–37. doi: 10.1158/0008-5472.CAN-05-2569. [DOI] [PubMed] [Google Scholar]
- 8.Paris PL, Albertson DG, Alers JC, Andaya A, Carroll P, Fridlyand J, Jain AN, Kamkar S, Kowbel D, Krijtenburg PJ, Pinkel D, Schröder FH, Vissers KJ, Watson VJ, Wildhagen MF, Collins C, Van Dekken H. High-resolution analysis of paraffin-embedded and formalin-fixed prostate tumors using comparative genomic hybridization to genomic microarrays. Am J Pathol. 2003;162:763–70. doi: 10.1016/S0002-9440(10)63873-4. [DOI] [PMC free article] [PubMed] [Google Scholar]
- 9.Devries S, Nyante S, Korkola J, Segraves R, Nakao K, Moore D, Bae H, Wilhelm M, Hwang S, Waldman F. Array-based comparative genomic hybridization from formalin-fixed, paraffin-embedded breast tumors. J Mol Diagn. 2005;7:65–71. doi: 10.1016/S1525-1578(10)60010-4. [DOI] [PMC free article] [PubMed] [Google Scholar]
- 10.Chang B, Pang LJ, Qi Y, Liu CX, Cao Y, Li HA, Hu WH, Jiang JF, Zhang WJ, Li F. PAX-FKHR Fusion Genes and AChR-γ in Chinese Patients With Rhabdomyosarcoma: Diagnosis Using Formalin-Fixed Archival Tissues. Int J Surg Pathol. 2009;17:6–15. doi: 10.1177/1066896908323922. [DOI] [PubMed] [Google Scholar]
- 11.Workman C, Jensen LJ, Jarmer H, Berka R, Gautier L, Nielser HB, Saxild HH, Nielsen C, Brunak S, Knudsen S. A new non-linear normalization method for reducing variability in DNA microarray experiments. Genome Biol. 2002;3:research0048. doi: 10.1186/gb-2002-3-9-research0048. [DOI] [PMC free article] [PubMed] [Google Scholar]
- 12.Shi ZZ, Liang JW, Zhan T, Wang BS, Lin DC, Liu SG, Hao JJ, Yang H, Zhang Y, Zhan QM, Zhang KT, Wang MR. Genomic alterations with impact on survival in esophageal squamous cell carcinoma identified by array comparative genomic hybridization. Genes Chromosomes Cancer. 2011;50:518–26. doi: 10.1002/gcc.20875. [DOI] [PubMed] [Google Scholar]
- 13.Anderson J, Renshaw J, McManus A, Carter R, Mitchell C, Adams S, Pritchard-Jones K. Amplification of the t (2; 13) and t (1; 13) translocations of alveolar rhabdomyosarcoma in small formalin-fixed biopsies using a modified reverse transcriptase polymerase chain reaction. Am J Pathol. 1997;150:477. [PMC free article] [PubMed] [Google Scholar]
- 14.Rodriguez-Perales S, Martínez-Ramírez A, de Andrés SA, Valle L, Urioste M, Benítez J, Cigudosa JC. Molecular cytogenetic characterization of rhabdomyosarcoma cell lines. Cancer Genet Cytogenet. 2004;148:35–43. doi: 10.1016/s0165-4608(03)00216-4. [DOI] [PubMed] [Google Scholar]
- 15.Goldstein M, Meller I, Issakov J, Orr-Urtreger A. Novel genes implicated in embryonal, alveolar, and pleomorphic rhabdomyosarcoma: a cytogenetic and molecular analysis of primary tumors. Neoplasia. 2006;8:332–43. doi: 10.1593/neo.05829. [DOI] [PMC free article] [PubMed] [Google Scholar]
- 16.Missiaglia E, Selfe J, Hamdi M, Williamson D, Schaaf G, Fang C, Koster J, Summersgill B, Messahel B, Versteeg R, Pritchard-Jones K, Kool M, Shipley J. Genomic imbalances in rhabdomyosarcoma cell lines affect expression of genes frequently altered in primary tumors: an approach to identify candidate genes involved in tumor development. Genes Chromosomes Cancer. 2009;48:455–67. doi: 10.1002/gcc.20655. [DOI] [PubMed] [Google Scholar]
- 17.Barr FG, Duan F, Smith LM, Gustafson D, Pitts M, Hammond S, Gastier-Foster JM. Genomic and clinical analyses of 2p24 and 12q13-q14 amplification in alveolar rhabdomyosarcoma: A report from the Children’s Oncology Group. Genes Chromosomes Cancer. 2009;48:661–72. doi: 10.1002/gcc.20673. [DOI] [PMC free article] [PubMed] [Google Scholar]
- 18.Williamson D, Missiaglia E, de Reyniès A, Pierron G, Thuille B, Palenzuela G, Thway K, Orbach D, Laé M, Fréneaux P, Pritchard-Jones K, Oberlin O, Shipley J, Delattre O. Fusion gene -negative alveolar rhabdomyosarcoma is clinically and molecularly indistinguishable from embryonal rhabdomyosarcoma. J. Clin. Oncol. 2010;28:2151–8. doi: 10.1200/JCO.2009.26.3814. [DOI] [PubMed] [Google Scholar]
- 19.Paulson V, Chandler G, Rakheja D, Galindo RL, Wilson K, Amatruda JF, Cameron S. High-resolution array CGH identifies common mechanisms that drive embryonal rhabdomyosarcoma pathogenesis. Genes Chromosomes Cancer. 2011;50:397–408. doi: 10.1002/gcc.20864. [DOI] [PubMed] [Google Scholar]
- 20.Khatib ZA, Matsushime H, Valentine M, Shapiro DN, Sherr CJ, Look AT. Coamplification of the CDK4 gene with MDM2 and GLI in human sarcomas. Cancer Res. 1993;53:5535–41. [PubMed] [Google Scholar]
- 21.Von Hoff DD, LoRusso PM, Rudin CM, Reddy JC, Yauch RL, Tibes R, Weiss GJ, Borad MJ, Hann CL, Brahmer JR, Mackey HM, Lum BL, Darbonne WC, Marsters JC Jr, de Sauvage FJ, Low JA. Inhibition of the hedgehog pathway in advanced basal-cell carcinoma. N Engl J Med. 2009;361:1164–72. doi: 10.1056/NEJMoa0905360. [DOI] [PubMed] [Google Scholar]
- 22.Rudin CM, Hann CL, Laterra J, Yauch RL, Callahan CA, Fu L, Holcomb T, Stinson J, Gould SE, Coleman B, LoRusso PM, Von Hoff DD, de Sauvage FJ, Low JA. Treatment of medulloblastoma with hedgehog pathway inhibitor GDC-0449. N Engl J Med. 2009;361:1173–8. doi: 10.1056/NEJMoa0902903. [DOI] [PMC free article] [PubMed] [Google Scholar]
- 23.Tostar U, Toftgård R, Zaphiropoulos PG, Shimokawa T. Reduction of human embryonal rhabdomyosarcoma tumor growth by inhibition of the hedgehog signaling pathway. Genes cancer. 2010;1:941–51. doi: 10.1177/1947601910385449. [DOI] [PMC free article] [PubMed] [Google Scholar]
- 24.Eichenmüller M, Hemmerlein B, Von Schweinitz D, Kappler R. Betulinic acid induces apoptosis and inhibits hedgehog signalling in rhabdomyosarcoma. Br J Cancer. 2010;103:43–51. doi: 10.1038/sj.bjc.6605715. [DOI] [PMC free article] [PubMed] [Google Scholar]
- 25.Zibat A, Missiaglia E, Rosenberger A, Pritchard-Jones K, Shipley J, Hahn H, Fulda S. Activation of the hedgehog pathway confers a poor prognosis in embryonal and fusion gene-negative alveolar rhabdomyosarcoma. Oncogene. 2010;29:6323–30. doi: 10.1038/onc.2010.368. [DOI] [PubMed] [Google Scholar]
- 26.Lazer G, Idelchuk Y, Schapira V, Pikarsky E, Katzav S. The haematopoietic specific signal transducer Vav1 is aberrantly expressed in lung cancer and plays a role in tumourigenesis. J Pathol. 2009;219:25–34. doi: 10.1002/path.2579. [DOI] [PubMed] [Google Scholar]
- 27.Citterio C, Menacho-Márquez M, García-Escudero R, Larive RM, Barreiro O, Sánchez-Madrid F, Paramio JM, Bustelo XR. The Rho exchange factors Vav2 and Vav3 control a lung metastasis-specific transcriptional program in breast cancer cells. Sci Signal. 2012;5:ra71. doi: 10.1126/scisignal.2002962. [DOI] [PubMed] [Google Scholar]
- 28.Guo X, Stafford LJ, Bryan B, Xia C, Ma W, Wu X, Liu D, Songyang Z, Liu M. A Rac/Cdc42-specific exchange factor, GEFT, induces cell proliferation, transformation, and migration. J Biol Chem. 2003;278:13207–15. doi: 10.1074/jbc.M208896200. [DOI] [PubMed] [Google Scholar]
- 29.Godard S, Getz G, Delorenzi M, Farmer P, Kobayashi H, Desbaillets I, Nozaki M, Diserens AC, Hamou MF, Dietrich PY, Regli L, Janzer RC, Bucher P, Stupp R, de Tribolet N, Domany E, Hegi ME. Classification of Human Astrocytic Gliomas on the Basis of Gene Expression A Correlated Group of Genes with Angiogenic Activity Emerges As a Strong Predictor of Subtypes. Cancer Res. 2003;63:6613–25. [PubMed] [Google Scholar]
- 30.Shirahata M, Iwao-Koizumi K, Saito S, Ueno N, Oda M, Hashimoto N, Takahashi JA, Kato K. Gene expression-based molecular diagnostic system for malignant gliomas is superior to histological diagnosis. Clin Cancer Res. 2007;13:7341–56. doi: 10.1158/1078-0432.CCR-06-2789. [DOI] [PubMed] [Google Scholar]