

Abstract
Superoxide is widely regarded as the primary reactive oxygen species (ROS) which initiates downstream oxidative stress. Increased oxidative stress contributes, in part, to many disease conditions such as cancer, atherosclerosis, ischemia/reperfusion, diabetes, aging, and neurodegeneration. Manganese superoxide dismutase (MnSOD) catalyzes the dismutation of superoxide into hydrogen peroxide which can then be further detoxified by other antioxidant enzymes. MnSOD is critical in maintaining the normal function of mitochondria, thus its inactivation is thought to lead to compromised mitochondria. Previously, our laboratory observed increased mitochondrial biogenesis in a novel kidney-specific MnSOD knockout mouse. The current study used transient siRNA mediated MnSOD knockdown of normal rat kidney (NRK) cells as the in vitro model, and confirmed functional mitochondrial biogenesis evidenced by increased PGC1α expression, mitochondrial DNA copy numbers and integrity, electron transport chain protein CORE II, mitochondrial mass, oxygen consumption rate, and overall ATP production. Further mechanistic studies using mitoquinone (MitoQ), a mitochondria-targeted antioxidant and L-NAME, a nitric oxide synthase (NOS) inhibitor demonstrated that peroxynitrite (at low micromolar levels) induced mitochondrial biogenesis. These findings provide the first evidence that low levels of peroxynitrite can initiate a protective signaling cascade involving mitochondrial biogenesis which may help to restore mitochondrial function following transient MnSOD inactivation.
Keywords: MnSOD, Peroxynitrite, siRNA, mtDNA, Respiration, Mitochondrial biogenesis
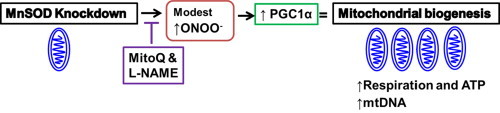
Graphical abstract
Highlights
-
•
MnSOD knockdown in NRK cells results in a transient loss of MnSOD activity, increased nitrotyrosine and mitochondrial superoxide.
-
•
MnSOD knockdown in NRK cells results in a transient induction of mitochondrial biogenesis.
-
•
Nitric oxide synthase inhibition and Mitoquinone blocks mitochondrial biogenesis after MnSOD knockdown.
-
•
Low doses of peroxynitrite induce biogenesis in NRK cells.
Introduction
Mitochondria generate ATP to fuel many thermodynamically unfavorable processes within the cell by oxidative phosphorylation. However, during oxidative phosphorylation electrons can escape the electron transport chain and incompletely reduce (one electron) oxygen to superoxide. MnSOD, a major mitochondrial antioxidant, plays an important role in catalyzing the dismutation of superoxide into oxygen and hydrogen peroxide. Thus, mitochondria are considered a major source of endogenous reactive oxygen species (ROS) [40]. This is evidenced by the lethality of deletion of the MnSOD gene [23,24]. Previously, we observed increased nitrotyrosine formation, mitophagy as well as mitochondrial biogenesis markers in a kidney specific MnSOD knockdown mouse model using Cre-Lox technology [34]. This study suggested that MnSOD knockdown in vivo lead to peroxynitrite formation but also compensatory effects including mitochondrial biogenesis and autophagy which contributed to the lack of renal dysfunction noted in these animals [33]. One purpose of the current study was to further dissect the pathways altered following MnSOD knockdown using an in vitro renal cell model. Specifically, we wanted to examine the integrity of mtDNA and electron transport chain (ETC) function following MnSOD knockdown.
Multiple copies of mtDNA are present in each mitochondrion. The rat mtDNA genome is composed of 16.3 kilobases of circular, double-stranded DNA encoding for 2 ribosomal RNAs, 22 transfer RNAs, and 13 ETC protein subunits. Striking structural similarity exists in mtDNA across mammalian species, making it the natural focus of studies in disease mechanisms yielding easily translatable data [21]. Although mtDNA are packaged into protein–DNA complexes called nucleoids, it remains in close proximity to the ETC located in the inner mitochondrial membrane, which is also the main source of endogenous ROS [17,18]. Additionally, mtDNA utilize limited repair mechanisms compared to nuclear DNA [1,9,30]; and thirdly, replication of cells with damaged mtDNA is not inhibited by cell-cycle check point control mechanisms [8,11]. These factors could potentially lead to accumulation of mutations and the production of dysfunctional ETC proteins, which in turn may produce more ROS which would continue the damaging cycle.
Superoxide is continuously generated by ETC and is regulated during physiological conditions by MnSOD, which is thought to control the balance between superoxide and hydrogen peroxide levels [2,8,14,16]. In addition, superoxide has also been shown to be a key ROS regulating autophagy, specifically mitophagy [7]. Mitochondrial mitophagy and biogenesis are tightly controlled processes involving nuclear and mitochondrial “crosstalk”, and are important regulators of mitochondrial number and health [41]. Mitochondrial biogenesis is a complex process that requires the coordinated expression, assembly and transportation of over one thousand proteins both encoded by the nuclear and mitochondrial genomes [4]. An important regulator of mitochondrial biogenesis is peroxisome proliferator-activated receptor c coactivation 1 (PGC1α). Originally discovered in brown fat cells, PGC1α is a transcription coactivator that responds to various stimuli such as cold, exercise, fasting, as well as oxidative stress [42]. PGC1α plays a crucial role in this process by co-activating the expression and activities of nuclear respiratory factor 1 and 2 (Nrf1, Nrf2), which encode proteins that function as transcription factors activating the expression of key metabolic genes regulating cellular growth and nuclear genes required for respiration, mitochondrial DNA transcription and replication; it also regulates mtDNA transcription via increased expression of mitochondrial transcription factor A (Tfam) [43]. In addition to the putative master regulator of mitochondrial biogenesis, PGC1α has also been identified as the key player in regulating the expression of ROS-detoxifying enzymes through SIRT 3 [22].
The current study demonstrated that knockdown of MnSOD in vitro leads to ROS generation as well as induction of functional mitochondrial biogenesis. In addition, we show for the first time that submicromolar peroxynitrite is capable of stimulating mitochondrial biogenesis.
Materials and methods
MnSOD knockdown in vitro
Normal rat kidney (NRK, ATCC CRL 6509) cells were maintained in a humidified incubator with 5% CO2, 95% air at 37 °C in DMEM containing 5% fetal calf serum, and grown to 70% confluency. MnSOD siRNA (siGENOME siRNA SMARTpool, Dharmacon) was used to knockdown MnSOD in the cells. A nonsense siRNA (siGENOME NON-TARGETing siRNA #2, Dharmacon) was used as a negative control. Briefly, the siRNA was diluted (5–25 nM final concentration) in OptiMem and incubated (25 min, 25 °C) with lipofectamine (Invitrogen) prior to adding to cells containing DMEM only. Cells were incubated with the siRNA solution for 6 h and then placed back in normal media. Successful knockdown of MnSOD was confirmed by measuring MnSOD expression and activity compared to cells treated with nonsense siRNA. The percentage of transfection efficiency was 98% using BLOCK-iT fluorescent Oligo uptake at 24 h post transfection (data not shown).
mtDNA PCR
Amplification of a long genomic target, referred to as Long Range (LR) within mtDNA, was used to assess mtDNA integrity. A primer set designed to target a 14.3 kb mitochondria fragment was used (5'-ATA TTT ATC ACT GCT GAG TCC CGT GG-3' Sense; 5'-AAT TTC GGT TGG GGT GAC CTC GGA G-3' Antisense) [6]. To assess mtDNA content (or copy number), rat NADH dehydrogenase subunit 4 (ND4) (5'-ATT ATT ATT ACC CGA TGA GGG AAC C-3' Sense; 5'-ATT AAG ATG AGG GCA ATT AGC AGT-3' Antisense) and D-LOOP (5'-AAT CTA CCA TCC TCC GTG AAA CC-3' Sense; 5'-GCC CGG AGC GAG AAG AG-3' Antisense) were used because they target significantly smaller fragments of the mtDNA genome. The β-actin gene (5'-TGA AGG TCG GTG TGA ACG GAT TTG GC Sense; 5'-CAT GTA GGC CAT GAG GTC CAC CAC Antisense) [15] was used as the nDNA control for both LR and short fragment PCR. The LR PCR reaction conditions were as follows: 94 °C for 2 min, then 10 cycles of 92 °C for 15 s and 62 °C for 30 s, and 68 °C for 11 min, followed by 30 cycles of 92 °C for 15 s and 62 °C for 30 s, and 68 °C for 12 min with 10 s increment per cycle, and final extension at 68 °C for 7 min. The short fragment PCR reaction conditions were as follows: 94 °C for 1 min, then 35 cycles of 94 °C for 15 s and 64 °C for 30 s, and 72 °C for 30 s, and final extension at 72 °C for 10 min.
Mitochondrial function
Cellular bioenergetics using extracellular flux analysis (Seahorse)
Approximately 7.5k NRK cells were used to seed Seahorse XF96 cell culture microplates (Seahorse Bioscience, Billerica, MA, USA). For respiratory analyses, cells were placed in microplates 24 h post siRNA transfection, and 12 h prior to placing in the analyzer. The cells were washed in buffered DMEM and then changed to assay medium. Oxygen consumption rate (OCR) and extracellular acidification rates (ECAR) measurements were made using a 2 min mix, 4 min read cycling protocol as previously described [42]. The parameters were determined by measuring OCR after the sequential injection of oligomycin (inhibitor of ATP synthase), carbonyl cyanide p-(trifluoromethoxy)phenylhydrazone (FCCP; uncoupler of mitochondrial inner membrane allowing maximum electron flux through the ETC), and antimycin A (inhibitor of complex III) [13]. OCR values were normalized to cell number in each well.
ATP assay
Adenosine 5'-triphosphate (ATP) Bioluminescent Assay Kit (Sigma-aldridge FL-AA) was used in this project following the manufacturer׳s protocol [31]. Measurements were made on a TD 20/20 luminometer (Turner Designs, Sunnyvale, CA, USA). Quantification of ATP was made by interpolation from an ATP standard curve.
MitoTracker green FM
MitoTracker Green FM (Invitrogen M7514) was used to label mitochondria in live cells per manufacturer׳s protocol (MP07510, revised 25-June-2008). Briefly, cells were incubated with MitoTracker Green (0.1 µM for 30 min), and fluorescence was visualized using a Nikon Eclipse E800 microscope with a fluorescein filter using a water immersion objective (60×). All images were captured with equal exposure times. Fluorescent images were quantified for each sample by averaging the mean intensity fluorescence of 5 random cells in three different fields using Nikon Nis Elements software.
Mitochondrial superoxide production
MitoSOX red (Molecular Probes, Eugene, OR) was used to detect mitochondrial superoxide production in the control and treated cells as previously described [29]. This modified cationic dihydroethidium dye is localized to the mitochondria where it is oxidized by superoxide to generate a bright red fluorescence [37]. Briefly, cells were preloaded in the dark with MitoSOX red (5 µM for 10 min), washed and then treated as described. Fluorescence was visualized using a Nikon Eclipse E800 microscope with a rhodamine filter using a water immersion objective (60×). All images were captured with equal exposure times. Fluorescent images were quantified for each sample by averaging the mean intensity fluorescence of 5 random cells in three different fields using Nikon Nis Elements software.
Immunocytochemistry
NRK cells were fixed for 10 min with 4% formalin, washed, and permeabilized with PBS containing 0.1% Triton X-100 and sodium citrate for 3 min on ice [29]. Cells were then blocked with 3% pre-cleared bovine serum albumin in PBS for 45 min, followed by overnight incubation at 4 °C with rabbit anti nitrotyrosine (1: 250) or rabbit anti MnSOD (1:500) (both from EMD Millipore, Billerica, MA). Next cells were washed and incubated with the goat anti-rabbit IgG Alexa-594 antibody (1:1000; Invitrogen, USA) for 30 min in the dark at room temperature. Cells were rinsed with PBS-Tween (0.1%), and nuclear counterstaining was initiated using DAPI (1:100; Invitrogen, USA) for 10 min at RT. Subsequently, cells were washed and coverslipped with ProLong Gold Anti-fade Reagent with DAPI (Invitrogen, USA). Nitrotyrosine staining was evaluated with a Nikon Eclipse 800 microscope (40X Oil). In separate experiments, cells were treated (immediately after siRNA transfection) with the following oxidant scavengers to evaluate their contribution on biogenesis induction: a non-selective nitric oxide synthase (NOS) inhibitor L-NG-Nitroarginine Methyl Ester (L-NAME, 50 µM; Cayman, USA) to inhibit nitric oxide production and mitoquinone (MitoQ) (100 nM) to scavenge mitochondrial superoxide. MitoQ was kindly provided by Professor Robin Smith (University of Otago, Dunedin, New Zealand) and Dr. Michael P. Murphy (Medical Research Council Mitochondrial Biology Unit, Cambridge, United Kingdom).
Peroxynitrite
Peroxynitrite was purchased from Cayman, USA, and the stock solution concentration was determined by absorbance at 302 nm in NaOH (ε302 nm=1670 M−1 cm−1) [3]. Control cells were treated with decomposed peroxynitrite.
Western blot analysis
MnSOD, CORE II, and PGC1α protein expression were analyzed by western blot using a rabbit anti PGC1α (1:1000), mouse anti CORE II (1:1000) (both from Abcam, Cambridge, MA); rabbit anti MnSOD (1:1000) and mouse anti β-actin (1:1000) (Sigma Aldridge, St. Louis, MO) served as a loading control. The intensity of western blot signals was quantified by densitometry using Image analysis software (Alpha Innotech, USA), normalized to, and expressed as ratios to the loading control β-actin.
MnSOD activity
Enzymatic activity of MnSOD was determined in renal cell extracts by the cytochrome c reduction method in the presence of 1 mM KCN to inhibit CuZnSOD activity, as previously described [28].
Statistical analysis
Results are presented as means±standard error of the mean (SEM). Means were obtained from at least three independent experiments. One-way analysis of variance was used to compare the mean values among the control and treated groups, followed by Tukey׳s test to compare differences in mean between two groups at 95% level of confidence using the Prism statistical software. Differences with a p value less than 0.05 were considered statistically significant.
Results and discussion
Confirmation of MnSOD knockdown
MnSOD knockdown was achieved by siRNA transfection using Dharmacon Smartpool technology. Dose response experiments using different MnSOD siRNA concentrations (5, 10, and 25 nM) were performed. MnSOD protein expression was significantly reduced using the 25 nM concentration at 48 h post transfection (Fig. 1A). Therefore, the 25 nM MnSOD siRNA concentration was used in all subsequent experiments. Next, it was important to establish the kinetics of the MnSOD knockdown, thus a time course (24–72 h) experiment was performed following transfection with siRNA. MnSOD expression was reduced significantly after 24 and 48 h of transfection; however, protein levels returned to control levels after 72 h indicating the transient nature of this transfection (Fig. 1B). MnSOD immunocytochemistry was also used to verify decreased MnSOD expression after 48 h transfection. Fig. 1C shows a representative image of the decreased MnSOD expression (red staining) siRNA treated cells when compared to control cells. Cell viability studies were also performed following MnSOD knockdown (25 nM siRNA; 48 h post transfection) which demonstrated no significant increase in cell death (6% versus 7% in control and treated cells, respectively). It was important to show that the reduction of MnSOD protein expression also correlated with reduced enzymatic activity. Fig. 1D shows significant reduction in MnSOD activity at both the 24 and 48 h time point, but returned to basal levels after 72 h post transfection, which corresponded nicely with protein levels. Therefore, this model represents a relatively modest (~50%) reduction in MnSOD activity that is transient in nature. In many disease states, such as renal ischemia reperfusion or transplantation [10,26,27], we also have observed ~50% reduction in activity, but this inactivation occurs for a much longer time period (up to weeks), which may result in different downstream effects. Thus, it is important to note that the current in vitro model does not replicate the more complicated scenarios present in disease models, but was important to study based on a mechanistic perspective.
Fig. 1.
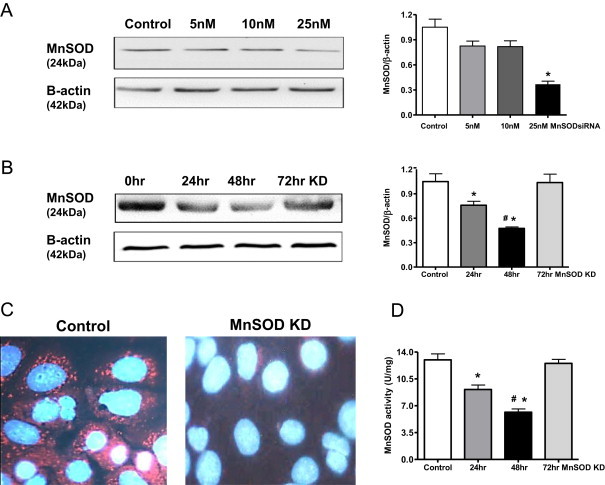
Transient MnSOD knockdown in NRK cells. (A). MnSOD western blot after transfection (48 h) with 0–25 nM MnSOD siRNA. β-Actin was used as a loading control. (B) MnSOD western blot showing time course after transfection with 25 nM MnSOD siRNA. Graphs represent values after densitometric quantification of western blot results. (C) Representative MnSOD immunocytochemistry image showing decreased MnSOD expression after knockdown (KD) (25 nM siRNA; 48 h). Red stains for MnSOD, and blue DAPI stains for nuclei. (D) MnSOD activity decreased at 24 h following MnSOD KD, further decreased at 48 h and recovered to control level at 72 h. Control cells were treated with 25 nM nonsense siRNA. All data shown are mean±SEM (n=7). *p<0.05 compared to control cells; #p<0.05 compared to 24hr treated cells.
MnSOD knockdown Induces superoxide and peroxynitrite formation
Given that the primary role of MnSOD is to reduce superoxide levels, it was expected that mitochondrial superoxide would increase following MnSOD knockdown. Fig. 2A shows representative images of increased MitoSOX Red fluorescence, and indicator of mitochondrial superoxide, following knockdown of MnSOD. Consistent with the earlier time course studies, superoxide was significantly increased at both 24 and 48 h post transfection, but returned to baseline after 72 h. Superoxide reacts with nitric oxide to form peroxynitrite [19] which leads to protein tyrosine nitration, a known oxidative stress marker. Nitrotyrosine was also significantly increased following MnSOD knockdown at both 24 and 48 h post transfection, but returned to baseline after 72 h (Fig. 2B). The fluorescence intensity for both Mitosox Red and Nitrotyrosine was quantified by averaging the mean fluorescence intensity of five random cells in three different fields from seven experiments using Nikon Nis Elements software (Fig. 2C). This was consistent with the MnSOD expression pattern following siRNA transfection (Fig. 1). The rationale for the return of oxidant levels to baseline after 72 h was a bit perplexing, but as shown below we postulate that this is likely due to immense mitochondrial repair due to induction of biogenesis.
Fig. 2.
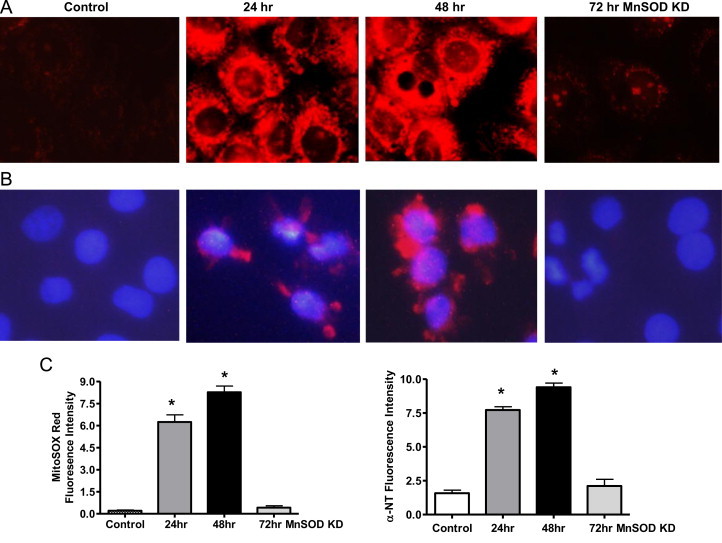
Superoxide and nitrotyrosine (NT) increase following MnSOD knockdown. (A) Representative images showing transient increase of MitoSOX Red (mitochondrial superoxide) fluorescence after siRNA transfection/knockdown (KD). (B) Representative nitrotyrosine immunocytochemistry image showing increased NT expression after MnSOD knockdown. DAPI stains nuclei blue. (C) Graphs showing quantification based on fluorescent intensity, arbitrary units. All data shown are mean±SEM (n=7). *p<0.05 compared to control cells.
MnSOD knockdown increases mitochondrial function and mass
After optimizing and confirming the effective MnSOD knockdown, mitochondrial function was assessed in the NRK cell model by ATP and cellular bioenergetics determination. Surprisingly, ATP generation increased significantly at 24 and 48 h post transfection, and returned to control levels at 72 h (Fig. 3A). Basal oxygen consumption rate (OCR) following MnSOD knockdown was assessed using Seahorse Bioscience XF96 Extracellular Flux Analyzer. The difference between the basal OCR and FCCP induced maximal OCR is referred as the reserve capacity which is defined as the amount of oxygen consumption that is available for cells to use in times of increased ATP demand due to stress [42]. Significant increases in basal OCR as well as reserve capacity were observed in the MnSOD knockdown cells at 48 h post transfection (Fig. 3B). These results suggest that MnSOD knockdown leads to increased mitochondrial respiration. Next, it was important to determine whether this increased mitochondrial function might be due to increased mitochondrial mass, which was measured using MitoTRACKER Green (MTG). Fig. 3C shows a representative MTG image, while panel D shows the quantified intensity levels indicating that MnSOD knockdown (48 h post transfection) resulted in increased mitochondrial mass in NRK cells. MTG is fairly insensitive to ROS induced increased fluorescence [20,35]. Pendergrass et al. showed that hydrogen peroxide (100 μM) treatment only slightly increased MTG fluorescence in cultured cells, which was hypothesized to be related to cellular toxicity and the relatively high concentration of hydrogen peroxide used [35]. Thus, we believe that the increased MTG signals in NRK cells were mainly due to the MnSOD knockdown and a reflection of increased mitochondrial mass.
Fig. 3.
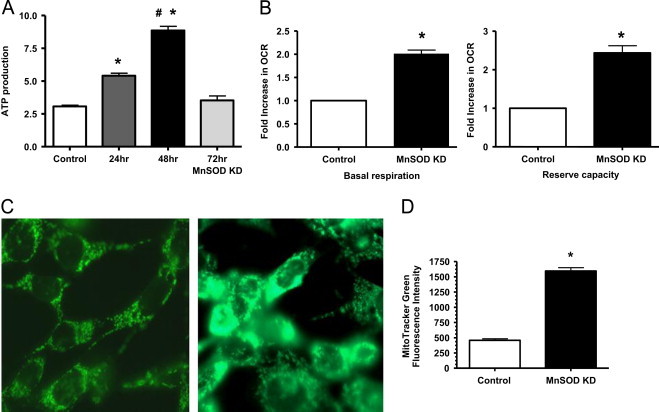
Increased mitochondrial function following MnSOD knockdown. (A) ATP production increased significantly at 24 h, peaked at 48 h, and returned to control levels at 72 h post MnSOD knockdown. (*p<0.05 compared to control; #p<0.05 compared to 24 h treated cells; n=7). (B) Bioenergetics using Seahorse extracellular flux analyzer showing increased basal oxygen consumption rate (OCR) and reserve capacity following MnSOD KD (48 h post-transfection). (*p<0.05 compared to control, n=3) (C) Representative image showing increased MitoTracker Green fluorescence (indicating increased mitochondrial mass) after MnSOD KD (48 h). (D) Graph showing quantification based on fluorescent intensity, arbitrary units. All data shown are mean±SEM (n=7). *p<0.05 compared to control cells.
MnSOD knockdown increases mitochondrial biogenesis
One explaination for the increased mitochondrial respiration and mass observed in Fig. 3 could be due to increased mitochondrial biogenesis. PGC1α expression is frequently used as a marker of mitochondrial biogenesis [41]. Interestingly, PGC1α expression increased following MnSOD knockdown at 24 and 48 h, but returned to control levels after 72 h (Fig. 4A). Consistent with increased mitochondrial mass, the respiratory complex III protein CORE II, was also significantly increased following 24 and 48 h of transfection, but returned to control levels at 72 h. These changes in protein expression of PGC1α and CORE II corresponded to the decreased MnSOD expression without significant changes in the loading control β-actin. Long range (LR) PCR for mtDNA is often used to measure mtDNA integrity, and mtDNA copy numbers are often used as a measure of mitochondrial biogenesis [38]. MtDNA copy numbers were measured by amplifying smaller regions of mtDNA (ND4 and D-Loop) compared to a nuclear encoded gene such as β-actin. MnSOD knockdown resulted in increased mtDNA integrity as well as mtDNA copy numbers at both 24 and 48 h post transfection, and returned to baseline values after 72 h (Fig. 4B). All of these results support the notion that MnSOD knockdown leads to a transient induction of mitochondrial biogenesis in this NRK cell model.
Fig. 4.
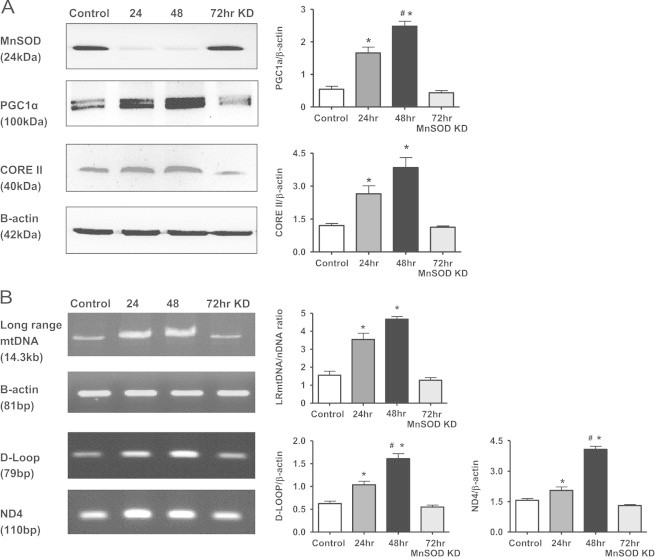
Markers of mitochondrial biogenesis increase following MnSOD knockdown. (A) Western blot analysis showing transiently increased PGC1α and Core II expression following MnSOD KD. β-Actin was used as a loading control. (B) mtDNA assessment using long range (LR) PCR as well as short fragment PCR (D-Loop and ND4). β-Actin was used as a nuclear encoded control in the PCR reactions. Graphs represent values after densitometric quantification of western blot or agarose gel results. All data shown are mean±SEM (n=7). *p<0.05 compared to control cells; #p<0.05 compared to 24hr treated cells.
It is well appreciated that mitochondrial biogenesis works in concert with mitochondrial autophagy (mitophagy) such that damaged mitochondria are cleared by mitophagy and replaced by biogenesis to maintain normal mitochondrial function. Since mitochondrial superoxide has been identified as a crucial inducer of autophagy [7], we would anticipate that mitophagy is likely also induced in this NRK MnSOD knockdown model, but believe these experiments are beyond the scope of this study.
Role of nitric oxide and superoxide in oxidant production following MnSOD knockdown
Since both superoxide and peroxynitrite were increased following knockdown, it was first important to determine the impact that nitric oxide synthase (NOS) inhibition had on superoxide and peroxynitrite/nitrotyrosine formation. Treatment of NRK cells with a non-selective NOS inhibitor L-NAME (50 μM) prevented nitrotyrosine formation at both 24 and 48 h post MnSOD knockdown, and as expected did not alter superoxide levels (Fig. 5 hatched bars). MitoQ is a mitochondria targeted derivative of the antioxidant ubiquinone, and has been shown to reduce superoxide levels [39]. The precise mechanism of MitoQ has not been clearly delineated; it is believed to involve the modulation of mitochondrial ROS formation in mitochondria [5]; although others have suggested that MitoQ (at relatively high levels) leads to increased superoxide due to redox cycling [12]. NRK cells treated with MitoQ (0.1 μM) prevented the increase in mitochondrial superoxide or nitrotryosine following MnSOD knockdown (Fig. 5 stripped bars), suggesting under these conditions MitoQ was acting to decrease superoxide generation.
Fig. 5.
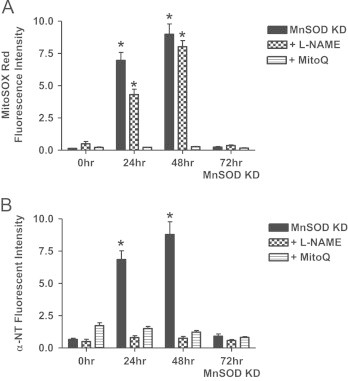
MitoQ and L-NAME block oxidant generation following MnSOD knockdown. (A). MitoQ (0.1 μM), but not L-NAME (50 μM) prevented the mitochondrial superoxide (measured using MitoSOX Red fluorescence) increase following MnSOD knockdown (KD). (B) Both MitoQ (0.1 μM) and L-NAME (50 μM) prevented the increase in nitrotyrosine (NT) levels following MnSOD knockdown. All data shown are mean±SEM (n=7). *p<0.05 compared to control cells.
Increased superoxide and nitric oxide are required for increased biogenesis following MnSOD knockdown
Next, experiments were designed to test whether L-NAME (50 μM) and MitoQ (0.1 μM) could prevent the effects MnSOD knockdown (48 h) had on mitochondrial respiration and biogenesis. Mitochondrial bioenergetics was measured using Seahorse extracellular flux analyzer; Fig. 6A shows that both MitoQ and L-NAME blocked the increase in OCR following MnSOD knockdown without appreciable changes in ECAR (no increase in glycolysis), whereas control cells treated with L-NAME and MitoQ alone had no effect (data not shown). In addition, both L-NAME and MitoQ treatment blocked the increase in mtDNA integrity (LR-PCR) and copy number (ND4) (Fig. 6B) as well as the biogenesis regulator protein PGC1α and ETC protein CORE II (Fig. 6C) after MnSOD knockdown. The reason for the lack of effect of L-NAME on PGC1α induction at 24 h post transfection is likely due to the overall lower level of PGC1α induction observed at this 24 h time point, when compared to induction after 48 h. Nisoli et al. and others found that nitric oxide regulates mitochondrial biogenesis through activation of PGC1α, promoting mitochondrial biogenesis and increased expression of mitochondrial proteins [25,32,36]. Our results, although in agreement with the role of nitric oxide in the increased mitochondrial biogenesis, further identify superoxide as an additional mediator of increased mitochondrial biogenesis following MnSOD knockdown in NRK cells, which suggests that increased peroxynitrite downstream to nitric oxide may also be involved.
Fig. 6.
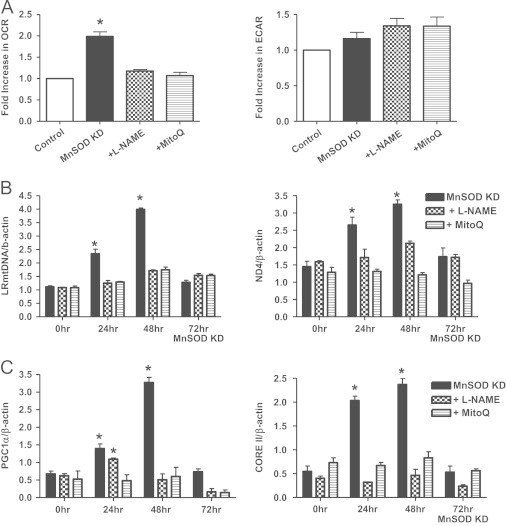
MitoQ and L-NAME block mitochondrial biogenesis following MnSOD knockdown. (A) Both MitoQ (0.1 μM) and L-NAME (50 μM) prevented the increase in OCR using Seahorse extracellular flux analysis following MnSOD knockdown (KD). No significant changes were observed in ECAR values. (B) Both MitoQ (0.1 μM) and L-NAME (50 μM) blocked the increase in LR mtDNA and mtDNA copy number (as described in Fig. 4) following MnSOD KD. (C) MitoQ (0.1 μM) treated cells prevented the increased protein expression of PGC1α or CORE II following MnSOD KD. L-NAME (50 μM) also blocked the increase of both PGC1α and CORE II at 48 h, but only CORE II at 24 h. All data shown are mean±SEM (n=7). *p<0.05 compared to control cells.
Induction of mitochondrial biogenesis by low dose peroxynitrite
These data suggest that both superoxide and nitric oxide are needed to induce mitochondrial biogenesis following MnSOD knockdown in NRK cells. Therefore, new studies were designed to determine what effect exogenous peroxynitrite had on mitochondrial biogenesis. NRK cells were treated with peroxynitrite (0–50 µM; 10 min exposure then replaced with regular media) and harvested after 24 h. NRK cells exposed to peroxynitrite (ONOO−) treatment with low doses (0.5 and 1 µM) increased mtDNA integrity as well as mtDNA copy numbers (ND4 and D-Loop) (Fig. 7). However, treatment with higher peroxynitrite doses (10 and 50 µM), lead to decreased LR PCR products as well as ND4 and D-Loop copy numbers compared to control cells, suggesting increased mtDNA damage (Fig. 7). Likewise, lower doses (0.5 and 1 μM) peroxynitrite treatment increased PGC1α and CORE II expression as well as ATP levels; however, these parameters were significantly reduced with higher peroxynitrite doses (10 and 50 µM) (Fig. 8). These data suggest that peroxynitrite has both deleterious and beneficial effects on mitochondrial biogenesis that is dose dependent, thus in many regards this MnSOD knockdown cell model is an example of “normal stress” versus that of “oxidative stress”. As mentioned earlier, LR-PCR is based on the principle that mtDNA lesions would block or slow down the progression of DNA polymerase, which results in decreased amplified product [38]. Therefore, the reduced LR products observed following higher doses of peroxynitrite indicate possible damage to mtDNA.
Fig. 7.
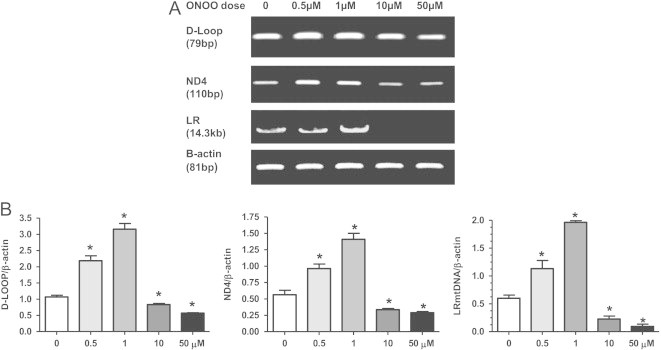
Dose dependent changes in mtDNA integrity and copy numbers following peroxynitrite treatment. (A) Representative PCR gel showing increases in long range (LR) mtDNA product (integrity) and short fragments (D-Loop and ND4; mtDNA copy number) following treatment with peroxynitrite (ONOO) (0–50 µM). Cells were treated with ONOO for 10 min, washed, and harvested 24 h later. β-Actin was used as a nuclear encoded control in the PCR reactions. (B) Graphs represent values after densitometric quantification of agarose gel results. All data shown are mean±SEM (n=7). *p<0.05 compared to control cells.
Fig. 8.
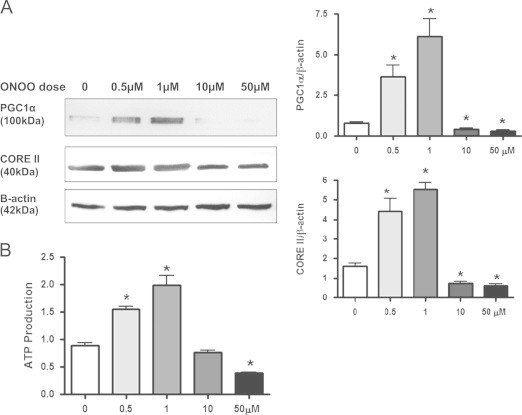
Peroxynitrite alters biogenesis markers and ATP levels. (A) Western blot analysis showing a dose dependent increase in PGC1α and Core II expression following peroxynitrite (ONOO; 0–50 µM) treatment. β-Actin was used as a loading control. Graphs represent values after densitometric quantification of western blot results. (B) Lower doses of peroxynitrite (ONOO; 0.5–1 µM) treatment lead to an increase in ATP production, while higher doses reduced levels. All data shown are mean±SEM (n=7). *p<0.05 compared to control cells.
To our knowledge, this is the first study that shows increased mitochondrial biogenesis following disrupted redox balance caused by inactivation of MnSOD in vitro. The data presented in this paper suggest that increased mitochondrial superoxide, leading to relatively low levels of peroxynitrite, play critical roles in the induction of mitochondrial biogenesis. These findings clearly show a dual role of peroxynitrite mediated regulation of mitochondrial biogenesis that may have important implications in disease. Under certain conditions it may be impractical to prevent peroxynitrite formation entirely; however, if levels could be lowered such that induction of mitochondrial biogenesis could ensue this may provide protection. Of course, further studies using other cellular models as well as in vivo models are warranted to verify the effect of low dose peroxynitrite on biogenesis. In addition, it is important to note that induction of biogenesis of damaged mitochondria would not be advantageous. Hence, instead of relying purely on mRNA or protein markers of mitochondrial biogenesis we propose that it is important to also measure mitochondrial respiration and ATP levels which provide a good measure of functional biogenesis.
In summary, this study shows the immense capacity of mitochondria in maintaining redox balance, as well as the tight regulation between nuclear and mitochondrial control of oxidative phosphorylation to meet the energy demand of the cell. This finding helps strengthen the importance of MnSOD in the health of mitochondria, as well as suggesting that agents designed to keep mitochondrial oxidant levels below a critical threshold may allow mitochondria to recover from transient bouts of ‘mild’ oxidative stress.
Funding
This work was supported by NIH Grant RO1DK078936.
Disclosure
The authors declared no competing interests.
Author contributions
Conceived the experiments: LAMC, AM.
Designed and performed the experiments: AM, NAB, KJK
Analyzed the data: AM, LAMC, NAB.
Wrote the paper: AM, LAMC, NAB.
Footnotes
This is an open-access article distributed under the terms of the Creative Commons Attribution-NonCommercial-ShareAlike License, which permits non-commercial use, distribution, and reproduction in any medium, provided the original author and source are credited.
References
- 1.Anderson C.T., Friedberg E.C. The presence of nuclear and mitochondrial uracil-DNA glycosylase in extracts of human KB cells. Nucleic Acids Res. 1980;8:875–888. [PMC free article] [PubMed] [Google Scholar]
- 2.Andreyev A.Y., Kushnareva Y.E., Starkov A.A. Mitochondrial metabolism of reactive oxygen species. Biochemistry (Moscow) 2005;70:200–214. doi: 10.1007/s10541-005-0102-7. [DOI] [PubMed] [Google Scholar]
- 3.Beckman J.S., Beckman T.W., Chen J., Marshall P.A., Freeman B.A. Apparent hydroxyl radical production by peroxynitrite: implications for endothelial injury from nitric oxide and superoxide. Proc. Natl. Acad. Sci. USA. 1990;87:1620–1624. doi: 10.1073/pnas.87.4.1620. [DOI] [PMC free article] [PubMed] [Google Scholar]
- 4.Calvo S., Jain M., Xie X., Sheth S.A., Chang B., Goldberger O.A., Spinazzola A., Zeviani M., Carr S.A., Mootha V.K. Systematic identification of human mitochondrial disease genes through integrative genomics. Nat. Genet. 2006;38:576–582. doi: 10.1038/ng1776. [DOI] [PubMed] [Google Scholar]
- 5.Chacko B.K., Srivastava A., Johnson M.S., Benavides G.A., Chang M.J., Ye Y., Jhala N., Murphy M.P., Kalyanaraman B., Darley-Usmar V.M. Mitochondria-targeted ubiquinone (MitoQ) decreases ethanol-dependent micro and macro hepatosteatosis. Hepatology. 2011;54:153–163. doi: 10.1002/hep.24377. [DOI] [PMC free article] [PubMed] [Google Scholar]
- 6.Chen H., Hu C.J., He Y.Y., Yang D.I., Xu J., Hsu C.Y. Reduction and restoration of mitochondrial dna content after focal cerebral ischemia/reperfusion. Stroke. 2001;32:2382–2387. doi: 10.1161/hs1001.097099. [DOI] [PubMed] [Google Scholar]
- 7.Chen Y., Azad M.B., Gibson S.B. Superoxide is the major reactive oxygen species regulating autophagy. Cell Death Differ. 2009;16:1040–1052. doi: 10.1038/cdd.2009.49. [DOI] [PubMed] [Google Scholar]
- 8.Clay Montier L.L., Deng J.J., Bai Y. Number matters: control of mammalian mitochondrial DNA copy number. J. Genet. Genomics. 2009;36:125–131. doi: 10.1016/S1673-8527(08)60099-5. [DOI] [PMC free article] [PubMed] [Google Scholar]
- 9.Clayton D.A., Doda J.N., Friedberg E.C. The absence of a pyrimidine dimer repair mechanism in mammalian mitochondria. Proc. Natl. Acad. Sci. USA. 1974;71:2777–2781. doi: 10.1073/pnas.71.7.2777. [DOI] [PMC free article] [PubMed] [Google Scholar]
- 10.Cruthirds D.L., Novak L., Akhi K.M., Sanders P.W., Thompson J.A., MacMillan-Crow L.A. Mitochondrial targets of oxidative stress during renal ischemia/reperfusion. Arch. Biochem. Biophys. 2003;412:27–33. doi: 10.1016/s0003-9861(03)00039-0. [DOI] [PubMed] [Google Scholar]
- 11.Davis A.F., Clayton D.A. In situ localization of mitochondrial DNA replication in intact mammalian cells. J. Cell Biol. 1996;135:883–893. doi: 10.1083/jcb.135.4.883. [DOI] [PMC free article] [PubMed] [Google Scholar]
- 12.Doughan A.K., Dikalov S.I. Mitochondrial redox cycling of mitoquinone leads to superoxide production and cellular apoptosis. Antioxid. Redox Signal. 2007;9:1825–1836. doi: 10.1089/ars.2007.1693. [DOI] [PubMed] [Google Scholar]
- 13.Dranka B.P., Benavides G.A., Diers A.R., Giordano S., Zelickson B.R., Reily C., Zou L., Chatham J.C., Hill B.G., Zhang J., Landar A., Darley-Usmar V.M. Assessing bioenergetic function in response to oxidative stress by metabolic profiling. Free Radic. Biol. Med. 2011;51:1621–1635. doi: 10.1016/j.freeradbiomed.2011.08.005. [DOI] [PMC free article] [PubMed] [Google Scholar]
- 14.Dykens J.A., Sullivan S.G., Stern A. Oxidative reactivity of the tryptophan metabolites 3-hydroxyanthranilate, cinnabarinate, quinolinate and picolinate. Biochem. Pharmacol. 1987;36:211–217. doi: 10.1016/0006-2952(87)90691-5. [DOI] [PubMed] [Google Scholar]
- 15.Evdokimovsky E.V., Ushakova T.E., Kudriavtcev A.A., Gaziev A.I. Alteration of mtDNA copy number, mitochondrial gene expression and extracellular DNA content in mice after irradiation at lethal dose. Radiat. Environ. Biophys. 2011;50:181–188. doi: 10.1007/s00411-010-0329-6. [DOI] [PubMed] [Google Scholar]
- 16.Fridovich I. Superoxide radical and superoxide dismutases. Annu. Rev. Biochem. 1995;64:97–112. doi: 10.1146/annurev.bi.64.070195.000525. [DOI] [PubMed] [Google Scholar]
- 17.Guliaeva N.A., Kuznetsova E.A., Gaziev A.I. [Proteins associated with mitochondrial DNA protect it against the action of X-rays and hydrogen peroxide] Biofizika. 2006;51:692–697. [PubMed] [Google Scholar]
- 18.Hobbs A.E., Srinivasan M., McCaffery J.M., Jensen R.E. Mmm1p, a mitochondrial outer membrane protein, is connected to mitochondrial DNA (mtDNA) nucleoids and required for mtDNA stability. J. Cell Biol. 2001;152:401–410. doi: 10.1083/jcb.152.2.401. [DOI] [PMC free article] [PubMed] [Google Scholar]
- 19.Ischiropoulos H., al-Mehdi A.B. Peroxynitrite-mediated oxidative protein modifications. FEBS Lett. 1995;364:279–282. doi: 10.1016/0014-5793(95)00307-u. [DOI] [PubMed] [Google Scholar]
- 20.Kiritoshi S., Nishikawa T., Sonoda K., Kukidome D., Senokuchi T., Matsuo T., Matsumura T., Tokunaga H., Brownlee M., Araki E. Reactive oxygen species from mitochondria induce cyclooxygenase-2 gene expression in human mesangial cells: potential role in diabetic nephropathy. Diabetes. 2003;52:2570–2577. doi: 10.2337/diabetes.52.10.2570. [DOI] [PubMed] [Google Scholar]
- 21.Kocher T.D., Thomas W.K., Meyer A., Edwards S.V., Paabo S., Villablanca F.X., Wilson A.C. Dynamics of mitochondrial DNA evolution in animals: amplification and sequencing with conserved primers. Proc. Natl. Acad. Sci. USA. 1989;86:6196–6200. doi: 10.1073/pnas.86.16.6196. [DOI] [PMC free article] [PubMed] [Google Scholar]
- 22.Kong X., Wang R., Xue Y., Liu X., Zhang H., Chen Y., Fang F., Chang Y. Sirtuin 3, a new target of PGC-1alpha, plays an important role in the suppression of ROS and mitochondrial biogenesis. PLoS One. 2010;5:e11707. doi: 10.1371/journal.pone.0011707. [DOI] [PMC free article] [PubMed] [Google Scholar]
- 23.Lebovitz R.M., Zhang H., Vogel H., Cartwright J., Jr., Dionne L., Lu N., Huang S., Matzuk M.M. Neurodegeneration, myocardial injury, and perinatal death in mitochondrial superoxide dismutase-deficient mice. Proc. Natl. Acad. Sci. USA. 1996;93:9782–9787. doi: 10.1073/pnas.93.18.9782. [DOI] [PMC free article] [PubMed] [Google Scholar]
- 24.Li Y., Huang T.T., Carlson E.J., Melov S., Ursell P.C., Olson J.L., Noble L.J., Yoshimura M.P., Berger C., Chan P.H., Wallace D.C., Epstein C.J. Dilated cardiomyopathy and neonatal lethality in mutant mice lacking manganese superoxide dismutase. Nat. Genet. 1995;11:376–381. doi: 10.1038/ng1295-376. [DOI] [PubMed] [Google Scholar]
- 25.Lira V.A., Brown D.L., Lira A.K., Kavazis A.N., Soltow Q.A., Zeanah E.H., Criswell D.S. Nitric oxide and AMPK cooperatively regulate PGC-1 in skeletal muscle cells. J. Physiol. 2010;588:3551–3566. doi: 10.1113/jphysiol.2010.194035. [DOI] [PMC free article] [PubMed] [Google Scholar]
- 26.MacMillan-Crow L.A., Crow J.P., Kerby J.D., Beckman J.S., Thompson J.A. Nitration and inactivation of manganese superoxide dismutase in chronic rejection of human renal allografts. Proc. Natl. Acad. Sci. USA. 1996;93:11853–11858. doi: 10.1073/pnas.93.21.11853. [DOI] [PMC free article] [PubMed] [Google Scholar]
- 27.MacMillan-Crow L.A., Cruthirds D.L., Ahki K.M., Sanders P.W., Thompson J.A. Mitochondrial tyrosine nitration precedes chronic allograft nephropathy. Free Radic. Biol. Med. 2001;31:1603–1608. doi: 10.1016/s0891-5849(01)00750-x. [DOI] [PubMed] [Google Scholar]
- 28.McCord J.M., Fridovich I. Superoxide dismutase. An enzymic function for erythrocuprein (hemocuprein) J. Biol. Chem. 1969;244:6049–6055. [PubMed] [Google Scholar]
- 29.Mitchell T., Saba H., Laakman J., Parajuli N., MacMillan-Crow L.A. Role of mitochondrial-derived oxidants in renal tubular cell cold-storage injury. Free Radic. Biol. Med. 2010;49:1273–1282. doi: 10.1016/j.freeradbiomed.2010.07.012. [DOI] [PMC free article] [PubMed] [Google Scholar]
- 30.Miyaki M., Yatagai K., Ono T. Strand breaks of mammalian mitochondrial DNA induced by carcinogens. Chem. Biol. Interact. 1977;17:321–329. doi: 10.1016/0009-2797(77)90095-3. [DOI] [PubMed] [Google Scholar]
- 31.Munusamy S., MacMillan-Crow L.A. Mitochondrial superoxide plays a crucial role in the development of mitochondrial dysfunction during high glucose exposure in rat renal proximal tubular cells. Free Radic. Biol. Med. 2009;46:1149–1157. doi: 10.1016/j.freeradbiomed.2009.01.022. [DOI] [PubMed] [Google Scholar]
- 32.Nisoli E., Clementi E., Paolucci C., Cozzi V., Tonello C., Sciorati C., Bracale R., Valerio A., Francolini M., Moncada S., Carruba M.O. Mitochondrial biogenesis in mammals: the role of endogenous nitric oxide. Science. 2003;299:896–899. doi: 10.1126/science.1079368. [DOI] [PubMed] [Google Scholar]
- 33.Parajuli N., MacMillan-Crow L.A. Role of reduced manganese superoxide dismutase in ischemia-reperfusion injury: a possible trigger for autophagy and mitochondrial biogenesis? Am. J. Physiol. Ren. Physiol. 2013;304:F257–F267. doi: 10.1152/ajprenal.00435.2012. [DOI] [PMC free article] [PubMed] [Google Scholar]
- 34.Parajuli N., Marine A., Simmons S., Saba H., Mitchell T., Shimizu T., Shirasawa T., Macmillan-Crow L.A. Generation and characterization of a novel kidney-specific manganese superoxide dismutase knockout mouse. Free Radic. Biol. Med. 2011;51:406–416. doi: 10.1016/j.freeradbiomed.2011.04.024. [DOI] [PMC free article] [PubMed] [Google Scholar]
- 35.Pendergrass W., Wolf N., Poot M. Efficacy of MitoTracker Green and CMXrosamine to measure changes in mitochondrial membrane potentials in living cells and tissues. Cytometry A. 2004;61:162–169. doi: 10.1002/cyto.a.20033. [DOI] [PubMed] [Google Scholar]
- 36.Reynolds C.M., Suliman H.B., Hollingsworth J.W., Welty-Wolf K.E., Carraway M.S., Piantadosi C.A. Nitric oxide synthase-2 induction optimizes cardiac mitochondrial biogenesis after endotoxemia. Free Radic. Biol. Med. 2009;46:564–572. doi: 10.1016/j.freeradbiomed.2008.11.007. [DOI] [PMC free article] [PubMed] [Google Scholar]
- 37.Robinson K.M., Janes M.S., Pehar M., Monette J.S., Ross M.F., Hagen T.M., Murphy M.P., Beckman J.S. Selective fluorescent imaging of superoxide in vivo using ethidium-based probes. Proc. Natl. Acad. Sci. USA. 2006;103:15038–15043. doi: 10.1073/pnas.0601945103. [DOI] [PMC free article] [PubMed] [Google Scholar]
- 38.Santos J.H., Meyer J.N., Mandavilli B.S., Van H.B. Quantitative PCR-based measurement of nuclear and mitochondrial DNA damage and repair in mammalian cells. Methods Mol. Biol. 2006;314:183–199. doi: 10.1385/1-59259-973-7:183. [DOI] [PubMed] [Google Scholar]
- 39.Smith R.A., Hartley R.C., Murphy M.P. Mitochondria-targeted small molecule therapeutics and probes. Antioxid. Redox Signal. 2011;15:3021–3038. doi: 10.1089/ars.2011.3969. [DOI] [PubMed] [Google Scholar]
- 40.Turrens J.F. Mitochondrial formation of reactive oxygen species. J. Physiol. 2003;552:335–344. doi: 10.1113/jphysiol.2003.049478. [DOI] [PMC free article] [PubMed] [Google Scholar]
- 41.Ventura-Clapier R., Garnier A., Veksler V. Transcriptional control of mitochondrial biogenesis: the central role of PGC-1alpha. Cardiovasc. Res. 2008;79:208–217. doi: 10.1093/cvr/cvn098. [DOI] [PubMed] [Google Scholar]
- 42.Wu M., Neilson A., Swift A.L., Moran R., Tamagnine J., Parslow D., Armistead S., Lemire K., Orrell J., Teich J., Chomicz S., Ferrick D.A. Multiparameter metabolic analysis reveals a close link between attenuated mitochondrial bioenergetic function and enhanced glycolysis dependency in human tumor cells. Am. J. Physiol. Cell Physiol. 2007;292:C125–C136. doi: 10.1152/ajpcell.00247.2006. [DOI] [PubMed] [Google Scholar]
- 43.Wu Z., Puigserver P., Andersson U., Zhang C., Adelmant G., Mootha V., Troy A., Cinti S., Lowell B., Scarpulla R.C., Spiegelman B.M. Mechanisms controlling mitochondrial biogenesis and respiration through the thermogenic coactivator PGC-1. Cell. 1999;98:115–124. doi: 10.1016/S0092-8674(00)80611-X. [DOI] [PubMed] [Google Scholar]