

Abstract
Silica-based nanomaterials are generally considered to be excellent candidates for therapeutic applications particularly related to skeletal metabolism however the current data surrounding the safety of silica based nanomaterials is conflicting. This may be due to differences in size, shape, incorporation of composite materials, surface properties, as well as the presence of contaminants following synthesis. In this study we performed extensive in vitro safety profiling of ~50 nm spherical silica nanoparticles with OH-terminated or Polyethylene Glycol decorated surface, with and without a magnetic core, and synthesized by the Stöber method. Nineteen different cell lines representing all major organ types were used to investigate an in vitro lethal concentration (LC) and results revealed little toxicity in any cell type analyzed. To calculate an in vitro therapeutic index we quantified the effective concentration at 50% response (EC50) for nanoparticle-stimulated mineral deposition activity using primary bone marrow stromal cells (BMSCs). The EC50 for BMSCs was not substantially altered by surface or magnetic core. The calculated Inhibitory concentration 50% (IC50) for pre-osteoclasts was similar to the osteoblastic cells. These results demonstrate the pharmacological potential of certain silica-based nanomaterial formulations for use in treating bone diseases based on a favorable in vitro therapeutic index.
Keywords: Silica nanoparticles, toxicity, therapeutic index, osteoblasts, osteoclasts, bone
1. Introduction
The advent of nanotechnology has provided new opportunities to package and deliver bulk forms of certain elements with the increased surface area associated with the nanoscale potentially enhancing, or producing novel biological effects. Further, the excitement surrounding the applications of nanotechnology to medicine, in part, revolves around the almost unlimited possibilities for varying physicochemical aspects such as size, shape, and surface properties. Other critical parameters in the design of nanomaterials for biomedical application are the type(s) of material and synthesis method (Ha et al., 2013b). Because of the novel properties of materials associated with the nano size careful consideration of toxicity is required before these agents can be applied to biomedicine (Napierska et al., 2010). One particular challenge to the further therapeutic development and use of nanomaterials is the wide range of cell types that a systemically applied agent may encounter. Cells of different lineages/origins have divergent functions and membrane properties, which might alter the cellular response to physicochemical properties of nanomaterials, and therefore a comprehensive understanding of the biological effects of various nanomaterials on differing cell types has only begun to be investigated. The use of nanomaterials as therapeutics, particularly in the case of non-cancer therapeutics, is still in the early stages and defining a rational progression towards in vivo testing has yet to be established.
Dietary silica is defined as a “generally regarded as safe” (GRAS) agent by the US-Federal Drug Administration (FDA) (GRAS Notice Inventory: GRN 000321), although the inhalation of man-made silica or byproducts has long been recognized as a health hazard due to inflammation and tissue fibrosis (Hamilton et al., 2008). Silica as a nanomaterial can be easily and reproducibly controlled in regards to size and shape. Silica is amenable to use in composite materials and can be synthesized as mesoporous particles for drug delivery (Tang et al., 2012). Collectively, silica represents a desirable material for use in nanomedicine however a comprehensive toxicological validation has not been performed for the wide ranging forms of the material. Previous studies investigating the biocompatibility of silica nanomaterials have produced varying responses likely due to physical characteristics such as size distribution, shape, hydrophilicity, porosity, and the possibility of unrecognized negative effects of contaminants such as surfactants, which are all a product of the synthesis method (Napierska et al., 2010). Drug discovery requires the characterization of both efficacy (pharmacology) and safety (toxicity) mediated by on-target as well as off-target effects. We propose that the first step to applying nanomaterials to biomedicine for therapeutic applications is assessment of in vitro toxicology by measuring cell viability to establish the lethal concentration (LC) for on-target and off-target effects and in vitro pharmacology by establishing an effective concentration (EC). The ratio of toxicity to efficacy then allows for the calculation of a therapeutic index (TI), also referred to as “safety margin” (Muller and Milton, 2012). We have recently reported a silica based nanoparticle formulation that leads to enhanced bone mineral density (BMD) in young mice (Beck et al., 2012). Bone homeostasis is regulated by two key cell types; bone forming osteoblasts that derive from the mesenchymal lineage and bone resorbing osteoclasts, which derive from the hematopoietic lineage (Aubin, 1998; Teitelbaum, 2000). Because of the paucity of safety data surrounding nanoparticles as therapeutics we endeavored to create a framework to perform basic in vitro toxicology screening and to define a therapeutic index for our 50nm silica based nanoparticles for bone mineralization in vitro.
We have leveraged multiple facets of the synthesis and material choice in engineering nanoparticles for applications in bone biology. Using the Stöber method (Stober et al., 1968), spherical nanoparticles can be reproducibly synthesized in terms of size and shape as well as spanning a wide range of sizes (nm to μm) and in combination with the resulting high dispersibility in liquids, silica and silica based materials are promising drug development materials (Barik et al., 2008; Rahman et al., 2009). Because of the potential important therapeutic applications of this nanomaterial we have now investigated LC50 (Lethal Concentration50 –the concentration required to kill 50% of a cell population) and LC90 via XTT assay and uptake efficiency of four different variations of spherical silica based nanoparticles in 19 different cell lines representing all major organ types. The four different ~50nm particles were engineered with incorporated rhodamine B for visualization as follows: 1) NP1- an unmodified silica particle with an intrinsic OH surface; 2) NP1-PEG- a silica particle with polyethylene glycol (PEGylated) modified surface; 3) NP1-MNP- a cobalt-ferrite (CoFe2O4) core particle with silica shell; and 4) NP1-MNP-PEG-a metal core particle with PEGylated surface. The EC50 (Effective Concentration 50 – the concentration required to produce 50% of maximum biological activity) and EC90 (the concentration required to produce 90% of maximum biological activity) was determined for two pre-osteoblast cell types; the MC3T3-E1 pre-osteoblast cell line and primary murine bone marrow stromal cells (BMSCs) as well as the monocytic pre-osteoclast cell line RAW264.7. In combination with the cell viability assays an in vitro therapeutic index (TI) was calculated. The EC50 for mineralization was not found to be substantially influenced by nanoparticle surface properties and slightly altered by the presence of a metal core. Collectively, our results suggest a broad range of biocompatibility of 50nm silica nanoparticles and a favorable in vitro therapeutic index indicative of a drug candidate.
2. Materials and Methods
2.1 Silica nanoparticles
Fifty nm fluorescent silica based nanoparticles were synthesized by the Stöber method as previously described (Beck et al., 2012; Ha et al., 2009; Yoon et al., 2005; Yoon et al., 2006). The Stöber method which does not require a surfactant and results in spherical particles with both internal and surface silanol groups (Lee et al., 2011) which in turn improves dispersibility and the ability to further modify the surface with organosilane compounds. The surface silanol groups make them dispersible in polar solvents, such as ethanol and water, and tissue culture media. We have termed this particle NP1. The size and shape of silica nanoparticles were characterized by transmission electron microscope, TEM (H-7600, Hitachi, Tokyo, Japan). To calculate size distribution TEM images were used analyze 500 nanoparticles using ImageJ program version 1.46 (Schneider et al., 2012). Zeta potential was measured using a Zetasizer Nano ZS90 (Malvern Instruments Ltd, Malvern, UK). Chemicals for the synthesis of nanoparticles were obtained from Sigma (St. Louis, MO) and Gelest (Morrisville, PA).
2.2 General method for synthesis of fluorescent silica nanoparticle (NP1)
To enhance our ability to track our particles in cells and tissues the highly fluorescent and photostable dye rhodamine B was incorporated into the silica (Ha et al., 2009). TMSP-RhB (20 mg) and tetraethyl orthosilicate (0.86 g) was dissolved in ethanol. Ammonia (1 ml) and water were added with stirring overnight. The silica nanoparticles were centrifuged, washed three times, and the nanoparticles dispersed in ethanol for subsequent surface-modification or PBS for cell culture. Synthesis of (trimethoxysilylpropyl)-rhodamine B (TMSP-RhB); Rhodamine B (0.5 g (1.04 mmol)), 0.54 g (3.12 mmol) of allyl iodide, and 1.02 g (3.12 mmol) of cesium carbonate were dissolved in dried DMF, and was stirred at 60°C for a day. The mixture was extracted with methylene chloride and washed three times with water. The organic layer was concentrated by rotary evaporator and residual DMF removed by vacuum distillation. Finally, 0.511 g (94.6 %) of the resulting powder was separated by column chromatography with methylene chloride and methanol. 50 mg (0.096 mmol) of the obtained allyl-rhodamine B, 25 mg (0.192 mmol) of trimethoxysilane, and catalytic amounts of Pt/C was dissolved in freshly dried methanol. After reflux for 1 day, the catalyst was removed by Celite filtration. Solvent and excess trimethoxysilane were removed by vacuum and 60.8 mg (98.7%) of TMSP-RhB was obtained as dark-reddish oil.
2.3 Synthesis of fluorescent magnetic core-silica shell nanoparticles (NP1-MNP)
An electron dense metal core is advantageous for contrast imaging such as transmission electron microscopy (TEM) or MRI and consequently a third composition was synthesized incorporating a cobalt-ferrite (CoFe2O4) core with silica shell (termed herein as NP1-MNP), as described previously (Ha et al., 2013a; Yoon et al., 2005). Cobalt ferrite solution (34.7 ml, 20 mg/ml MNP solution in water) was added to polyvinylpyrrolidone solution (PVP; 0.65 ml; Mr 55,000 Da, 25.6 g/L in H2O), and the mixture was stirred for 1 day at room temperature. The PVP-stabilized cobalt ferrite nanoparticles were separated by addition of aqueous acetone (H2O/acetone=1/10, v/v) and centrifugation at 4000 rpm for 10 min. The supernatant solution was removed and the precipitated particles were redispersed in ethanol (10 ml). Multigram-scale preparation of PVP-stabilized cobalt ferrite nanoparticles was easily reproduced in this modified synthetic method. A mixed solution of TEOS/TMSP-RhB molar ratio=0.3/0.04) was injected into the ethanol solution of PVP-stabilized cobalt ferrite. Polymerization initiated by adding ammonia solution (0.86 ml; 30 wt% by NH3) as a catalyst produced cobalt ferrite–silica core-shell nanoparticles containing organic dye. These nanoparticles were dispersed in ethanol and precipitated by ultracentrifugation (18000 rpm, 30 min). This washing process was repeated 3 times, and nanoparticles were finally dispersed in ethanol for the surface-modified step or in water for the cell culture.
2.4 PEGylation of nanoparticles (NP1-PEG and NP1-MNP-PEG)
The addition of PEG to the surface enhances circulation time by avoiding the reticulo-endothelial system often referred to as a “stealth” effect (Jokerst et al., 2011). PEG was attached by generating new Si-O chemical bonding on the surface of NP1 and NP1-MNP using a condensation reaction between the silanol and methoxysilane in PEG and these nanoparticles are referred to as NP1-PEG and NP1-MNP-PEG. Purified NP1 or core-shell nanoparticles NP1-MNP (45 mg) were re-dispersed in absolute ethanol (10 ml) and then treated with 2-[methoxy(polyethyleneoxy)propyl] trimethoxysilane (PEG-Si(OMe)3: 125 mg, 0.02 mmol), CH3O(CH2CH2O)6–9-CH2CH2CH2Si(OCH3)3, at pH 12 (adjusted with NH4OH). The molecular weight of the Polyethylene oxide (PEO) repeating unit is 264–396. The resulting NP1-PEG or NP1-MNP-PEG was washed and centrifuged in ethanol three times and sterile water once.
2.5 Cell culture
The following cells were used in our studies: human cell lines: A549, H441, and HBE (lung), HCT 116 and SW620 (colon), HEK (kidney), HepG2 (liver), HL-60 (blood), Jurkat (T cell), RAMOS (B cell), MCF-7 and MDA-MB-231 (breast), PC-12 (neuron), SKOV3 (Ovarian), HUVEC (endothelial), and murine cell lines: MC3T3-E1 (calvarial osteoblast) and RAW264.7 (monocyte/macrophage) and primary human and mouse BMSC (bone marrow stromal cells). 16-HBE cells were primary cultures transformed with SV40 (Cozens et al., 1994) and provided by Xian Fan (Emory University). Human BMSCs were obtained from volunteers undergoing ileac crest surgery as described in (Beck et al., 2013) under an approved Emory IRB protocol. Mouse BMSCs were obtained by centrifugation of the marrow as described in (Camalier et al., 2012). Mouse and human BMSCs and MC3T3-E1 cells were cultured in α-Modified Eagle’s Medium (α-MEM; Thermo Scientific, Waltham, MA) supplemented with 10% fetal bovine serum (FBS; Atlanta Biologicals, Lawrenceville, GA)(Beck et al., 2012). H441 and Jurkat cells were cultured in RPMI-1640 (Lonza, Walkersville, MD) supplemented with 10% FBS. PC-12 cells were cultured in RPMI-1640 supplemented with 5% FBS and 10% horse serum (ATCC). The other cells, A549, HBE, HCT116, HEK, HepG2, HL-60, MCF-7, MDA-MB-231, RAW264.7, and SW620 were cultured in Dulbecco’s Modified Eagle’s Medium (DMEM, Mediatech Inc.) supplemented with 10% FBS. HUVECs were purchased from Life Sciences (Invitrogen) and cultured in Medium 200PRF (Invitrogen, Carlsbad, CA) with Low Serum Growth Supplement kit (LSGS kit; Invitrogen). All growth medium were supplemented with 1% L-glutamine (Invitrogen), and 1% of penicillin/streptomycin (Thermo Scientific). All cell lines were cultured at 37° C in 5% CO2. Nanoparticles were added from stock solutions of approximately 5mg/ml and directly added to the cell culture medium for the desired final concentration.
2.6 Cell viability assays
Cell viability was measured for all cell types using a commercial XTT (3- (4,5-dimethylthiazol-2-yl)-5-(3-carboxylmethoxyphenyl)-2-(4-sulfonyl)- 2H-tetrazolium) assay according to the manufacturer’s protocol (Promega, Madison, WI). Cells were plated at ~5×10³ cells per well (~50–60% confluent) in 96 well plates. After 24 hours, nanoparticles were added as indicated. After 3 days the cells were analyzed using XTT (20μl in 100 μl) assay reagent on a spectrophotometer (SpectraMAX250, Molecular Devices). The concentration of nanoparticles tested was 0, 10, 30, 100, 300, and 1000 μg/ml.
2.7 Osteoblast differentiation, mineralization and alkaline phosphatase assays
MC3T3-E1 and BMSC cells were plated in 6 or 12 well plates for 3 to 4 days, and differentiation/mineralizing medium (growth medium supplemented with 10 mM β-glycerophosphate and 50μg/ml ascorbic acid) was added as described previously (Beck et al., 1998). Differentiation medium was changed twice per a week. Mineralization was visualized by staining with 40mM Alizarin Red S (Sigma Chemical Co., St. Louis, MO) for 15 minutes. Excess stain was removed by washing with distilled water. Enzyme activity was measured in whole cell lysates using a kit from Sigma as described previously (Beck et al., 1998). The calculations of EC50 and EC90 were performed by Origin software (OriginLab Corporation, Northampton, MA).
2.8 In vitro osteoclastogenesis assays
To induce osteoclast formation RAW264.7 cells were cultured in αMEM supplemented with 10% FBS and treated with 25ng/mL RANKL (R&D Systems, Minneapolis, MN). After 7 days TRAP+ multinucleated cells (≥ 3 nuclei) were quantitated under light microscopy and normalized for size based on number of nuclei as described (Vikulina et al., 2010).
2.9 Internalization efficiency
After incubating cells with nanoparticles for 3 days, excess nanoparticles were removed by washing with 1x PBS (3 times) and the cells examined by fluorescent microscopy (Nikon Eclipse TS100, (Nikon, Melville, NY) G-2E/C LP filter set). Fluorescent pictures were analyzed using ImageJ version 1.46 (Schneider et al., 2012). Internalization was quantified semi-quantitatively on a scale ranging from lowest “+” to highest ‘++++’.
2.10 RNA extraction, cDNA synthesis, and qRT-PCR for genes related to osteoblast differentiation
RNA was extracted using TRIzol reagent following the manufacturer’s protocol (Invitrogen). The RNA concentration was quantified by spectrophotometer (Smart Spec™ Plus, BioRad) and complementary DNA (cDNA) was synthesized using QuantiTech Reverse Transcription kit (Qiagen, Valencia CA). qRT-PCR was performed using EvaGreen qPCR master mix (Biotium, Hayward CA) on an Applied Biosystems-7000 thermocycler. Primers to osteoblast differentiation marker genes (osteopontin, osteocalcin, and Runx2) were designed using qPrimerDepot software (http://mouseprimerdepot.nci.nih.gov/) and sequences are as follows: 18S; F-5′-TTGACGGAAGGGCACCACCAG-3′, R-5′-GCACCACCACCCACGGAATCG-3′, OPN; F-5′-ATTTGCTTTTGCCTGTTTGG-3′, R-5′-TGGCTATAGGATCTGGGTGC-3′, OSC; F-5′-TGACAAAGCCTTCATGTCCA-3′, R-5′-ATAGCTCGTCACAAGCAGGG-3′, Runx2; F-5′-ACACCGTGTCAGCAAAGC-3′, R-5′-GCTCACGTCGCTCATCTTG-3′. Results were calculated using the 2(−ΔΔCt) method (Livak and Schmittgen, 2001).
2.11 Statistical analyses
Statistical significance was determined using GraphPad InStat version 3 for Windows XP (GraphPad Software). Single comparisons were performed using Student’s t-test; multiple comparisons were performed by 1-way ANOVA with Dunn’s Multiple Comparisons post-test. P ≤ 0.05 was considered significant. *P < 0.05; **P < 0.01; ***P < 0.001) compared to unstimulated control and $P<0.05 compared to untreated nanoparticle control.
3. Results
3.1 Synthesis and surface modification of silica nanoparticles
The goal of this study was to investigate the safety profile relating to the potential therapeutic use of 50nm silica based nanoparticles for bone anabolic actions. Nanoparticles were synthesized by Stöber method and the highly fluorescent and photostable dye rhodamine B was incorporated into the silica (Ha et al., 2009). Additional particles were synthesized with a cobalt-ferrite (CoFe2O4) core with silica shell (termed herein as NP1-MNP), as described previously (Ha et al., 2013a; Yoon et al., 2005). PEG was attached and these nanoparticles are referred to as NP1-PEG and NP1-MNP-PEG. The four nanoparticles were characterized by TEM and zeta potential. The spherical shape and approximate 50nm size were confirmed using transmission electron microscopy (TEM) (Figure 1A,B,C,D). The successful addition of PEG was confirmed by zeta potential (Fig. 1E).
Figure 1.

Characterization of fluorescent 50nm silica based nanoparticles. Transmission Electron Microscopic images of (A) NP1, (B) NP1-PEG (C) NP1-MNP, and (D) NP1-MNP-PEG. The scale bar is 100nm. (E) Zeta potentials were measured for the four nanoparticles.
3.2 Internalization rates of silica nanoparticles in various cell types
We first quantified the relative rate of internalization in our panel of cell types exposed to silica nanoparticles for 3 or 7 days. Our tissue/cell types were based on the potential interaction in vivo and included 19 cell lines as “off-target” and 4 bone related cells “on-target”. Internalization of nanoparticles into cells was visualized and quantified by fluorescence microscopy. The number of internalized particles, based on fluorescent intensity under identical camera exposure settings, was increased proportionally with medium concentration and was maximal at 300μg/ml (data not shown) however all concentrations demonstrated detectable cellular fluorescence by at least 7 days of exposure (Figure 2). Fluorescent intensity was quantified using Image J software and grouped by quartile (+ = lowest 25% and ++++ = highest 25%). In general, bone related cells showed consistently high uptake efficiency after three days of exposure while off-target cells varied widely (Table 1). Based on our fluorescent microscopy experiments described herein we have determined that after 72 hours addition of 300μg/ml of nanoparticles or less demonstrated undetectable fluorescence in the medium suggesting essentially complete internalized by cells. This occurred regardless of surface property or metal core as we have previously reported for NP1 and NP1-PEG (Ha et al., 2013a). The ability of the cells to completely internalize concentrations of nanoparticles up to 300μg/ml emphasizes the active uptake by the cells as opposed to achieving equilibrium. However, concentrations of 300–1000μg/ml resulted in the detection of particles in the medium based on fluorescence regardless of core or surface property while internalization was still maximal. This suggests at these higher concentrations reach full cellular saturation beyond which uptake is either actively suppressed or a steady state is achieved. In this case the rate of exocytosis would be equal to the rate of endocytosis. Further, we began to visually detect aggregation of the nanoparticles at concentrations above 1,000μg/ml and therefore, for our in vitro cytotoxicity measurements we considered a concentration of 1,000μg/ml to be the upper limit to produce a biologically meaningful result. This in vitro concentration range should be broad enough to encompass projected in vivo ranges up to an intravenous injection of 100mg/kg body weight in mice.
Figure 2. NP1-PEG internalized images at 1000 μg/ml.

Internalization of fluorescent NP1-PEG into multiple cell types. (A) Multiple representative cell lines were incubated with NP1-PEG for 3 days at 1,000μg/ml. The cells were photographed under fluorescent (top panel) or light (bottom panel) microscopy (scale bar=50μm). (B) The same cell lines were imaged after incubation with 1,000μg/ml of NP1-PEG for 7 days. All images were taken after removal and washing of non-internalized nanoparticles.
Table 1.
Calculation of in vitro nanoparticle toxicity.
| Cell lines | Tissue/cell type | Uptake Efficiency | LC50 (μg/ml) | ATCC number/source |
|---|---|---|---|---|
|
| ||||
| * A549 | Lung/Epithelial | + + | ≥1000 | CCL-185 |
| * BMSC (m) | Bone marrow/Stromal | + + + + | ≥1000 | Primary culture3 |
| BMSC | Bone marrow/Stromal | + + + + | ≥1000 | Primary culture |
| H441 | Lung/Epithelial | + + | ≥1000 | HTB-174 |
| 16-HBE | Bronchus/Epithelial | + | ≥1000 | Primary/transformed |
| HCT 116 | Colon/Epithelial | + + + + | ≥1000 | CCL-247 |
| * HEK | Kidney/Epithelial | + | ≥1000 | CRL-1573 |
| * Hep G2 | Liver/Epithelial | + | ≥1000 | HB-8065 |
| HL-60 | Blood/promyeloblast | + | ≥1000 | CCL-240 |
| HUVEC | Vein/Endothelial | + + + + | ≥1000 | Primary culture |
| Jurkat | Blood/T lymphocyte | + + + | ≥1000 | TIB-152 |
| * MC3T3-E1 (m) | Calvaria/Osteoblast | + + + | ≥1000 | CRL-2593~4 |
| MCF-7 | Breast/Epithelial | + + | ≥1000 | HTB-22 |
| MDA-MB-231 | Breast/Epithelial | + | ≥1000 | HTB-26 |
| PC-12 (r) | Adrenal gland | + + + | ≥1000 | CRL-1721 |
| Ramos | Blood/B lymphocyte | + + | ≥1000 | CRL-1596 |
| * RAW264.7 (m) | Ascites/Monocyte | + + + | ≥1000 | TIB-71 |
| * SK-OV-3 | Ovary/Epithelial | + + + | ≥1000 | HTB-77 |
| SW620 | Colon/Epithelial | + + | ≥1000 | CCL-227 |
Cells are of human origin unless otherwise noted; (m) murine, (r) rat.
Lack of toxicity confirmed for NP1-MNP, NP1-MNP-PEG, and NP1 (all >1000μg/ml)
3.3 In vitro toxicity profile of silica nanoparticles in various cell types
To determine the median 50% lethal concentration, (LC50) and lethal concentration 90% (LC90) all off-target cell lines were exposed to a concentration range of 0 to 1,000 μg/ml of nanoparticles for 3 days (Table 1). Results revealed that the LC50 and LC90 were not achieved at 1,000 μg/ml with all cells exhibiting at least 75% cell viability compared to vehicle treated control after incubation for 3 days (Figure 2). Our previous studies have identified two key cells involved in skeletal remodelling, bone forming osteoblasts and bone resorbing osteoclasts, as key functional targets of silica nanoparticles (Beck et al., 2012). We thus further investigated toxicity in terms of LC50 on target cells including; primary mouse and human BMSC, the murine pre-osteoblast cell line MC3T3-E1 and the pre-osteoclast cell line RAW264.7. All cells were exposed to a dose range of 0 to 1,000 μg/ml NP1-PEG nanoparticles for 3 days and cell viability quantified by XTT assay. Results revealed that LC50 and LC90 were greater than 1,000 μg/ml and all cells exhibited at least 85% cell viability, relative to control (Table 1). We also demonstrated the lack of toxicity from particles lacking PEG (NP1) or containing a cobalt ferrite core (NP1-MNP) or PEGylated surface (NP1-MNP-PEG) in representative cell lines (Table 1). Collectively, the results suggest a broad safety profile in cells representing a range of potential in vivo target organs.
3.4 Effective Dose 50 of silica nanoparticles for osteoblast mineralization
Towards the goal of developing a therapeutic index as well as identifying the effects of surface property and metal core on maximizing biological effect(s) we directly compared the ability of NP1 and PEG variant to enhance osteoblast mineralization. Osteoblast cells derive from the mesenchyme lineage (BMSCs) and are the cells responsible for the formation of hydroxyapatite (bone mineral) and bone matrix (protein component of bone, predominantly collagen type I), and therefore maintenance of skeletal mass. Cells from this lineage can be differentiated in culture by the addition of ascorbic acid to the culture medium and given a source of phosphate will form a collagen matrix with hydroxyapatite mineral (Beck et al., 1998). To quantify the enhancement of mineralization by our nanoparticles we treated mouse BMSCs with a concentration range of particles (0–25μg/ml) in the presence of osteoblast differentiation medium (Ascorbic acid + β-Glycerophosphate). Medium and particles were changed every two to three days and plates stained with alizarin red S to visualize mineralization, at 11 days. The results revealed that NP1 and NP1-PEG greatly accelerated mineral nodule formation in mouse BMSCs (Figure 3A) and quantification of mineralization using the image J program and Origin software resulted in an EC50 of ~1μg/ml (Figure 3B, Table 2). The addition of PEG resulted in a slight decrease in efficacy; however this difference is likely within the variability of the assay. We additionally tested the effects of NP1-MNP in both mouse BMSCs and the pre-osteoblast cell line MC3T3-E1. Cells were differentiated and stained as above. Results suggested that the metal core particles had a similar stimulatory effect on osteoblast mineralization in mouse BMSCs (Fig. 4A) and that the stimulation of these primary cultures were very similar to the pre-osteoblast cell line (Fig. 4B). The EC50 for NP1-MNP was calculated and produced a similar stimulation between the two cell types (~18–33μg/mL) but was less than the non-metal core nanoparticles (NP1 and NP1-PEG) (Table 2). The above results allowed us to determine an in vitro therapeutic index for our nanoparticles. Our silica-based nanoparticles displayed a TI of at least ~750 for NP1 and NP1-PEG (Table 2) with no detectable toxicity at saturating concentrations suggesting a highly favorable safety profile.
Figure 3. Mineralization induced by NP1 and NP1-PEG.

Mineralization induced by silica-based nanoparticles. (A) Mouse bone marrow stromal cells (BMSCs) were cultured in osteoblast differentiation medium with the indicated concentrations of NP1 or NP1-PEG for 7–10 days or control (growth medium) and stained for calcium deposition with Alizarin red S. (B) The mineralization in the wells was quantified using Image J, averaged (±SEM), and plotted as percent change from the highest value to calculate the EC50. N=9. *p<0.05; **p<0.01; ***p<0.001 compared to unstimulated control. $p<0.05 compared to untreated nanoparticle control.
Table 2.
Calculation of therapeutic index (TI) for osteoblast mineralization and inhibition of osteoclastogenesis.
| NP type | Cell line | EC50 or IC50 (μg/ml) | EC90 or IC90 (μg/ml) | TI = (LC50/EC50) |
|---|---|---|---|---|
| NP1 | BMSC | 1.0 | 6.9 | >1,000 |
| RAW264.7 | 9.3 | 30.2 | >106.4 | |
| NP1-PEG | BMSC | 1.3 | 8.0 | >769 |
| NP1-MNP | BMSC | 32.5 | 58.5 | >30.7 |
| MC3T3-E1 | 17.8 | 47.8 | >56.2 |
For the calculation of TI, LC50 was regarded as >1000 μg/ml.
Figure 4. Mineralization induced by NP1-NMP.

Mineralization induced by metal core silica nanoparticles. (A) Mouse bone marrow stromal cells (BMSCs) and MC3T3-E1 cells were cultured in osteoblast differentiation medium with the indicated concentrations of NP1-MNP or control (growth medium) for 10 days and stained for calcium deposition with Alizarin red S. (B) The mineralization in the wells was quantified using Image J, averaged (±SEM), and plotted as percent change from the highest value to calculate the EC50. N=5–6. *p<0.05; **p<0.01; ***p<0.001 compared to unstimulated control. $p<0.05 compared to untreated nanoparticle control.
3.5 Silica nanoparticles enhance osteoblast differentiation
Osteoblast differentiation is marked by an increase in alkaline phosphatase (ALP) enzyme activity. We therefore measured ALP activity in cell lysate in mBMSCs treated with NP1-PEG for 7 days. Results revealed an increase in response to addition of nanoparticles (Figure 5A). We additionally analyzed a number of osteoblast marker genes by qRT-PCR to confirm the stimulation of differentiation including; osteopontin (OPN) and osteocalcin (OSC), secreted proteins representative of the later stages of differentiation and more closely associated with the mineralization stage (Beck et al., 2000; Karsenty et al., 1999) and Runx2, a specific transcription factor necessary for osteoblast differentiation (Karsenty et al., 1999). BMSCs were treated with NP1-PEG (10μg/mL) for 10 days and RNA isolated for analysis (Figure 5B–D). The expression of these differentiation marker genes were strongly stimulated by addition of NP1-PEG. We performed a similar analysis of MC3T3-E1 cells treated with NP1-MNP for 10 days and obtained nearly identical results (Figure 5E–H). The results suggest that our 50nm silica nanoparticles, regardless of surface property or core are able to influence osteoblast differentiation at concentrations that also enhance mineralization. These results support the specific bio-active nature of the particles at EC50 dose and the favorable in vitro therapeutic profile.
Figure 5. ALP enzyme activity and gene expression.

Enzyme activity and gene expression induced by silica-based nanoparticles; BMSCs cells were treated with the indicated concentrations of NP1-PEG for 7 days in osteoblast differentiation medium and alkaline phosphatase (ALP) activity quantified (A) or 10μg/ml for 7 days and RNA harvested for qRT-PCR analysis of the osteoblast marker genes osteopontin (OPN), osteocalcin (OSC), and Runx2 (B–D). MC3T3-E1 cells were treated with the indicated concentrations of NP1-PEG in osteoblast differentiation medium for 10 days and ALP activity quantified (E) or 10μg/ml NP1-MNP for 7 days and RNA analyzed (F–H). The results were normalized to 18S and are expressed as fold change from control +/− SD of 3 replicates. Data are representative of three independent experiments. *p<0.05 and **p<0.01 compared to osteoblast control (student T test).
3.6 Metal core silica nanoparticles inhibit osteoclast differentiation
Bone homeostasis is the net result of osteoblast and osteoclast function. Osteoclasts derive from the hematopoietic lineage and are the cell type responsible for bone resorption. We have reported that NP1 may establish a favorable bone remodelling state by not only promoting bone formation, but also by suppressing osteoclast differentiation (Beck et al., 2012). A commonly used cell line to study the differentiation of osteoclasts is the murine monocytic osteoclast precursor cell line, RAW264.7. We calculated an IC50 for osteoclast suppression by nanoparticles following the induction of osteoclast differentiation by addition of the key osteoclastogenic cytokine Receptor activator of nuclear factor kappa-B ligand (RANKL). Osteoclasts, by convention, are defined as Tartrate Resistant Acid Phosphatase (TRAP) positive staining cells containing ≥ 3 nuclei. RAW264.7 cells were differentiated to osteoclasts by the additional of RANKL (25ng/mL) for 7 days in the presence of increasing amounts of NP1. Our results revealed a strong inhibition of osteoclast differentiation (Figure 6A). We quantified the number of osteoclasts per well and calculated an IC50 for osteoclast inhibition (Figure 6B). The IC50 for NP1 in osteoclast inhibition (~9 μg/ml) is similar the EC50 for osteoblast mineralization (~1 μg/ml) (Table 2) suggesting a desirable property for a therapeutic.
Figure 6. IC50 calculation of NP1 in RAW264.7.
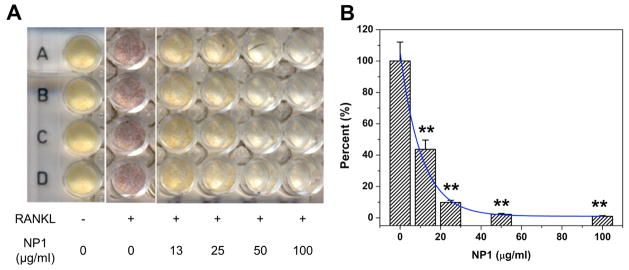
Inhibition of osteoclastogenesis by metal core silica nanoparticles; (A) RAW264.7 cells were differentiated to osteoclasts with RANKL (25ng/mL) for 7 days in the presence on increasing concentrations of NP1 and stained for TRAP (red cells). Yellow cells are TRAP negative. (B) Multinucleated (≥3 nuclei) TRAP positive cells were quantified and IC50 computed. **p<0.01 compared to osteoblast control, (student T test).
4. Discussion
Previous studies on the safety profile of silica based nanomaterials have generated conflicting results regarding safety with varying degrees of toxicity that may be due to differences in size and shape and synthesis method. (Barik et al., 2008; Herd et al., 2011; Nan et al., 2008; Napierska et al., 2010). Size is an important influence on the tolerance of cells to silica based nanomaterials. For example, in human endothelial cells small amorphous silica nanospheres of 14–16 nm causes pronounced cytotoxicity in cell survival assays while larger nanoparticles (60 nm, 104 nm and 335 nm) showed significantly less toxicity (Napierska et al., 2009). Results have also suggested some toxicity in cell types such as fibroblasts, pre-adipocytes, endothelial, and melanoma cells dependent on size and surface properties (Huang et al., 2011; Napierska et al., 2009; Stepnik et al., 2012). However, in agreement with our results, 40–80nm silica particles showed no toxicity in HUVEC cells (30,000 NPs/cell) (Bauer et al., 2011) and mesoporous silica nanoparticles were reported to retain over 80% viability in A375 melanoma cells exposed to at a 1000 μg/ml dose (Huang et al., 2010). We were interested in determining whether the effects on adherent relative to non-adherent cells would vary as less information exists on these cell types. However, these cells showed over 80% viability at 1,000 μg/ml, which was similar to adherent cell lines suggesting that potential differences in membrane surface exposure does not alter toxicity. Taken together our results suggest that ~50nm is a biocompatible size for a wide variety of cell types with diverse functions.
In vivo, the toxicity of amorphous silica nanoparticles has also produced varied results with some studies finding no toxicity (Kumar et al., 2010; So et al., 2008) and others reporting some degree of hepatotoxicity (Isoda et al., 2013; Nishimori et al., 2009a, b). A recent study investigating the effects of nano-silica size on liver toxicity used 30, 50, 70nm sized commercially purchased silica particles injected intravenously into eight-week-old BALB/c male mice (Isoda et al., 2013). The smaller particle size (30nm) resulted in greater liver toxicity with 50nm producing an intermediate effect at 40mg/kg and no toxicity below 30mg/kg. Another study in mice reported that 50nm spherical silica nanoparticles with magnetite cores showed no evidence of histopathological changes in major organs when injected intraperitoneal for 4 weeks at doses as high as 100 mg/kg (Kim et al., 2006). Attesting to the significance of synthesis method and shape, nonporous silica nanospheres (Stöber) were found to result in minimal hemolytic activity whereas mesoporous silica nanospheres and silica nanorods resulted in significant hemolysis (Yu et al., 2011). Size of silica nanoparticles has also been demonstrated to affect hemolysis with those <100nm resulting in almost no hemolytic activity (Rabolli et al., 2010). Collectively, these studies suggest that in vivo cytotoxicity, similar to in vitro cytotoxicity, can be strongly affected by concentration, size, shape, and surface properties of nanomaterials, as well as the synthetic methods, which also result in potential differences in biological activity (dos Santos et al., 2011; Huang et al., 2010; Napierska et al., 2010). Therefore, determining the in vitro cellular toxicity or safety is a logical first step for any unique nanomaterial before expanding into extensive and more costly therapeutic applications.
Although bone has a highly structured matrix it is still a very dynamic tissue constantly being renewed through cycles of resorption and formation. These properties make bone particularly suited to therapeutic targeting by nanotechnology through drug delivery to both cells and matrix (Tautzenberger et al., 2012). The enhancement of mineralization by NP1 could result from a physical interaction in extracellular environment or cell matrix with calcium and phosphate to enhanced hydroxyapatite formation or through an enhancement of cell differentiation as previously suggested (Beck et al., 2012). However, a study of amorphous silica and titania gel prepared by the sol-gel method demonstrated formation of hydroxyapatite in a simulated body fluid as a result of the materials numerous surface OH groups, which can interact with calcium ions and initiate calcium phosphate or hydroxyapatite growth (Li et al., 1994). These results suggest a purely chemical/physical interaction in contrast to our results. While crystalline or highly structured condensed materials with less OH groups due to the free OH groups being bound with metals during the annealing process were much less effective at interacting with calcium and phosphate (Zhuravlev, 1987). However, alumina, which has no crystallinity and high OH groups on the surface and positive charge has been shown not to generate apatite under similar conditions (Li et al., 1994). More recently, Shimizu and colleagues demonstrated that multi-welled carbon nanotubes pellet with collagen induce bone calcification and these carbon materials have no OH groups (Shimizu et al., 2012).
PEGylation of the particle surface reduces the number of OH groups resulting in a nearly neutral charge (−5 to+1 mV) relative to the negatively charged OH-bearing nanoparticles (−40 to −30 mV), as measured by zeta potential. We compared the ability of NP1 and NP1-PEG to enhance BMSC mineralization (Table 2) and the results revealed a very similar EC50 and EC90 suggesting that surface properties/charge, in this case, do not strongly influence the biological effect in vitro and support the notion that these nanoparticles alter cell behavior not the physical process of hydroxyapatite formation.
Although surface property did not alter the enhancement of mineralization we somewhat surprisingly did detect a difference between NP1 and the composite particle with metal core NP1-MNP (Table 2). Because both particles are covered with the same amorphous silica, the difference is unlikely directly due to the metal core, particularly in light of the lack of toxicity of these particles (Table 1). One explanation is a difference in weight. NP1 and NP1-MNP have the same 50 nm size, but their weight is different (the theoretical density of cobalt ferrite, 5.29 g/ml (Shenker, 1957), is heavier than silica ~ 1.0 g/ml. Based on our calculations, NP1-MNP is ~27% heavier than NP1 and because we are adding the particles on a weight per volume basis we calculate that the number of NP1-MNP particles added at the same concentration is actually ~25% less than NP1. This equates to approximately 1.59×10¹³ to 1.20×10¹³ total NP1 and NP1-MNP nanoparticles per 1mg weight respectively. It is thus reasonable to postulate that the apparent increased efficacy of NP1 is due to the fact that the number of particles on a per cell basis is increased in the NP1 cultures relative to NP1-MNP. Taken with the lack of effect of the surface property the results suggest that the effect of the particles on mineralization is due more to changes in cell behavior than an influence of the particles on physicochemical reactions in the matrix.
Growing evidence suggests that dietary silica is beneficial to bone (Jugdaohsingh et al., 2008; Macdonald et al., 2012). Low silicon diets have been demonstrated to result in reduced BMD and mineral content in rodents (Carlisle, 1970, 1972; Seaborn and Nielsen, 2002a, b) and epidemiologic studies in humans support a positive correlation between silica intake and BMD (Jugdaohsingh, 2007; Macdonald et al., 2012). Furthermore, silica deficiency leads to detrimental effects on the skeleton including bone deformities, poorly formed joints, defects in cartilage and collagen, and disruption of mineral balance in the femur and vertebrae (Martin, 2007). Silica is being intensively investigated as a beneficial compound in hydroxyapatite/bioceramic artificial bone scaffolds and bioactive glass, where it is reported to enhance osteoconductivity and proliferation (Gibson et al., 1999; Keeting et al., 1992; Ning et al., 2005; Silver et al., 2001; Zou et al., 2009). A number of studies have reported beneficial effects of silica in various forms and micron sizes on osteoblast proliferation including changes in specific genes/proteins such as alkaline phosphatase (Feng et al., 2007; Wiens et al., 2010; Zhou et al., 2011). Our recent in vivo studies using 50 nm silica nanoparticles confirmed positive influence on the skeleton as measured by an increase in BMD and we now define these 50nm particles as possessing a favorable in vitro safety profile.
In summary, previous studies have suggested the potential use of silica and silica based nanomaterials for biomedical applications (Rahman et al., 2009), however the physicochemical properties of nano-silica remain to be fully elucidated. In the current study, our 50nm spherical silica nanoparticles synthesized by the Stöber method displayed a favorable therapeutic index suggesting the potential for use as a drug. Our silica-based nanoparticles displayed a TI of at least ~500–1000 with minimal toxicity at saturating concentrations suggesting a high safety profile. The TI is the ratio of LD50 (or LC50) and ED50 (or EC50), and an effective therapeutic should have a broad TI resulting in higher safety profile and decreased possibility of a drug overdose that is associated with a narrow TI. The US FDA defines a narrow TI as less than a 2-fold difference in LD50 and ED50 or in the minimum toxic concentrations and minimum effective concentrations in the blood (21 CFR 320.33(c)). Additionally, these results emphasize the potential use of nano-silica itself as a bio-active substance which could be manipulated for beneficial osteo-regulatory purposes. More broadly, the results suggest a general lack of toxicity of ~50nm spherical silica based nanomaterials when synthesized as described in the text, at medium saturating concentrations in key tissue cell types providing support for use as a therapeutic. Finally, we believe that establishing an in vitro therapeutic index, using a panel of cell types will be an important prerequisite prior to embarking on more time consuming and costly in vivo studies in future nanoparticle development.
Highlights.
50nm fluorescent silica particles with varied surface and core properties were used
Cells representing major organ types were used to investigate an in vitro toxicity
These nanoparticles displayed no toxicity at concentrations of 1000ug/mL
EC50 and IC50 were developed for effects on osteoblasts and osteoclasts
Our nanoparticles display a favorable therapeutic index suggesting use as a drug
Acknowledgments
The authors would like to thank Hong Yi of the Robert P. Apkarian Integrated Electron Microscopy Core at Emory University for expert technical assistance associated with TEM. This study was supported by grants from NIAMS (AR056090), the Georgia Research Alliance (GRA.VL12.C2) and the Department of Biomedical Engineering at Georgia Institute of Technology, Emory University, and Children’s Healthcare of Atlanta, Center for Pediatric Nanomedicine, Atlanta, GA, USA (RC159-G3) to M.N. Weitzmann and G.R. Beck Jr. as well as Award Number I01BX002363 from the Biomedical Laboratory Research & Development Service of the VA Office of Research and Development to GR Beck Jr. G.R. Beck is also supported in part by a grant from the NIH-NCI (CA136716). M.N. Weitzmann is also supported in part by funding from the Biomedical Laboratory Research & Development Service of the VA Office of Research and Development (5I01BX000105) and by grants AR059364 and AR053607 from NIAMS and AG040013 from NIA. The contents of this manuscript do not represent the views of the Department of Veterans Affairs or the United States Government.
Footnotes
Conflict of Interest
The authors declare that there are no conflicts of interest.
Publisher's Disclaimer: This is a PDF file of an unedited manuscript that has been accepted for publication. As a service to our customers we are providing this early version of the manuscript. The manuscript will undergo copyediting, typesetting, and review of the resulting proof before it is published in its final citable form. Please note that during the production process errors may be discovered which could affect the content, and all legal disclaimers that apply to the journal pertain.
References
- Aubin JE. Advances in the osteoblast lineage. Biochem Cell Biol. 1998;76:899–910. [PubMed] [Google Scholar]
- Barik TK, Sahu B, Swain V. Nanosilica-from medicine to pest control. Parasitol Res. 2008;103:253–258. doi: 10.1007/s00436-008-0975-7. [DOI] [PubMed] [Google Scholar]
- Bauer AT, Strozyk EA, Gorzelanny C, Westerhausen C, Desch A, Schneider MF, Schneider SW. Cytotoxicity of silica nanoparticles through exocytosis of von Willebrand factor and necrotic cell death in primary human endothelial cells. Biomaterials. 2011;32:8385–8393. doi: 10.1016/j.biomaterials.2011.07.078. [DOI] [PubMed] [Google Scholar]
- Beck GR, Jr, Ha SW, Camalier CE, Yamaguchi M, Li Y, Lee JK, Weitzmann MN. Bioactive silica-based nanoparticles stimulate bone-forming osteoblasts, suppress bone-resorbing osteoclasts, and enhance bone mineral density in vivo. Nanomedicine. 2012;8:793–803. doi: 10.1016/j.nano.2011.11.003. [DOI] [PMC free article] [PubMed] [Google Scholar]
- Beck GR, Jr, Khazai NB, Bouloux GF, Camalier CE, Lin Y, Garneys LM, Siqueira J, Peng L, Pasquel F, Umpierrez D, Smiley D, Umpierrez GE. The effects of thiazolidinediones on human bone marrow stromal cell differentiation in vitro and in thiazolidinedione-treated patients with type 2 diabetes. Transl Res. 2013;161:145–155. doi: 10.1016/j.trsl.2012.08.006. [DOI] [PMC free article] [PubMed] [Google Scholar]
- Beck GR, Jr, Sullivan EC, Moran E, Zerler B. Relationship between alkaline phosphatase levels, osteopontin expression, and mineralization in differentiating MC3T3-E1 osteoblasts. J Cell Biochem. 1998;68:269–280. doi: 10.1002/(sici)1097-4644(19980201)68:2<269::aid-jcb13>3.0.co;2-a. [DOI] [PubMed] [Google Scholar]
- Beck GR, Jr, Zerler B, Moran E. Phosphate is a specific signal for induction of osteopontin gene expression. Proc Natl Acad Sci U S A. 2000;97:8352–8357. doi: 10.1073/pnas.140021997. [DOI] [PMC free article] [PubMed] [Google Scholar]
- Camalier CE, Yi M, Yu LR, Hood BL, Conrads KA, Lee YJ, Lin Y, Garneys LM, Bouloux GF, Young MR, Veenstra TD, Stephens RM, Colburn NH, Conrads TP, Beck GR., Jr An integrated understanding of the physiological response to elevated extracellular phosphate. J Cell Physiol. 2012 doi: 10.1002/jcp.24312. [DOI] [PMC free article] [PubMed] [Google Scholar]
- Carlisle EM. Silicon: a possible factor in bone calcification. Science. 1970;167:279–280. doi: 10.1126/science.167.3916.279. [DOI] [PubMed] [Google Scholar]
- Carlisle EM. Silicon: an essential element for the chick. Science. 1972;178:619–621. doi: 10.1126/science.178.4061.619. [DOI] [PubMed] [Google Scholar]
- Cozens AL, Yezzi MJ, Kunzelmann K, Ohrui T, Chin L, Eng K, Finkbeiner WE, Widdicombe JH, Gruenert DC. CFTR expression and chloride secretion in polarized immortal human bronchial epithelial cells. Am J Respir Cell Mol Biol. 1994;10:38–47. doi: 10.1165/ajrcmb.10.1.7507342. [DOI] [PubMed] [Google Scholar]
- dos Santos T, Varela J, Lynch I, Salvati A, Dawson KA. Quantitative assessment of the comparative nanoparticle-uptake efficiency of a range of cell lines. Small. 2011;7:3341–3349. doi: 10.1002/smll.201101076. [DOI] [PubMed] [Google Scholar]
- Feng J, Yan W, Gou Z, Weng W, Yang D. Stimulating effect of silica-containing nanospheres on proliferation of osteoblast-like cells. J Mater Sci Mater Med. 2007;18:2167–2172. doi: 10.1007/s10856-007-3229-9. [DOI] [PubMed] [Google Scholar]
- Gibson IR, Best SM, Bonfield W. Chemical characterization of silicon-substituted hydroxyapatite. J Biomed Mater Res. 1999;44:422–428. doi: 10.1002/(sici)1097-4636(19990315)44:4<422::aid-jbm8>3.0.co;2-#. [DOI] [PubMed] [Google Scholar]
- Ha SW, Camalier CE, Weitzmann MN, Beck GR, Lee JK. Long-Term Monitoring of the Physicochemical Properties of Silica-Based Nanoparticles on the Rate of Endocytosis and Exocytosis and Consequences of Cell Division. Soft Materials. 2013a;11:195–203. doi: 10.1080/1539445X.2012.617641. [DOI] [PMC free article] [PubMed] [Google Scholar]
- Ha S-W, Weitzmann MN, Beck GR., Jr . Dental and Skeletal Applications of Silica-Based Nanomaterials. In: Subramani K, Ahmed W, Hartsfield J, editors. Nanobiomaterials in Clinical Dentistry. William Andrew Publishing; Oxford, UK: 2013b. pp. 69–91. [Google Scholar]
- Ha SW, Camalier CE, Beck GR, Jr, Lee JK. New method to prepare very stable and biocompatible fluorescent silica nanoparticles. Chem Commun (Camb) 2009:2881–2883. doi: 10.1039/b902195g. [DOI] [PMC free article] [PubMed] [Google Scholar]
- Hamilton RF, Jr, Thakur SA, Holian A. Silica binding and toxicity in alveolar macrophages. Free Radic Biol Med. 2008;44:1246–1258. doi: 10.1016/j.freeradbiomed.2007.12.027. [DOI] [PMC free article] [PubMed] [Google Scholar]
- Herd HL, Malugin A, Ghandehari H. Silica nanoconstruct cellular toleration threshold in vitro. J Control Release. 2011;153:40–48. doi: 10.1016/j.jconrel.2011.02.017. [DOI] [PMC free article] [PubMed] [Google Scholar]
- Huang XL, Li LL, Liu TL, Hao NJ, Liu HY, Chen D, Tang FQ. The Shape Effect of Mesoporous Silica Nanoparticles on Biodistribution, Clearance, and Biocompatibility in Vivo. Acs Nano. 2011;5:5390–5399. doi: 10.1021/nn200365a. [DOI] [PubMed] [Google Scholar]
- Huang XL, Teng X, Chen D, Tang FQ, He JQ. The effect of the shape of mesoporous silica nanoparticles on cellular uptake and cell function. Biomaterials. 2010;31:438–448. doi: 10.1016/j.biomaterials.2009.09.060. [DOI] [PubMed] [Google Scholar]
- Isoda K, Tetsuka E, Shimizu Y, Saitoh K, Ishida I, Tezuka M. Liver injury induced by thirty- and fifty-nanometer-diameter silica nanoparticles. Biol Pharm Bull. 2013;36:370–375. doi: 10.1248/bpb.b12-00738. [DOI] [PubMed] [Google Scholar]
- Jokerst JV, Lobovkina T, Zare RN, Gambhir SS. Nanoparticle PEGylation for imaging and therapy. Nanomedicine. 2011;6:715–728. doi: 10.2217/nnm.11.19. [DOI] [PMC free article] [PubMed] [Google Scholar]
- Jugdaohsingh R. Silicon and bone health. J Nutr Health Aging. 2007;11:99–110. [PMC free article] [PubMed] [Google Scholar]
- Jugdaohsingh R, Calomme MR, Robinson K, Nielsen F, Anderson SH, D’Haese P, Geusens P, Loveridge N, Thompson RP, Powell JJ. Increased longitudinal growth in rats on a silicon-depleted diet. Bone. 2008;43:596–606. doi: 10.1016/j.bone.2008.04.014. [DOI] [PMC free article] [PubMed] [Google Scholar]
- Karsenty G, Ducy P, Starbuck M, Priemel M, Shen J, Geoffroy V, Amling M. Cbfa1 as a regulator of osteoblast differentiation and function. Bone. 1999;25:107–108. doi: 10.1016/s8756-3282(99)00111-8. [DOI] [PubMed] [Google Scholar]
- Keeting PE, Oursler MJ, Wiegand KE, Bonde SK, Spelsberg TC, Riggs BL. Zeolite A increases proliferation, differentiation, and transforming growth factor beta production in normal adult human osteoblast-like cells in vitro. J Bone Miner Res. 1992;7:1281–1289. doi: 10.1002/jbmr.5650071107. [DOI] [PubMed] [Google Scholar]
- Kim JS, Yoon TJ, Yu KN, Kim BG, Park SJ, Kim HW, Lee KH, Park SB, Lee JK, Cho MH. Toxicity and tissue distribution of magnetic nanoparticles in mice. Toxicol Sci. 2006;89:338–347. doi: 10.1093/toxsci/kfj027. [DOI] [PubMed] [Google Scholar]
- Kumar R, Roy I, Ohulchanskky TY, Vathy LA, Bergey EJ, Sajjad M, Prasad PN. In vivo biodistribution and clearance studies using multimodal organically modified silica nanoparticles. Acs Nano. 2010;4:699–708. doi: 10.1021/nn901146y. [DOI] [PMC free article] [PubMed] [Google Scholar]
- Lee WM, Ha SW, Yang CY, Lee JK, An YJ. Effect of fluorescent silica nanoparticles in embryo and larva of Oryzias latipes: sonic effect in nanoparticle dispersion. Chemosphere. 2011;82:451–459. doi: 10.1016/j.chemosphere.2010.09.055. [DOI] [PubMed] [Google Scholar]
- Li P, Ohtsuki C, Kokubo T, Nakanishi K, Soga N, de Groot K. The role of hydrated silica, titania, and alumina in inducing apatite on implants. J Biomed Mater Res. 1994;28:7–15. doi: 10.1002/jbm.820280103. [DOI] [PubMed] [Google Scholar]
- Livak KJ, Schmittgen TD. Analysis of relative gene expression data using real-time quantitative PCR and the 2(−Delta Delta C(T)) Method. Methods. 2001;25:402–408. doi: 10.1006/meth.2001.1262. [DOI] [PubMed] [Google Scholar]
- Macdonald HM, Hardcastle AC, Jugdaohsingh R, Fraser WD, Reid DM, Powell JJ. Dietary silicon interacts with oestrogen to influence bone health: evidence from the Aberdeen Prospective Osteoporosis Screening Study. Bone. 2012;50:681–687. doi: 10.1016/j.bone.2011.11.020. [DOI] [PubMed] [Google Scholar]
- Martin KR. The Chemistry of Silica and its Potential Health Benefits. J Nutr Health Aging. 2007;11:94–97. [PubMed] [Google Scholar]
- Muller PY, Milton MN. The determination and interpretation of the therapeutic index in drug development. Nat Rev Drug Discov. 2012;11:751–761. doi: 10.1038/nrd3801. [DOI] [PubMed] [Google Scholar]
- Nan AJ, Bai X, Son SJ, Lee SB, Ghandehari H. Cellular uptake and cytotoxicity of silica nanotubes. Nano Lett. 2008;8:2150–2154. doi: 10.1021/nl0802741. [DOI] [PubMed] [Google Scholar]
- Napierska D, Thomassen LC, Lison D, Martens JA, Hoet PH. The nanosilica hazard: another variable entity. Part Fibre Toxicol. 2010;7:39. doi: 10.1186/1743-8977-7-39. [DOI] [PMC free article] [PubMed] [Google Scholar]
- Napierska D, Thomassen LC, Rabolli V, Lison D, Gonzalez L, Kirsch-Volders M, Martens JA, Hoet PH. Size-dependent cytotoxicity of monodisperse silica nanoparticles in human endothelial cells. Small. 2009;5:846–853. doi: 10.1002/smll.200800461. [DOI] [PubMed] [Google Scholar]
- Ning CQ, Mehta J, El-Ghannam A. Effects of silica on the bioactivity of calcium phosphate composites in vitro. J Mater Sci Mater Med. 2005;16:355–360. doi: 10.1007/s10856-005-0635-8. [DOI] [PubMed] [Google Scholar]
- Nishimori H, Kondoh M, Isoda K, Tsunoda S, Tsutsumi Y, Yagi K. Histological analysis of 70-nm silica particles-induced chronic toxicity in mice. Eur J Pharm Biopharm. 2009a;72:626–629. doi: 10.1016/j.ejpb.2009.03.007. [DOI] [PubMed] [Google Scholar]
- Nishimori H, Kondoh M, Isoda K, Tsunoda S, Tsutsumi Y, Yagi K. Silica nanoparticles as hepatotoxicants. Eur J Pharm Biopharm. 2009b;72:496–501. doi: 10.1016/j.ejpb.2009.02.005. [DOI] [PubMed] [Google Scholar]
- Rabolli V, Thomassen LC, Princen C, Napierska D, Gonzalez L, Kirsch-Volders M, Hoet PH, Huaux F, Kirschhock CE, Martens JA, Lison D. Influence of size, surface area and microporosity on the in vitro cytotoxic activity of amorphous silica nanoparticles in different cell types. Nanotoxicology. 2010;4:307–318. doi: 10.3109/17435390.2010.482749. [DOI] [PubMed] [Google Scholar]
- Rahman A, Seth D, Mukhopadhyaya SK, Brahmachary RL, Ulrichs C, Goswami A. Surface functionalized amorphous nanosilica and microsilica with nanopores as promising tools in biomedicine. Naturwissenschaften. 2009;96:31–38. doi: 10.1007/s00114-008-0445-1. [DOI] [PubMed] [Google Scholar]
- Schneider CA, Rasband WS, Eliceiri KW. NIH Image to ImageJ: 25 years of image analysis. Nat Methods. 2012;9:671–675. doi: 10.1038/nmeth.2089. [DOI] [PMC free article] [PubMed] [Google Scholar]
- Seaborn CD, Nielsen FH. Dietary silicon and arginine affect mineral element composition of rat femur and vertebra. Biol Trace Elem Res. 2002a;89:239–250. doi: 10.1385/bter:89:3:239. [DOI] [PubMed] [Google Scholar]
- Seaborn CD, Nielsen FH. Silicon deprivation decreases collagen formation in wounds and bone, and ornithine transaminase enzyme activity in liver. Biol Trace Elem Res. 2002b;89:251–261. doi: 10.1385/bter:89:3:251. [DOI] [PubMed] [Google Scholar]
- Shenker H. Magnetic Anisotropy of Cobalt Ferrite (Co1.01fe2.00o3.62) and Nickel Cobalt Ferrite (Ni0.72fe0.20co0.08fe2o4) Physical Review. 1957;107:1246–1249. [Google Scholar]
- Shimizu M, Kobayashi Y, Mizoguchi T, Nakamura H, Kawahara I, Narita N, Usui Y, Aoki K, Hara K, Haniu H, Ogihara N, Ishigaki N, Nakamura K, Kato H, Kawakubo M, Dohi Y, Taruta S, Kim YA, Endo M, Ozawa H, Udagawa N, Takahashi N, Saito N. Carbon nanotubes induce bone calcification by bidirectional interaction with osteoblasts. Adv Mater. 2012;24:2176–2185. doi: 10.1002/adma.201103832. [DOI] [PubMed] [Google Scholar]
- Silver IA, Deas J, Erecinska M. Interactions of bioactive glasses with osteoblasts in vitro: effects of 45S5 Bioglass, and 58S and 77S bioactive glasses on metabolism, intracellular ion concentrations and cell viability. Biomaterials. 2001;22:175–185. doi: 10.1016/s0142-9612(00)00173-3. [DOI] [PubMed] [Google Scholar]
- So SJ, Jang IS, Han CS. Effect of micro/nano silica particle feeding for mice. J Nanosci Nanotechnol. 2008;8:5367–5371. doi: 10.1166/jnn.2008.1347. [DOI] [PubMed] [Google Scholar]
- Stepnik M, Arkusz J, Smok-Pieniazek A, Bratek-Skicki A, Salvati A, Lynch I, Dawson KA, Gromadzinska J, De Jong WH, Rydzynski K. Cytotoxic effects in 3T3-L1 mouse and WI-38 human fibroblasts following 72 hour and 7 day exposures to commercial silica nanoparticles. Toxicol Appl Pharmacol. 2012;263:89–101. doi: 10.1016/j.taap.2012.06.002. [DOI] [PubMed] [Google Scholar]
- Stober W, Fink A, Bohn E. Controlled growth of monodisperse silica spheres in the micron size range. Journal of colloid interface science. 1968:62–69. [Google Scholar]
- Tang F, Li L, Chen D. Mesoporous silica nanoparticles: synthesis, biocompatibility and drug delivery. Adv Mater. 2012;24:1504–1534. doi: 10.1002/adma.201104763. [DOI] [PubMed] [Google Scholar]
- Tautzenberger A, Kovtun A, Ignatius A. Nanoparticles and their potential for application in bone. Int J Nanomedicine. 2012;7:4545–4557. doi: 10.2147/IJN.S34127. [DOI] [PMC free article] [PubMed] [Google Scholar]
- Teitelbaum SL. Bone resorption by osteoclasts. Science. 2000;289:1504–1508. doi: 10.1126/science.289.5484.1504. [DOI] [PubMed] [Google Scholar]
- Vikulina T, Fan X, Yamaguchi M, Roser-Page S, Zayzafoon M, Guidot DM, Ofotokun I, Weitzmann MN. Alterations in the immuno-skeletal interface drive bone destruction in HIV-1 transgenic rats. Proc Natl Acad Sci U S A. 2010;107:13848–13853. doi: 10.1073/pnas.1003020107. [DOI] [PMC free article] [PubMed] [Google Scholar]
- Wiens M, Wang X, Schlossmacher U, Lieberwirth I, Glasser G, Ushijima H, Schroder HC, Muller WE. Osteogenic potential of biosilica on human osteoblast-like (SaOS-2) cells. Calcif Tissue Int. 2010;87:513–524. doi: 10.1007/s00223-010-9408-6. [DOI] [PubMed] [Google Scholar]
- Yoon TJ, Kim JS, Kim BG, Yu KN, Cho MH, Lee JK. Multifunctional nanoparticles possessing a “magnetic motor effect” for drug or gene delivery. Angew Chem Int Ed Engl. 2005;44:1068–1071. doi: 10.1002/anie.200461910. [DOI] [PubMed] [Google Scholar]
- Yoon TJ, Yu KN, Kim E, Kim JS, Kim BG, Yun SH, Sohn BH, Cho MH, Lee JK, Park SB. Specific targeting, cell sorting, and bioimaging with smart magnetic silica core-shell nanomaterials. Small. 2006;2:209–215. doi: 10.1002/smll.200500360. [DOI] [PubMed] [Google Scholar]
- Yu T, Malugin A, Ghandehari H. Impact of silica nanoparticle design on cellular toxicity and hemolytic activity. Acs Nano. 2011;5:5717–5728. doi: 10.1021/nn2013904. [DOI] [PMC free article] [PubMed] [Google Scholar]
- Zhou H, Wu X, Wei J, Lu X, Zhang S, Shi J, Liu C. Stimulated osteoblastic proliferation by mesoporous silica xerogel with high specific surface area. J Mater Sci Mater Med. 2011;22:731–739. doi: 10.1007/s10856-011-4239-1. [DOI] [PubMed] [Google Scholar]
- Zhuravlev LT. Concentration of Hydroxyl-Groups on the Surface of Amorphous Silicas. Langmuir. 1987;3:316–318. [Google Scholar]
- Zou S, Ireland D, Brooks RA, Rushton N, Best S. The effects of silicate ions on human osteoblast adhesion, proliferation, and differentiation. J Biomed Mater Res B Appl Biomater. 2009;90:123–130. doi: 10.1002/jbm.b.31262. [DOI] [PubMed] [Google Scholar]