Abstract
Rodents produce highly variable ultrasound whistles as communication signals unlike many other mammals, who employ flow-induced vocal fold oscillations to produce sound. The role of larynx muscles in controlling sound features across different call types in ultrasound vocalization (USV) was investigated using laryngeal muscle electromyographic (EMG) activity, subglottal pressure measurements and vocal sound output in awake and spontaneously behaving Sprague–Dawley rats. Results support the hypothesis that glottal shape determines fundamental frequency. EMG activities of thyroarytenoid and cricothyroid muscles were aligned with call duration. EMG intensity increased with fundamental frequency. Phasic activities of both muscles were aligned with fast changing fundamental frequency contours, for example in trills. Activities of the sternothyroid and sternohyoid muscles, two muscles involved in vocal production in other mammals, are not critical for the production of rat USV. To test how stereotypic laryngeal and respiratory activity are across call types and individuals, sets of ten EMG and subglottal pressure parameters were measured in six different call types from six rats. Using discriminant function analysis, on average 80% of parameter sets were correctly assigned to their respective call type. This was significantly higher than the chance level. Since fundamental frequency features of USV are tightly associated with stereotypic activity of intrinsic laryngeal muscles and muscles contributing to build-up of subglottal pressure, USV provide insight into the neurophysiological control of peripheral vocal motor patterns.
Rodents use ultrasound vocalizations (USV) as communication signals (e.g., Barfield et al., ‘79; Smith, ‘79; Brudzynski, 2005; Holy and Guo, 2005; Wöhr and Schwarting, 2007; Burgdorf et al., 2008; Kalcounis-Rueppell et al., 2010; Takahashi et al., 2010). The fundamental frequency (F0) contour of these calls is very variable (Brudzynski et al., ‘93; Kalcounis-Rueppell et al., 2010; Wright et al., 2010). Explaining the sources of this variation, including how signals are produced, will contribute to the understanding of the function of vocal variability in rodents.
As demonstrated by light gas experiments, USV in rodents are whistles (Roberts, ‘75a; Riede, 2011). A whistle is an acoustic excitation generated when airflow becomes disturbed by an obstruction somewhere in the vocal tract. Whistles can be differentiated according to the mechanism of how energy is fed back to reinforce the unstable region of the air flow (Chanaud, ‘70), or according to the nature of the instability mechanism (Wilson et al., ‘71). The latter can be studied in vivo in rats. The instability mechanism at the obstruction is affected by the driving pressure pushing air through the respiratory system and by the resistance or geometry of the obstruction. Roberts (‘75a) suggested that major changes in F0 are associated with changes in respiratory pressure. Subglottal pressure measurements in vocalizing rats did not support this hypothesis (Riede, 2011). The pressure–F0 relation was not robust and explained only a small amount of the F0 variation (Riede, 2011). The second possibility to affect the instability mechanism is altering the resistance or geometry of the obstruction. The larynx has been suggested as location of the primary obstruction by experiments including the transection of laryngeal nerves, endoscopic laryngeal observation in anaesthetized brain-stimulated rats, excised larynx experiments as well as preliminary EMG recordings (Roberts, ‘75b; Wetzel et al., ‘80; Nunez et al., ‘85; Sanders et al., 2001; Johnson et al., 2010; Riede, 2011), but no systematic attempt was made to study the relation between motor patterns of laryngeal muscles and F0 contour in specific call types across individuals. If laryngeal movements and F0 contour in vocalizing animals are associated in a stereotypic way, this would provide direct evidence for a function of the larynx in determining acoustic features of USV.
EMG activity of intrinsic and extrinsic larynx muscles, subglottal pressure and sound output during USV were recorded in order to investigate the relation between motor patterns and acoustic features of calls. First, the relation between laryngeal muscle activity, subglottal pressure and acoustic features across a selection of call types was investigated. Second, the hypothesis that call types can be differentiated by their physiological measures, that is, laryngeal muscle activity and subglottal pressure, was investigated.
METHODS
Data were recorded in nine male Sprague–Dawley rats (body mass 400–450 g). Animals were housed separately in rodent cages (46 cm × 30 cm × 15 cm), with ad libitum food and water supply, providing a 12/12 hr light cycle. Procedures involving animals and their care were reviewed and approved by the Institutional Animal Care and Use (IACUC) committee of the University of Utah.
Animals were anesthetized with an i.p. injection of xylazine (8 mg/kg) and ketamine (80 mg/kg). Atropine was administered to reduce salivation (0.05 mg/kg, i.m.). Operated rats received fluids (5 ml/kg Ringer, s.c.) and antibiotics (Baytril 20 mg/kg, orally). Recording procedures were explained previously (Riede, 2011). Briefly, subglottal pressure was measured through a stainless steel tube implanted in the upper third of the trachea connected to a pressure transducer (model FHM-02PGR-02; Fujikura Ltd., Tokyo, Japan). The pressure transducer was calibrated at the end of the experiment using a digital manometer (Omega HHP-90, Stamford, CT, USA). Electromyograms (EMG) were recorded from two intrinsic (cricothyroid [CT] and thyroarytenoid muscle [TA]) and two extrinsic (sternothyroid [ST] and sternohyoid muscle [SH]) laryngeal muscles. Laryngeal muscles were exposed by using a midline ventral neck incision extending between 3 cm caudal from the pogonion and the cranial end of the sternum. Subcutaneous fat and the glandula mandibularis were bluntly separated to expose the sternohyoideus muscles. The sternohyoideus muscles were separated to expose the larynx. A small incision was made into the fascia of each muscle into which a bipolar silver electrode (Teflon insulated except at the tip of the 76.2 μm wires; A-M Systems, Carlsborg, WA, USA) was inserted. A small drop of tissue adhesive was used to secure the electrode pair to the fascia. The TA muscle was accessed via a small hole in the lateral thyroid cartilage which was drilled with a 23G hypodermic needle. The electrode was moved 1 mm through the hole and secured by a small drop of tissue adhesive. The exact location of the TA muscle electrode was determined after the experiments by first making electrolytic lesions in the TA using the EMG electrodes (8–10 mA current for 40–60 sec), and, second, submitting the larynx to 5 μm serial horizontal sections. Sections were stained with hematoxylin and eosin for a general histological evaluation and identification of the implantation location.
Wires were routed subcutaneously to a backpack, from which stronger wires led EMG signals out of the cage to signal conditioning and recording instruments. Electromyographic recordings were differentially amplified (Model EX4-400; Dagan Corporation, Minneapolis, MN, USA) and bandpass filtered (100–3,000 Hz). EMG recordings were full-wave rectified and low-pass filtered (300 Hz) for better visualization. The rectified signals during phonation were normalized to maximum EMG activity. The largest EMG activities in both muscles were observed during swallowing when the animal was feeding or drinking.
Data Recording and Analysis
Animals were continuously acoustically monitored by a condenser ultrasound microphone (Avisoft-Bioacoustics CM16/CMPA-5V, Berlin, Germany; 15–180 kHz, with a flat frequency response (±6 dB) between 25 and 140 kHz) placed 20 cm above the cage floor keeping the alignment errors between sound and physiological parameters to less than 1 msec. Signals were acquired through a multi-channel data acquisition device (NI USB-6212; National Instruments, Austin, TX), sampled at 150 or 200 kHz and saved as uncompressed files on a computer using Avisoft Recorder software (Avisoft-Bioacoustics).
USV were spontaneously uttered after the presentation of female odor or a female. All males had previous experience with females.
All measurements were performed using sound analysis software PRAAT (version 5.0.41; www.praat.org). Analysis was done in 130 Hz bandwidth spectrograms. USV were divided into 22 kHz calls (near-constant frequency calls between 20 and 29 kHz) and 50 kHz calls categories, following the categorization by Wright et al. (2010). The 50-kHz calls contained 50 kHz trills (rapid frequency oscillations with a period of approximately 10 msec; either sinusoidal or appearing as repeated “inverted-Us”), 50 kHz flat calls (near-constant frequency greater than 30 kHz with a mean slope between −0.2 and 0.2 kHz/msec), 50 kHz complex calls (contain two or more directional changes in frequency of at least 3 kHz each), 50 kHz upward calls (monotonically increasing in frequency, with a mean slope not less than 0.2 kHz/msec), 50 kHz composite calls (calls other than flat/trill combinations, that comprise two or more categories).
Statistical Analysis
First, the relation between subglottal pressure, EMG activity and acoustic features was investigated considering six call types (22 kHz calls, 50 kHz trills, 50 kHz complex calls, 50 kHz flat calls, 50 kHz upward calls, 50 kHz composite calls). Wilcoxon’s test was used for comparisons, (a) between the duration of increased EMG activity and call duration, (b) between the EMG bursting rate and the rate of F0 modulations, and (c) between the EMG bursting rate and the rate of small fluctuations in subglottal pressure. Regression analyses were performed to determine the relation (a) between EMG muscle activity and call duration, and (b) between EMG muscle activity and F0.
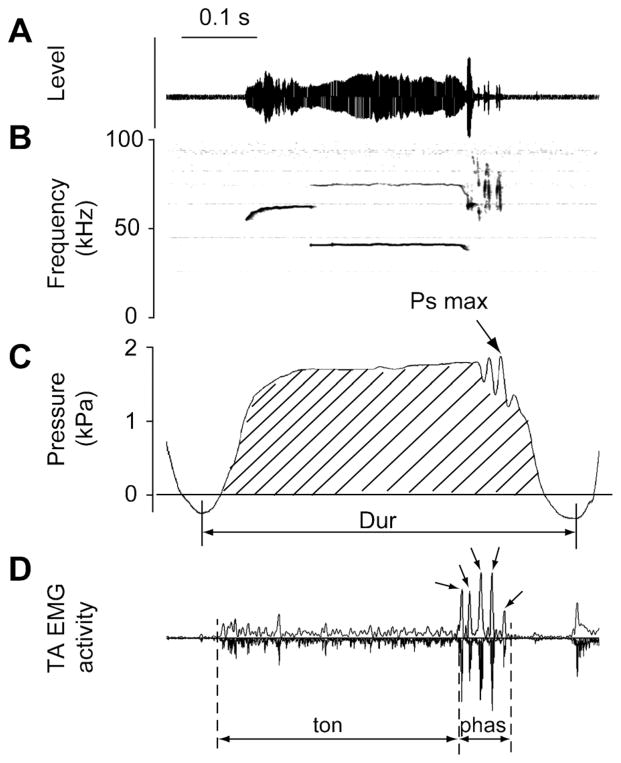
Second, the question whether acoustically defined call types correspond to specific EMG activity and/or subglottal pressure patterns, was studied. Ten parameters were measured (Fig. 1 and Table 1) from the six call types. Discriminant function analysis (DFA) was used to evaluate the grouping value of these EMG and subglottal pressure variables.
Figure 1.
Ten variables were measured in the EMG signal and the subglottal pressure signal Oscillogram (A), spectrogram (B), subglottal pressure signal (C) and TA muscle EMG signal (D) of a 50-kHz composite call. EMG activity is displayed as a rectified original trace (downward) and a low-pass filtered (300 Hz) trace (upward). Variables include the duration of the expiratory phase (“Dur”), the average subglottal pressure (RMS; lined area), maximum subglottal pressure (Ps max), the duration of the phasic increased EMG activity (“phas”) and the duration of the tonic increased EMG activity (“ton”). Other parameters are listed in Table 1. The small arrows in the EMG signal indicate individual bursts during the phasic activity. The number of bursts was counted.
Table 1.
Ten variables were measured in the EMG signal and the subglottal pressure signal.
| Parameter | Explanation |
|---|---|
| Duration | Duration of the expiratory phase of the respiratory cycle during which the call is produced |
| Ratio (phasic/tonic) | Ratio of the duration of the increased phasic EMG activity and increased tonic EMG activity. For example in the call of Figure 1 it is 0.19. In a 22-kHz call it would 0. In a trill call it can exceed 1 |
| TA EMG phasic | Average EMG activity during the increased phasic activity, determined by low-pass filtering (300 Hz) of the full-wave rectified signal |
| TA EMG (%swallowing) | EMG activity during the entire call relative to a maximum produced by this individual. The rectified signal during phonation was normalized to maximum EMG activity. The largest EMG activities were observed during swallowing when the animal was feeding or drinking |
| Ps mean | Mean positive subglottal pressure |
| Ps max | Maximum subglottal pressure |
| Ps symmetry | The symmetry of the subglottal pressure contour around the midpoint of the expiratory phase is calculated as the difference between the maximum subglottal pressure of the call and the average subglottal pressure of the respective half. The ratio of the numbers for the first and second half is determined |
| CV of Ps | Coefficient of variation of the positive pressure signal. CV is calculated from all the positive pressure values during the expiratory cycle during which the call was produced. In a long 22 kHz call with little pressure variation, CV is relatively small but it is large in a trill call with many small subglottal pressure fluctuations |
| # of bursts | Number of bursts during the phasic TA EMG activity |
| Phasic dur | Duration of the increased phasic TA EMG activity |
See Figure 1 for further explanations.
RESULTS
EMG Activity of Intrinsic and Extrinsic Larynx Muscles
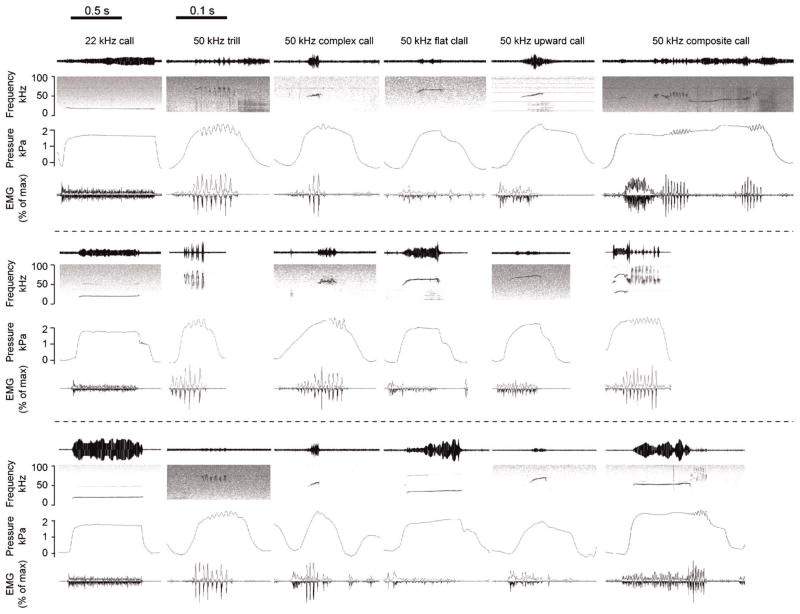
EMG recordings of TA and CT muscles and subglottal pressure were sampled in various combinations from nine male rats. Different call types were produced with characteristic EMG activity (Fig. 2). EMG activity was low and sustained in 22 kHz calls and 50 kHz flat calls (Fig. 2). F0 demonstrated rapid modulations in 50 kHz complex calls, in 50 kHz trills, and in the trill components of 50 kHz composite calls. Rapid and burst-like EMG activity was associated with such fast F0 modulations. The subglottal pressure showed similar fast fluctuations in these calls.
Figure 2.
A selection of six call types was investigated. 22 kHz calls and five call types from the 50 kHz call cluster: 50 kHz trills, 50 kHz complex calls, 50 kHz flat calls, 50 kHz upward call, 50 kHz composite calls. Each call type is represented by three examples. Oscillogram (top panel), spectrogram (second panel), subglottal pressure (third panel), and TA EMG activity (fourth panel). EMG activity is displayed as a rectified original trace (downward) and a low-pass filtered (300 Hz) trace (upward), calculated relative to maximum activity during swallowing. Note the different time scales for 22 and 50 kHz calls.
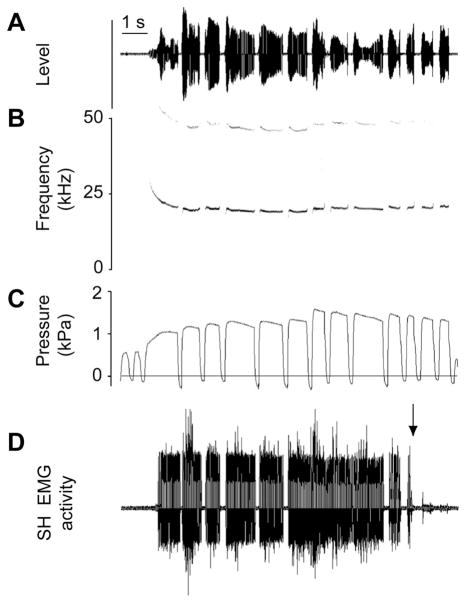
EMG recordings of SH and ST muscles and subglottal pressure were simultaneously sampled in four out of nine rats. Both muscles were not necessary for USV. Vocalizations were produced with or without EMG activity in both muscles, but no obvious acoustic difference was observed. For example, in Figure 3, a male rat started to produce a bout of 22 kHz calls with tonic activity in the SH muscle. SH EMG activity faded away after a few calls suggesting the neck region may have relaxed as the animal continued to vocalize. This was observed in all four rats. EMG activity of both muscles was always associated with head/neck movements or tongue movements, for example during eating or drinking.
Figure 3.
A series of 13 calls is illustrated as oscillogram (A), spectrogram (B), subglottal pressure (C) and EMG activity of the sternohyoid muscle (D). EMG activity of the sternohyoid muscle can be increased during USV. The neck musculature is involved but does not affect acoustic features such as fundamental frequency. EMG activity is synchronized with the first 6 calls, it is not interrupted between calls 6–9, and it fades out during the last three calls of this bout (after arrow in D).
Relation Between Subglottal Pressure, EMG Activity, and Call Features
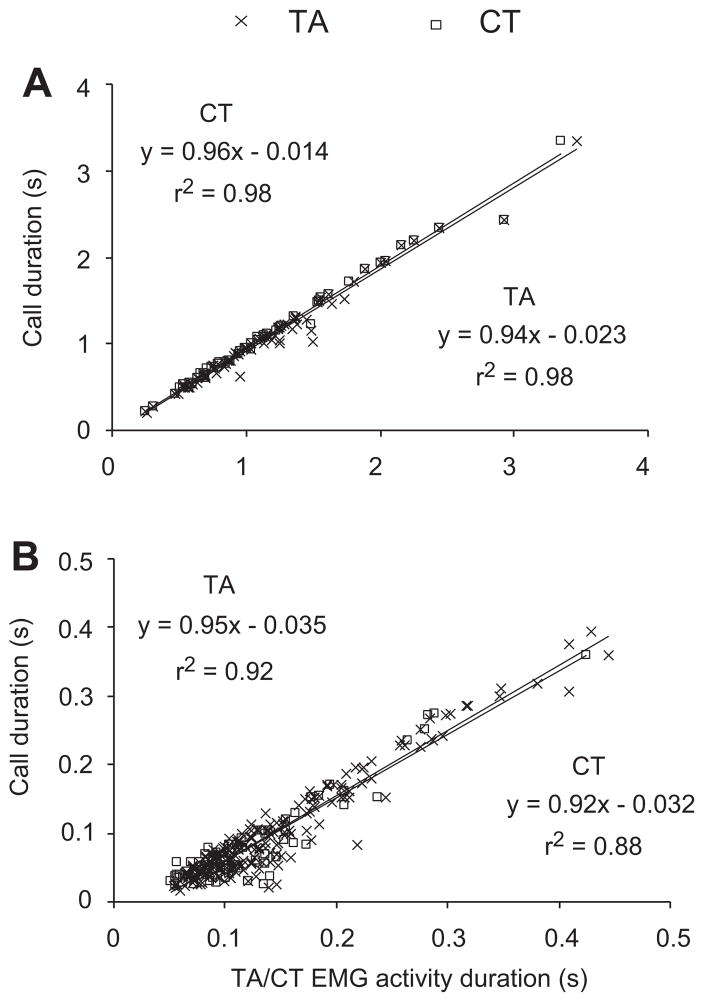
Linear regressions indicated that call duration of 22 kHz calls (TA: r2 = 0.97, F(1,81) = 3,445, P < 0.001, CT: r2 = 0.98, F(1,54) = 4,734, P < 0.001, Fig. 4A), and of 50 kHz calls (TA: r2 = 0.92, F(1,208) = 2,450, P < 0.001, CT: r2 = 0.87, F(1,72) = 507, P < 0.001, Fig. 4B) was associated with the duration of increased EMG activity.
Figure 4.
EMG activity of the thyroarytenoideus (TA) and the cricothyroid (CT) muscle is increased for the duration of the call in 22 kHz calls (A) and in 50 kHz calls (B). Linear regression lines are shown. TA EMG muscle activity was recorded in six animals, and CT EMG recordings come from three rats.
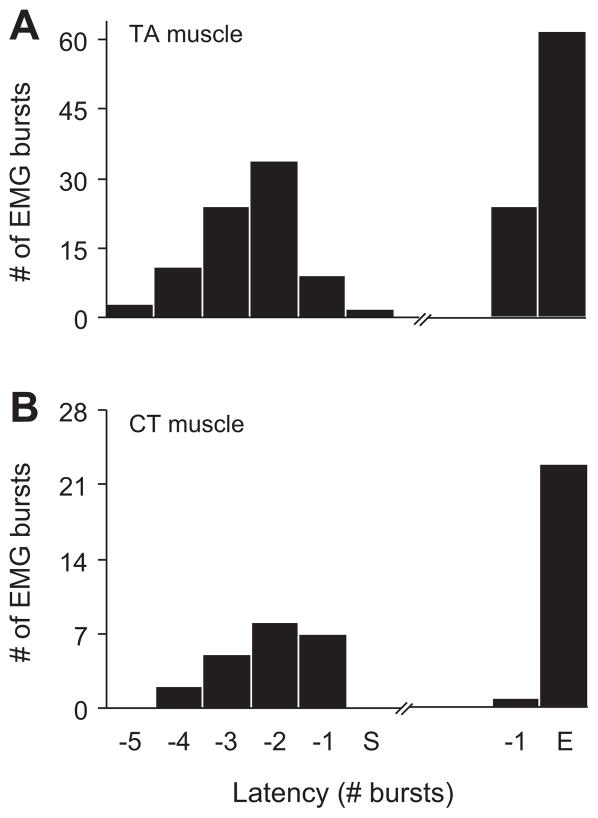
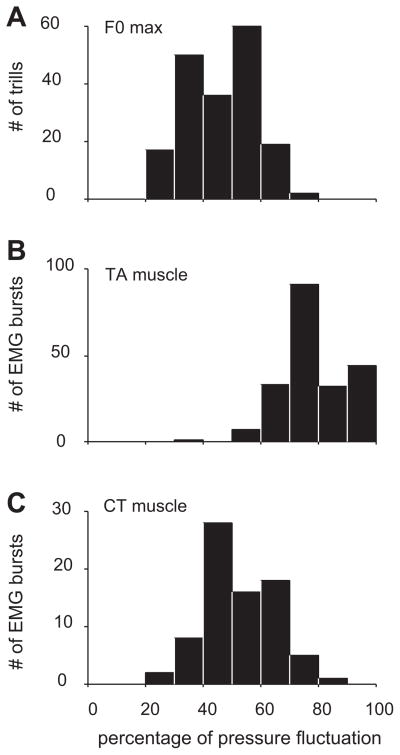
During complex calls, in trills, and in trill components of compound calls, EMG activity of TA and CT muscles was phasic. Bursts started a few cycles before subglottal pressure fluctuations were visible, and ended with the last or second to last pressure fluctuation (Fig. 5). Bursts in CT and TA muscles overlapped with fluctuations in subglottal pressure as well as with the F0 modulation (Fig. 6). The alignment between EMG bursts, subglottal pressure fluctuations and F0 modulations was robust across individuals (Fig. 6).
Figure 5.
The onset and offset of phasic EMG activity in TA (A) and CT (B) muscles are aligned with the onset and offset of subglottal pressure fluctuations. The first (S) and the last (E) pressure fluctuation were used for alignment of EMG bursts. One to five EMG bursts (usually with increasing intensity) are produced before pressure fluctuations become visible. They almost synchronously stop with the last pressure fluctuation. The relationships were investigated in 86 calls (TA muscle recorded in six rats) and 23 calls (CT muscle recorded in three rats), respectively. 50 kHz trills, 50 kHz complex calls, and 50 kHz composite calls were considered.
Figure 6.
Maximum F0 (A), EMG bursts in TA (B) and CT (C) muscles are temporally aligned with subglottal pressure fluctuation. Frequency distribution of latency period is plotted relative from the onset (0) of a pressure fluctuation.
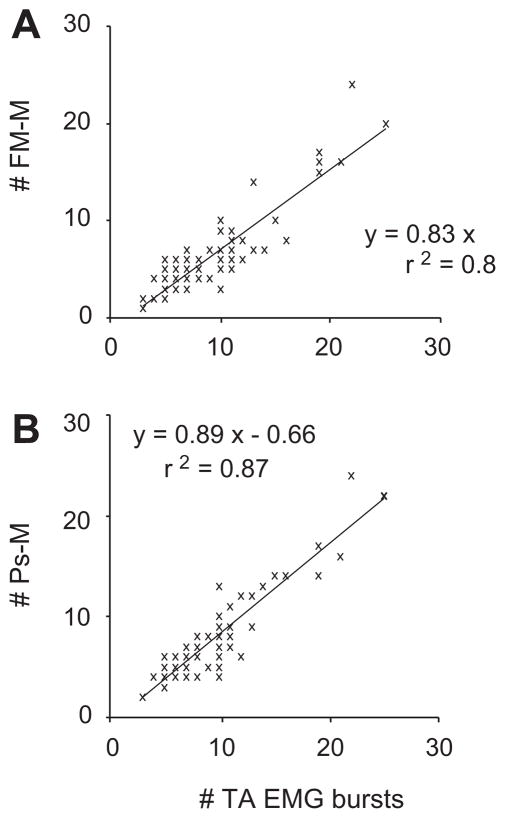
The number of EMG bursts per call was correlated with the number of F0 modulations (r2 = 0.81, F(1,88) = 376, P < 0.001), as well as with the number of subglottal pressure fluctuations (r2 = 0.87, F(1,88) = 601, P < 0.001; Fig. 7). Although only by a very small amount, the average rate of EMG bursts (89.7 ± 5.8 Hz; mean ± SD) was a little bit higher than the rate of F0 modulations (87.9 ± 5.8 Hz; mean ± SD; Wilcoxon signed rank test, Z = 2.86; P < 0.01) and the rate of subglottal pressure modulation (86.1 ± 5.1 Hz; mean ± SD; Wilcoxon signed rank test, Z = 5.07; P < 0.001).
Figure 7.
The relationship between the number of bursts in EMG activity of the TA muscle and the number of modulations in fundamental frequency (# FM; A) and subglottal pressure (# Ps-M; B) are positive. The relationships were investigated in 89 calls (50 kHz trills, 50 kHz complex calls, and 50 kHz composite calls) from six rats.
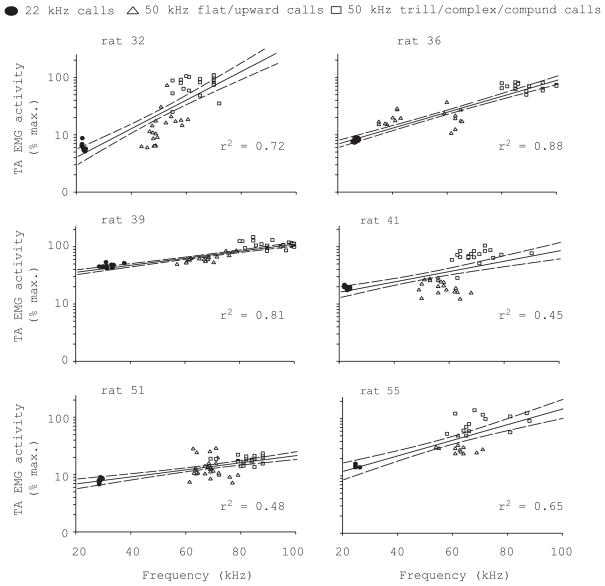
The amplitude of TA and CT EMG activity increased with F0 across call types. The relation could be robustly modeled by exponential functions in six individuals, and the regression coefficients ranged between 0.45 and 0.8 (Fig. 8).
Figure 8.
There is a positive relation between TA muscle EMG activity (logarithmic scale on vertical axis) and fundamental frequency across different call types marked with different symbols. The filtered, full-wave rectified, integrated EMG voltage signal was averaged over the entire call and normalized to the maximum activity during swallowing. Best fit exponential correlation (solid line) and 95% confidence intervals (dashed lines) are shown.
Call Type Specificity of EMG Activity and Subglottal Pressure
If acoustic features of USV are a consequence of movements of the larynx and the respiratory system, then EMG activity and subglottal pressure patterns would allow the correct prediction of call types. The hypothesis that physiological characteristics are call type specific and allow an above chance grouping into call types, was tested. Each of the six call types was represented by three calls from each of three to six rats. This resulted in parameter sets of 96 calls. A DFA was applied to test the affiliation of each parameter set.
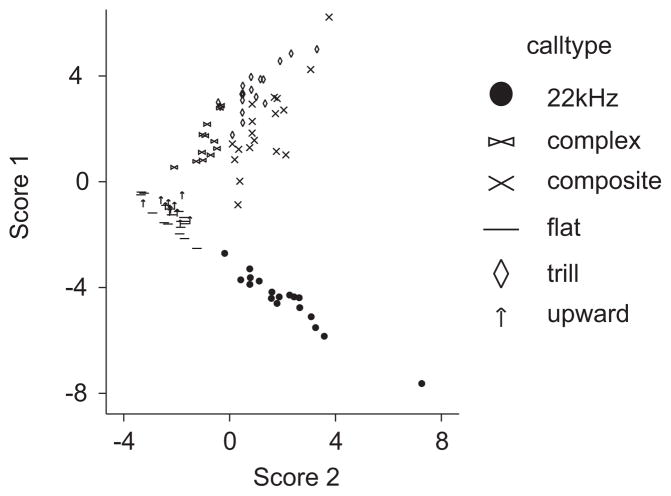
The correct classification by chance into six groups (call types) should be 1/6 or 16.7%. The actual chance level for the 96 parameter sets was estimated by randomizing them into six arbitrary groups using EXCEL’s random number generator. Between 9% and 25% of the calls were classified by chance into their respective group in ten trials, which was not different from the expected chance level of 16.7% (t-test with unequal variances, N = 10, t = 2.4, P = 0.36). Next, each parameter set was pre-assigned to a call type based on the spectrographic image of the corresponding sound recording. Multivariate ANOVA revealed significant differences between call types (Wilks’ k = 0.001, F = 10.47, P < 0.001). Subsequent univariate tests showed that all variables except “mean subglottal pressure” and “symmetry of subglottal pressure contour” were significantly different (Table 2). A stepwise forward DFA identified six variables (duration of expiratory phase; ratio of phasic and tonic activity; relative TA activity; coefficient of variation of subglottal pressure; number of phasic bursts; duration of phasic activity) that contributed most to discrimination of call types. Figure 9 is a plot of six call types in a two-dimensional signal space defined by the first two discriminant functions. There was overlap between some call types (e.g., 50-kHz flat and 50-kHz upward calls), while others were more isolated. The overlap was small enough to allow above-chance assignment of the DFA. The average correct assignment of the original data set was 80.0% (Table 3), that is, on average 80.0% of the calls were correctly classified to six call types. A subsequent leave-one-out cross-validation demonstrated still a 78.1% correct classification.
Table 2.
Results of model II ANOVAs examining between-call type variability (n = 96, df = 5).
| Variable | F | P-value | Function 1 | Function 2 |
|---|---|---|---|---|
| Durationa | 10.1 | <0.001 | −0.488 | 0.681 |
| Ratioa phas/ton | 44.6 | <0.001 | 0.421 | 0.265 |
| TA EMG phasic | 23.7 | <0.001 | 0.330 | 0.130 |
| TA-EMGa (%swall.) | 34.8 | <0.001 | 0.440 | 0.194 |
| Ps mean | 2.2 | 0.064 | 0.148 | 0.115 |
| Ps max | 11.6 | <0.001 | 0.211 | 0.142 |
| Ps-sym | 1.89 | 0.11 | −0.300 | −0.208 |
| CV of Psa | 18.3 | <0.001 | 0.203 | −0.563 |
| # Burstsa | 31.9 | <0.001 | 0.497 | 0.416 |
| Phasic dura | 8.9 | <0.001 | 0.415 | 0.374 |
The last two columns (Function 1 and Function 2) show the correlations (Pearson coefficients) of each variable with the first and second discriminant function.
Parameters included by the stepwise DFA.
Figure 9.
Six call types differentiated in a two-dimensional signal space defined by the first two discriminant functions (or canonical scores). There is overlap between some calls (e.g., 50 kHz flat and 50 kHz upward calls), while others are completely isolated. The overlap was small enough to allow above-chance assignment of the DFA.
Table 3.
Classification results for six call types.
| Call type | Ntotal | Ncorrect classified |
|---|---|---|
| 22 kHz | 18 | 17 (94.4%) |
| 50 kHz trills | 18 | 14 (77.8%) |
| 50 kHz flat calls | 18 | 12 (66.6%) |
| 50 kHz complex calls | 12 | 12 (100%) |
| 50 kHz upward calls | 12 | 8 (66.6%) |
| 50 kHz composite calls | 18 | 17 (94.4%) |
Three call types (22 kHz calls; 50 kHz trills, 50 kHz flat calls) were available from six rats, three calls from each animal; 50 kHz complex calls and 50 kHz composite calls were available from five rats, and 50 kHz upward calls were available only from four rats. N, sample size for each call type and number of correctly classified calls.
The loadings of the ten variables on the first two discriminant functions are shown in Table 2. The first function described muscle activity since ratio of phasic and tonic activity and relative TA EMG activity loaded heavily on this function. Phasic and high amplitude TA EMG activity was not present in 50 kHz upward, 50 kHz flat and 22 kHz calls (negative score 1 in Fig. 9), but it was present in 50 kHz trills, 50 kHz complex, and 50 kHz composite calls (positive score 1 in Fig. 9). The second function appeared to describe subglottal pressure patterns since the coefficient of variation of subglottal pressure loaded heavily on this function (Table 2). The coefficient of variation of subglottal pressure was larger in most 50 kHz trills than in 50 kHz complex and 50 kHz composite calls because the phasic muscle activity which causes pressure fluctuations (Figs. 2 and 7B) lasted longer in trills. Duration of expiratory phase and the number of phasic bursts loaded heavily on both functions (Table 2). The long 22 kHz calls (positive score 1 in Fig. 9) separated from the much shorter 50 kHz flat and 50 kHz upward calls (negative score 1, Fig. 9). Among 50 kHz trill, complex and composite calls, duration of expiratory phase was more variable among composite calls than in the shorter complex and trill calls.
DISCUSSION
When larynx and vocal tract settings remained constant, the magnitude of subglottal pressure changes on F0 amounted to about 50 Hz/kPa (Riede, 2011). Results presented in this study confirmed that the F0 of rat’s USV is also dependent on laryngeal movements.
The laryngeal morphology of the rat resembles the general mammalian design in which movements facilitated by TA and CT muscles determine glottal width and length (Roberts, ‘72; Inagi et al., ‘98). The current study demonstrated that call duration and F0 of USV were closely related to laryngeal movements. The duration of increased EMG activity was reflected in call duration. Amplitude and pattern of EMG muscle activity was reflected in the F0 contour. It was tonic when F0 contour was flat or slowly modulated in other call types. This means that during flat or slowly modulated calls, the glottal gap was stable. EMG activity was phasic during fast F0 modulations, like in 50 kHz complex calls, 50 kHz trills and trill component in 50 kHz composite calls. In these call types the interplay between TA and CT muscles quickly changed the glottal shape. The bursts of both muscles were aligned with the onset and offset of F0 modulation (Figs. 5 and 6). The contraction of TA will shorten and adduct vocal folds, while CT activity elongates the glottal gap. Since CT muscle bursts preceded bursts in the TA muscle, this suggests that the glottis was first long (dorso-ventrally) and possibly wider (latero-laterally) during the higher F0 part and became then constricted for the lower F0 during the fast modulation.
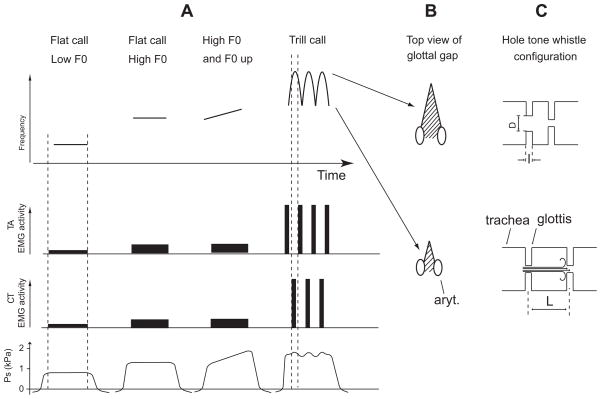
Roberts (‘75a) and Brudzynski and Fletcher (2010) suggested that the rat’s whistle mechanism compares to that of a hole tone whistle. The hole tone whistle consists of a chamber of length L and an upstream constriction of length l and diameter D (Fig. 10). There is a second constriction downstream where the airflow leaves the chamber (Fig. 10). The first orifice in rats is probably the glottis. The second is still unknown but it is likely near the cranial exit of the larynx or in the caudal pharynx area. In a holetone whistle F0 depends on flow rate, chamber length as well as diameter and length of the first orifice (Wilson et al., ‘71). Observations in rats conform with those by Wilson et al. (‘71) in a physical model of a hole tone whistle. First, the model functioned properly only if the driving pressure fell within a limited operating range. Within this operating pressure range the other variables had relatively large effects on F0. In rats subglottal pressure could not account for much of the F0 changes (Riede, 2011), and rats maintained subglottal pressure during USV between 0.5 and ca. 2.5 kPa (Riede, 2011). Higher subglottal pressures (up to 5 kPa) have been recorded but only for audible vocalizations such as screams during rough and tumble play (unpublished data). Secondly, Wilson et al. (‘71) described F0 changes as a function of the geometry of the first orifice and the chamber of their model. Similarly, in rats, changes in diameter of the glottis were associated with F0 variations suggesting F0 is mostly controlled by laryngeal and supralaryngeal movements. These movements appeared to be highly stereotypic and specific for different call types.
Figure 10.
Applying the hole tone whistle model to producing high and low fundamental frequencies and trills in rat ultrasound vocalizations. A: Schematic of spectrograms of four calls (top panel) with associated laryngeal EMG activity (second and third panel) and subglottal pressure pattern (bottom panel): a call with low and flat F0 (like in 22 kHz calls), with high and flat F0 (like in 50 kHz flat calls), with high and increasing F0 (like in 50 kHz upward calls), and with fast F0 modulations (like in 50 kHz trill calls). B: Top view onto the glottal gap (aryt., arytenoid cartilages). The glottal gap assumes a constant setting during flat or slowly modulated calls. The small upward modulation of F0 in the third call is mostly due to the pressure up-regulation. The glottal configuration is more dynamic during trill calls. High frequency components of trills are associated with high amplitudes in phasic CT muscle EMG activity (Fig. 6) producing a larger glottal gap. The low frequency components of trills are associated with high amplitudes in phasic TA EMG activity, presumably narrowing the glottal gap. The interaction between TA and CT muscle activity determines the geometry of the glottis (variables D and l in C). Subglottal pressure ranges between 0.5 and 2.5 kPa in all USV. C: F0 of a hole tone whistle depends on flow rate between the first and second orifice, the width (D) and length (l) of the first orifice and the distance between the first and second orifice (L). It was suggested that the first orifice is the glottis (Roberts, ‘75a; Brudzynski and Fletcher, 2010). The second orifice is located near the cranial end of the larynx or in the caudal pharynx area.
Identifying Units of Vocal Behavior
The identification of the smallest units of behavior is a central problem in understanding an animal’s action and moment-by-moment development of behavior. The extent and quality of motor patterns involved in producing a behavior such as specific call types provides insight into the required motor coordination. The combination of the characteristics of laryngeal muscle activity and the subglottal pressure contour allowed the prediction of a high percentage of spectrographically defined call types. The classification was not perfect though, which is likely related to at least two reasons. First, it is difficult to identify unique acoustic parameter combinations describing call types in rats, because the range in some parameters is large and overlaps between call types (Brudzynski et al., ‘93). The recording of muscle activities and subglottal pressure showed that this overlap in acoustic parameters can be traced, in part, to the underlying movements. Second, CT and TA activity as well as subglottal pressure did not represent all sources of F0 variability. Additional parameters are likely to play also an important role. Other intrinsic larynx muscles (posterior cricoarytenoid, interarytenoid, and lateral cricoarytenoid muscle) help adjust the glottis geometry. The setting of the supraglottal vocal tract including the second orifice (Fig. 10) affects how energy is fed back to reinforce the unstable region at the glottis (Chanaud, ‘70). Furthermore, two strap muscles, relevant for vocal production in other mammals (Kirzinger and Jürgens, ‘94; Sonninen et al., ‘99), did not contribute to the production of USV but were activated only when specific postures were adopted. Other vocal tract muscles (e.g., pharyngeal constrictor and genioglossus muscle) remain to be investigated.
Variability could also be introduced by recording techniques but should apply equally to all calls. For example, the subglottal pressure signals were robust for several days before the tubes started to accumulate deposits and the pressure signal deteriorated. EMG activity can be recorded from a variable number of motor units, depending on the implantation spot, affecting burst intensity and duration during phasic activity (Loeb and Gans, ‘86). The wire implantation into tiny CT and TA muscles may also have caused unnatural strain, or small lesions to the tissue affecting force development, although no significant effects on acoustic parameters were noted.
A Step-like Mechanism of Whistle Production
A key question in the study of vocal control is how the central nervous system coordinates movements of the three motor systems (respiration, larynx, vocal tract) in order to produce target sounds (call types). USV in rats is a motor program, that represents the coordinated spatiotemporal activation of laryngeal and vocal tract muscles in conjunction with the respiratory systems. F0 contour of the ultrasound whistle depends on driving pressure and glottal geometry. Within a limited subglottal pressure range, a certain configuration of the glottis and subsequent vocal tract filter produces a specific F0. It was surprising that while subglottal pressure (Riede, 2011) and laryngeal muscle activity (this study) showed a positive relation with F0 across call types, both relations were not consistent within call types. The relation between subglottal pressure and F0 can dramatically change over the course of a bout of 22 kHz calls (e.g., Fig. 7 in Riede, 2011). Laryngeal muscle activity and F0 were also not consistently and often differently, related within call types as compared to relationships across call types (Fig. 8, this study). Data points in Figure 8 clustered around a center rather than fall on a continuous line (except for rat 39), and the transition between two call types appeared more sudden, that is step-like rather than continuous. Presumably each (call type specific) laryngeal configuration is associated with a different F0 and a different relation between F0, subglottal pressure and laryngeal muscle activity. While each call type apparently has a specific “target setting” of larynx, vocal tract and subglottal pressure, there is variation within each such target.
Beside this more categorical control of different call types, the rat is however able to make use of the opportunity to continuously change F0 by changing the laryngeal configuration. Fast TA and CT muscle activity bursts were associated with the continuous F0 modulation, for example in 50 kHz trill, complex and composite calls.
How are call type specific patterns generated? The current predominant opinion is that simple muscle activation rules generate patterns of different call types in nonhuman mammals. The substantial variability in the spectrotemporal patterns of an individual’s different call types are side effects of an imprecise setting of the vocal organs, of certain posture movements interfering with normal vocal motor patterns or changes in vocal morphology. The neural substrates controlling facial motor nuclei, trigeminal motoneurons, laryngeal, and respiratory motorneurons during vocalization lie in the reticular formation (Hage and Jürgens, 2006; Yajima and Hayashi, ‘83). These pattern generating structures include populations of neurons above the superior olive, the lateral reticular formation around the facial nucleus and nucleus ambiguous, and in the caudal medulla. Vocal-respiratory rhythms are entrained in the lateral parabrachial nucleus (Smotherman et al., 2006). Midbrain periaqueductal gray functions as relay station to trigger vocalization or affects vocal intensity (Larson, ‘91; Yajima et al., ‘80; Düsterhöft et al., 2004). The role of forebrain structures is poorly understood. There is agreement that some structures, such as the anterior cingulated cortex are involved in vocal control (Burgdorf et al., 2007) but the role of other cortex structures is debated. Studies in genetic rodent models implicate cortico-basal ganglia circuits in the development of vocal changes (Enard et al., 2009), although somatic weakness (accompanied by reduced subglottal pressure) was suggested as alternative explanation for such vocal changes (Gaub et al., 2010). The motor cortex region which was for a long time not considered to be relevant for nonhuman vocalization, appears to posses direct connections to brainstem motoneurons as well as to be involved in maintaining F0 in rodent USV (Arriaga et al., 2012). New insights into vocal motor control and feedback mechanisms in mammals arise from the better understanding of what causes acoustic variability in rodent vocalizations, the ability to record from all major motor systems involved in sound production and its modification (respiration and vocal organ) in awake spontaneously behaving animals together with data about neural circuits involved in vocal control.
In summary, USV provide a view into the complex neurophysiological control of the vocal organ. Like in other vocalizing vertebrates, which use flow-induced tissue oscillations (birds: e.g., Suthers et al., ‘99; Franz and Goller, 2002; Fee and Scharff, 2010; mammals: e.g., Kempster et al., ‘88; Jürgens, 2009) or forced oscillations of the swim bladder wall or of laryngeal cartilages (Yamaguchi and Kelley, 2000; Ladich and Fine, 2006) to produce vocalization, features of the emitted sound are closely associated with movements of the vocal organs. The F0 contour of ultrasound whistles in rats is a direct consequence and therefore close representation of movement patterns of the laryngeal and respiratory muscles.
Acknowledgments
Grant sponsor: University of Utah; grant number: VP528; grant sponsor: NIH; grant numbers: R01-DC-006876, R01-DC-008612.
LITERATURE CITED
- Arriaga G, Zhou EP, Jarvis ED. Of mice, birds, and men: the mouse ultrasonic song system has some features similar to humans and song-learning birds. PLoS ONE. 2012;7:e46610. doi: 10.1371/journal.pone.0046610. [DOI] [PMC free article] [PubMed] [Google Scholar]
- Barfield RJ, Auerbach P, Geyer LA, McIntosh TK. Ultrasonic vocalizations in rat sexual behavior. Am Zool. 1979;19:469–480. [Google Scholar]
- Brudzynski SM. Principles of rat communication: quantitative parameters of ultrasonic calls in rats. Behav Genet. 2005;35:85–92. doi: 10.1007/s10519-004-0858-3. [DOI] [PubMed] [Google Scholar]
- Brudzynski SM, Fletcher NH. Rat ultrasonic vocalization: short-range communication. In: Brudzynski SM, editor. Handbook of mammalian vocalization. Amsterdam: Academic; 2010. pp. 69–76. [Google Scholar]
- Brudzynski SM, Bihari F, Ociepa F, Fu X. Analysis of 22 kHz ultrasonic vocalization in laboratory rats: long and short calls. Physiol Behav. 1993;54:215–221. doi: 10.1016/0031-9384(93)90102-l. [DOI] [PubMed] [Google Scholar]
- Burgdorf J, Wood PL, Kroes RA, Moskal JR, Panksepp J. Neurobiology of 50-kHz ultrasonic vocalizations in rats: electrode mapping, lesion, and pharmacology studies. Behav Brain Res. 2007;182:274–283. doi: 10.1016/j.bbr.2007.03.010. [DOI] [PubMed] [Google Scholar]
- Burgdorf J, Kroes RA, Moskal JR, et al. Ultrasonic vocalization of rats (Rattus norvegicus) during mating, play, and aggression: behavioral concomitants, relationship to reward, and self-administration of playback. J Comp Psychol. 2008;122:357–367. doi: 10.1037/a0012889. [DOI] [PubMed] [Google Scholar]
- Chanaud RC. Aerodynamic whistles. Sci Am. 1970;222:40–46. [Google Scholar]
- Düsterhöft F, Hausler U, Jurgens U. Neuronal activity in the periaqueductal gray and bordering structures during vocal communication in the squirrel monkey. Neuroscience. 2004;123:53–60. doi: 10.1016/j.neuroscience.2003.07.007. [DOI] [PubMed] [Google Scholar]
- Enard W, Gehre S, Hammerschmidt K, et al. A humanized version of Fooxp2 affects cortico-basal ganglia circuits in mice. Cell. 2009;137:961–971. doi: 10.1016/j.cell.2009.03.041. [DOI] [PubMed] [Google Scholar]
- Fee MS, Scharff C. The songbird as a model for the generation and learning of complex sequential behaviors. ILAR J. 2010;51:362–377. doi: 10.1093/ilar.51.4.362. [DOI] [PubMed] [Google Scholar]
- Franz M, Goller F. Respiratory units of motor production and song imitation in the zebra finch. J Neurobiol. 2002;51:129–141. doi: 10.1002/neu.10043. [DOI] [PubMed] [Google Scholar]
- Gaub S, Groszer M, Fisher SE, Ehret G. The structure of innate vocalizations in Foxp2-deficient mouse pups. Genes, Brain Behav. 2010;9:390–401. doi: 10.1111/j.1601-183X.2010.00570.x. [DOI] [PMC free article] [PubMed] [Google Scholar]
- Hage S, Jürgens U. On the role of the pontine brainstem in vocal pattern generation: a telemetric single-unit recording study in the squirrel monkey. J Neurosci. 2006;26:7105–7115. doi: 10.1523/JNEUROSCI.1024-06.2006. [DOI] [PMC free article] [PubMed] [Google Scholar]
- Holy TE, Guo Z. Ultrasonic songs of male mice. PLoS Biol. 2005;3:e386. doi: 10.1371/journal.pbio.0030386. [DOI] [PMC free article] [PubMed] [Google Scholar]
- Inagi K, Schultz E, Ford CN. An anatomic study of the rat larynx: establishing the rat model for neuromuscular function. Otolaryngol Head Neck Surg. 1998;118:74–81. doi: 10.1016/S0194-5998(98)70378-X. [DOI] [PubMed] [Google Scholar]
- Johnson AM, Ciucci MR, Russell JA, Hammer MJ, Connor NP. Ultrasonic output from the excised rat larynx. J Acoust Soc Am. 2010;128:EL75–EL79. doi: 10.1121/1.3462234. [DOI] [PMC free article] [PubMed] [Google Scholar]
- Jürgens U. The neural control of vocalization in mammals: a review. J Voice. 2009;23:1–10. doi: 10.1016/j.jvoice.2007.07.005. [DOI] [PubMed] [Google Scholar]
- Kalcounis-Rueppell MC, Petric R, Briggs JR, et al. Differences in ultrasonic vocalizations between wild and laboratory california mice (Peromyscus californicus) PLoS ONE. 2010;5:e9705. doi: 10.1371/journal.pone.0009705. [DOI] [PMC free article] [PubMed] [Google Scholar]
- Kirzinger A, Jürgens U. The role of extralaryngeal musles in phonation of subhuman primates. J Comp Physiol A. 1994;175:215–222. doi: 10.1007/BF00215117. [DOI] [PubMed] [Google Scholar]
- Kempster GB, Larson CR, Kistler MK. Effects of electrical stimulation of cricothyroid and thyroarytenoid muscles on voice fundamental frequency. J Voice. 1988;2:221–229. doi: 10.1044/jshr.3004.552. [DOI] [PubMed] [Google Scholar]
- Ladich F, Fine M. Sound-generating mechanisms in fishes: a unique diversity in vertebrates. Commun Fishes. 2006;1:3–43. [Google Scholar]
- Larson CR. On the relation of PAG neurons to laryngeal and respiratory muscles during vocalization in the monkey. Brain Res. 1991;552:77–86. doi: 10.1016/0006-8993(91)90662-f. [DOI] [PubMed] [Google Scholar]
- Loeb GE, Gans C. Electromyography for experimentalists. Chicago, London: University of Chiccago Press; 1986. [Google Scholar]
- Nunez AA, Pomerantz SM, Bean NJ, Youngstrom TG. Effects of laryngeal denervation on ultrasound production and male sexual behavior in rodents. Physiol Behav. 1985;34:901–905. doi: 10.1016/0031-9384(85)90011-3. [DOI] [PubMed] [Google Scholar]
- Riede T. Subglottal pressure, tracheal airflow and intrinsic laryngeal muscle activity during rat ultrasound vocalization. J Neurophysiology. 2011;106:2580–2592. doi: 10.1152/jn.00478.2011. [DOI] [PMC free article] [PubMed] [Google Scholar]
- Roberts LH. The functional anatomy of the rodent larynx in relationship to ultrasonic and audible cry production. Zool J Linn Soc. 1972;56:255–264. [Google Scholar]
- Roberts LH. The rodent ultrasound production mechanism. Ultrasonics. 1975a;13:83–88. doi: 10.1016/0041-624x(75)90052-9. [DOI] [PubMed] [Google Scholar]
- Roberts LH. Evidence for the laryngeal source of ultrasonic and audible cries of rodents. J Zool Lond. 1975b;175:243–257. [Google Scholar]
- Sanders I, Weisz DJ, Yang BY, Fung K, Amirali A. The mechanism of ultrasound vocalization in the rat. Soc Neurosci Abstr. 2001;27:241. [Google Scholar]
- Smith WJ. Study of ultrasonic communication. Amer Zool. 1979;19:531–538. [Google Scholar]
- Smotherman M, Kobayasi K, Ma J, Zhang S, Metzner W. A mechanism for vocal–respiratory coupling in the mammalian parabrachial nucleus. J Neurosci. 2006;26:4860–4869. doi: 10.1523/JNEUROSCI.4607-05.2006. [DOI] [PMC free article] [PubMed] [Google Scholar]
- Sonninen A, Hurme P, Laukkanen A-M. The external frame function in the control of pitch, register and singing mode: radiographic observations of a female singer. J Voice. 1999;13:319–340. doi: 10.1016/s0892-1997(99)80039-3. [DOI] [PubMed] [Google Scholar]
- Suthers RA, Goller F, Pytte C. The neuromuscular control of birdsong. Philos Trans R Soc Lond B. 1999;354:927–939. doi: 10.1098/rstb.1999.0444. [DOI] [PMC free article] [PubMed] [Google Scholar]
- Takahashi N, Kashino M, Hironaka N. Structure of rat ultrasonic vocalizations and its relevance to behavior. PLoS ONE. 2010;5:e14115. doi: 10.1371/journal.pone.0014115. [DOI] [PMC free article] [PubMed] [Google Scholar]
- Wetzel DM, Kelley DB, Campbell BA. Central control of ultrasonic vocalization in neonatal rats. I. Brain stem motor nuclei. J Comp Physiol Psychol. 1980;94:596–605. doi: 10.1037/h0077699. [DOI] [PubMed] [Google Scholar]
- Wilson TA, Beavers GS, Decoster MA, Holger DK, Regenfuss MD. Experiments on the fluid mechanics of whistling. J Acoust Soc Am. 1971;50:366–372. [Google Scholar]
- Wöhr M, Schwarting RKW. Ultrasonic communication in rats: can playback of 50-kHz calls induce approach behavior? PLoS ONE. 2007;2:e1365. doi: 10.1371/journal.pone.0001365. [DOI] [PMC free article] [PubMed] [Google Scholar]
- Wright JM, Gourdon JC, Clarke PBS. Identification of multiple call categories within the rich repertoire of adult rat 50-kHz ultrasonic vocalizations: effects of amphetamine and social context. Psychopharmacology. 2010;211:1–13. doi: 10.1007/s00213-010-1859-y. [DOI] [PubMed] [Google Scholar]
- Yajima Y, Hayashi Y, Yoshii H. The midbrain central gray substance as a highly sensitive neural structure for the production of ultrasonic vocalization in the rat. Brain Res. 1980;198:446–452. doi: 10.1016/0006-8993(80)90759-3. [DOI] [PubMed] [Google Scholar]
- Yajima Y, Hayashi Y. Ambiguous motoneurons discharging synchronously with ultrasonic vocalization in rats. Exp Brain Res. 1983;50:359–366. doi: 10.1007/BF00239201. [DOI] [PubMed] [Google Scholar]
- Yamaguchi A, Kelley DB. Generating sexually differentiated vocal patterns: laryngeal nerve and EMG recordings from vocalizing male and female African clawed frogs (Xenopus laevis) J Neurosci. 2000;20:1559–1567. doi: 10.1523/JNEUROSCI.20-04-01559.2000. [DOI] [PMC free article] [PubMed] [Google Scholar]


