

Abstract
The author responds to criticisms that his and his coauthor’s estimates of overdiagnoses with mammography screening are “based on faulty science” by reviewing the statistical analyses and comparing global data with those of Connecticut.
In this report, I address the issues raised by the author of the accompanying article [1] that criticizes our report in the New England Journal of Medicine [2] as “egregious,” “based on faulty science” with “questionable” methods and “incorrect conclusions,” and an “excellent example of a failure of peer review” that “should have never been published and should be withdrawn.” The critic states that “using [our] methods, but with a more accurate extrapolation, there is no evidence of overdiagnosis of invasive breast cancer” and “contrary to [our] assertion, the rate of late-stage cancer has dropped dramatically.” In this response, I focus on the criticisms levied against us and do not attempt to address the critic’s many other concerns about the limitations of screening mammography that have been raised during the past years.
Methods
Before defending our findings, I should repeat and further explain several terms defined and methods used in our report, as well as indicate how I updated analyses we performed 2 years ago.
Early- and Late-Stage Breast Cancer
We used Surveillance, Epidemiology, and End Results (SEER) historic stage A as the foundation for our categorization of early- and late-stage cancer. The four stages in this system are (a) in situ disease; (b) localized disease, defined as invasive cancer that is confined to the organ of disease origin; (c) regional disease, defined as disease that extends outside of and adjacent to or contiguous with the organ of disease origin (in breast cancer, most regional disease indicates nodal involvement, not direct extension); and (d) distant disease, defined as metastasis to organs that are not adjacent to the organ of disease origin. We restricted in situ cancers to ductal carcinoma in situ (DCIS), specifically excluding lobular carcinoma in situ, because DCIS is uniformly treated as cancer and in situ lobular carcinoma is not, as further explained below. We defined early-stage cancer as DCIS or localized disease and late-stage cancer as regional or distant disease.
The Average Annual Percentage Change of Incidence Rate
This calculation, along with its variance values (confidence intervals, significance test, etc.), is provided by the SEER program [3]. The least squares regression line is fitted to the natural logarithm of the rates, using the calendar year as a regressor variable, with n = number of years, r = incidence, y = ln(r), x = calendar year, y = mx + b, and average annual percentage change (AAPC) = 100 × (em – 1). We selected the age-adjusted and weighted least squares methods of two options offered by SEER. (We did not have to perform the calculation.)
Best Guess Estimate of Trend in Breast Cancer Incidence
Each of three methods we used to estimate breast cancer incidence trends was applied a priori as a point estimate for our statistical analysis hypothesis. To adjust for changes in the underlying incidence, we examined incidence trends in the portion of the population that generally did not have exposure to screening: women younger than 40 years of age. In this age group, the SEER calculation for the AAPC from 1979 through 2008 was 0.25% per year (95% confidence interval [CI], 0.04–0.47) for all breast cancer including in situ forms. To account for this growth, we repeated our analysis, allowing our baseline incidence among women 40 years of age or older to increase by this SEER-derived AAPC rate of 0.25% per year. We called this estimate the “best guess” and applied it to both early- and late-stage disease.
Extreme and Very Extreme Estimates of Trend in Breast Cancer Incidence
We also wanted to provide estimates that were biased in favor of screening mammography—ones that would minimize the surplus diagnoses of early-stage cancer and maximize the deficit of diagnoses of late-stage cancer. In our extreme estimate, we doubled the best guess estimate assumption to 0.50% per year, which was greater than the upper limit of the 95% confidence interval (more than 2 standard deviations above the mean) for the SEER-generated AAPC of the unscreened population. [SEER’s update to 2010: AAPC (CI) = 0.26 (0.07–0.46), which not only keeps our best guess assumption above the upper CI but sets it at the 99th percentile.] For our very extreme estimate, we used the same rate as in our extreme estimate (AAPC = 0.50) but also assumed that the decrease in late-stage cancer began at the highest rate of late-stage disease recorded by SEER, in 1985, of 113 cases per 100,000 women, thereby maximizing the decline in diagnoses of late-stage cancer.
Calculation of Overdiagnosis Rate
In our original report, we calculated the absolute change in the incidence of early- and late-stage cancer from a 3-year average before screening mammography was implemented in the U.S., 1976–1978 to 2006–2008, also a 3-year interval, 3 decades later, and after an interim of increased incidence during 1990–2005 that was associated with hormone-replacement therapy [4]. As described above, we corrected for a baseline (background, underlying) rate by assuming it was 0.25% per year in our best guess model and 0.50% per year in our extreme and very extreme estimates.
Because SEER did not track screening mammography, our overdiagnosis estimate is of all breast cancer and not of screened cases. Examples of all three of our estimates are shown in Table 1, with an update as described in the next paragraph. We also did not express our overdiagnosis estimates as the rate recommended by others to be a ratio of those overdiagnosed versus those not overdiagnosed, such as our best guess of 31% being a rate of 45% (31%/69%) [5].
Table 1.
Overdiagnosis estimates of breast cancer during 2006–2010 corrected for baseline incidence increases according to best guess, extreme, and very extreme estimates, United States

Updating of SEER Data to 2010
Because it has been 2 years since we performed the analyses for our original report, I have added where appropriate the most recent SEER data [3] that enable us to update the concluding year in our report from 2008 to 2010. The updated data are shown in brackets ([..]) in the text and in Figure 1. Table 1 includes an update to 2010 in addition to serving as an example of how overdiagnosis rate estimates were calculated. In it, a 5-year interval, 2006–2010, is compared with the original prescreening 3-year interval (1976–1978), as justified by data that disclose little change in the incidence rates during the additional years (supplemental online Figure 1, lower panel). Using the AAPC in overall breast cancer incidence during 1979–2010 in women younger than 40 years of age [0.27 (CI: 0.07–0.46)] and extending the baseline assumption to 2010 by assuming that the baseline increase was constant from 1979 to 2010 yield overdiagnosis rates for 2006–2010 of 30%, 24%, and 22%, respectively, for our best guess, extreme assumption, and very extreme assumption.
Figure 1.

Annual incidence of early- and late-stage breast cancer in women younger than 40 years of age, 1976–2010, Surveillance, Epidemiology, and End Results 9 (lower panel reproduced from Figure 1 of Bleyer and Welch [2] with 2009 and 2010 data added, in brackets) and in women 35 to 39 years of age at diagnosis (upper panel). The straight red lines are linear regressions of the late-stage incidence for 1980–2010. Lower panel from New England Journal of Medicine, A Bleyer, HG Welch, “Effect of three decades of screening mammography on breast-cancer incidence”, 2012;367:1998–2005. Copyright © 2012 Massachusetts Medical Society. Reprinted with permission.
The 30% best guess rate is 1% less than in our original report because of the assumption that the rate in baseline increase was constant for all years including 2009 and 2010 and because the incidence of early-stage disease declined from 2009 to 2010 (supplemental online Figure 1, lower panel). The decline from 2009 to 2010 in early-stage disease may be due to a decrease in screening mammography that has been attributed to the release in 2009 of U.S. Preventive Services Task Force recommendations to decrease screening (supplemental online Figure 1, upper panel) [6].
Contrary to Our Assertion, the Rate of Late-Stage Cancer Has Dropped Dramatically
First, we did assert, as described by the critic, that in order for screening to be efficacious, it must reduce the number of “late-stage” cancers. The critic contends, however, that we “underestimated the decline in late-stage cancer” because we did not adequately correct for the increase in late-stage tumors in women younger than 40 years of age. According to the critic, “the number of late-stage cancers appears to have increased among the younger women from 5/100,000 to 6/100,000 over the time period, a change of 20%.” He then argues that if this rate of change is applied to the data we used for older women, the rate of late-stage cancers would have dropped “23%, which is more than 3 times the decline that [we] suggest.”
The lower panel in Figure 1 reproduces the figure in our report that the critic used to estimate the increase (with values for 2009 and 2010 added and a regression of the late-stage data). To describe the late-stage incidence as having increased in unscreened women by 20% is not obvious in the figure. According to the SEER program, the late-stage AAPC for 1976–2008 is 0.17 (CI: −0.17 to 0.51), which is equivalent to a total increase of 5.1% over 30 years and much less than the visual 20% extrapolation by the critic. Moreover, the increase was not statistically significant (p = .31), with no increase at all well within the 95% confidence interval. [Update to 2010: AAPC = 0.21 (CI: 0.09–0.51)].
The 35- to 39-year-old age group may be more representative of the underlying incidence trend in unscreened women because most of the unscreened population is in this age group and it is the age group closest to the screened population of 40+ years. The upper panel in Figure 1 shows this age group and again demonstrates no significant increase in incidence in late-stage disease, with the AAPC for 1976–2008 as 0.20 (CI: –0.11 to 0.52) and p = .19, Hence, the decline that the SEER data indicated for late-stage breast cancer in women older than 40 years of age during 1976–2008 stands as reported at 8% as our best guess estimate and pales by comparison with the 109% increase in early-stage disease. As stated by the Nordic Cochrane Center, “When screening doesn’t decrease advanced cancers, it cannot work” [7, 8].
Breast Cancer Incidence Increased 1% per Year Prior to Screening Mammography (1940–1970)
Figure 3 in the critic’s report states that “based on 1976–1978, Bleyer and Welch estimate 0.25% per year increase in breast cancer incidence had there been no screening as their projected baseline.” This is incorrect. We based the incidence increase over a 30-year interval from 1979 to 2008 concurrent with the same years that we evaluated for overdiagnosis. We did not base the background increase “on 3 years,” as the critic repeats later in the report. Instead, as described above, we derived the rate from a contemporaneous unscreened population (women younger than 40) whose AAPC in incidence, together with the 95% CI, was provided by the SEER program.
The critic states that in using 0.25% increase per year to correct for a baseline increase in breast cancer incidence, we “ignored far more robust data provided by the Connecticut Tumor Registry going back 40 years to 1940,” which “showed that the rate of invasive cancers had been increasing steadily at 1% per year.” What the critic does not mention is that we also reported results with a baseline incidence AAPC assumed to be 0.50% as described above. This assumption resulted in an overdiagnosis estimate of 26% of all cases of breast cancer, including DCIS, diagnosed in the U.S. in 2008, in comparison with 31% with the 0.25% per year baseline increase assumption. The estimated number of American women overdiagnosed to have breast cancer, including DCIS, in 2008 was 74,000 with the 0.25% per year baseline assumption and 62,000 with the 0.50% per year baseline assumption.
The central issue of the baseline incidence trend is why any increase 40 to 70 years ago during 1940–1970 should be used to assume incidence patterns during 1980–2010. Why would an estimate from the middle of the last century be expected to have continued during the past three decades? Why assume that the baseline (background, underlying) breast cancer incidence has remained constant over an interval of 70 years? Data from the State of Connecticut itself [8] underscore these issues, as shown in Figure 2. None of the incidence trends during 1935–1973 in the state's 12 most frequent malignancies other than breast cancer predicted the trend thereafter. Nine declined, four accelerated, and one accelerated then declined (Fig. 2). Six started in 1935, a near-zero incidence (Fig. 2).
Figure 2.

Annual incidence of common cancers in women 40 years of age and older in Connecticut, 1973–2010. The solid blue lines are linear regressions (with lung cancer an exception) of incidence rates during 1935–1973. The dotted blue lines are projections to 2010 of the trend prior to 1973. The solid brown lines are linear regressions of the Surveillance, Epidemiology, and End Results (SEER) 1973–2010 era.
The universal increase in cancer incidence during 1935–1975 and a predominance of either near-zero starts or decreasing incidence are consistent with increased reporting and not a true increase in incidence. These patterns are concordant with the Connecticut Tumor Registry’s initial focus on survival and not incidence, being limited in the beginning to cases admitted to hospitals and by the challenges of World War II [9]. Eventually reporting of all cases was fully implemented and true statewide population-based incidence data became available after the accrual “ramping up.” If anything, this consideration alone would have predicted that the rate of increase in breast cancer incidence in Connecticut would likely have slowed if screening mammography had not been initiated.
Clearly, concurrent incidence trends in unscreened populations provide a more accurate assessment. That is why we chose for the same years during which we evaluated overdiagnosis (1979–2008) to assess the incidence trends in women younger than 40 years of age who were, with some exceptions, not screened. The exceptions include women who had a baseline mammogram at the age of 35 in preparation for annual screening at the age of 40, as once recommended by the American Cancer Society, and those considered to be at high risk because of familial breast cancer or a known predisposing mutation such as in BRCA1 or BRCA2. To the extent that these exceptions also increased the incidence in women younger than 40 years of age, we may have actually overestimated an underlying incidence increase not due to screening. Moreover, the trends in increased incidence in more modern times such as due to older age at menarche [10], the choice to have a first pregnancy later in life [10], and decreased and delayed breast feeding [11, 12] are not only more appropriate for the era since 1980 but also present, if not more so, in women younger than 40 years of age. To rely on incidence trends before these factors became as prevalent as they are now cannot be as accurate as concurrent trends.
In case there is concern that younger women are substantively different from older women in incidence patterns, we compared the oldest of the unscreened, younger age group (age 35–39) with the youngest of the screened age group (age 40–44) and found that (a) the incidence trends of invasive cancer (Fig. 3, dotted curves) were parallel, and (b) the impact of screening did not occur discretely in the 35- to 39-year-olds until 1983, before which there was no evidence for an increase in incidence for the 8 years prior to 1976 (Fig. 3, red lines). The stable incidence for 8 years is unlikely due, as attributed by the critic, to the transient increase for 2 years followed by a postincrease dip that may occur with a population-wide surge in early detection.
Figure 3.

Annual incidence of breast cancer in 35- to 39- and 40- to 44-year-old women, 1973–2010, Surveillance, Epidemiology, and End Results 9. Dotted curves indicate invasive cancer and solid curves indicate all cancer, including in situ.
The critic supports his preference for the 1% per year baseline value by pointing out that “as would be expected, SEER data from 2006–2009 show that the incidence of invasive cancers, once again, began to increase and at a rate of 1% per year.” On the contrary, SEER 9 data tell us that the annual incidence of invasive breast cancer (excluding DCIS) in women 40 years of age and older that was not associated with hormone-replacement therapy has been constant since 1987 at 275 (CI: 265–275) per 100,000 in all nine SEER registries and relatively constant at 302 (CI: 285–317) in Connecticut (Fig. 4). Connecticut had a higher rate of invasive breast cancer detection including localized disease, but no essential difference in comparison with the SEER average in regional disease, both in overall incidence and reduction. This also suggests that a relative steady state occurred during the past two decades and that the trend of increasing incidence during 1940–1970 in Connecticut is no longer directly relevant, as suggested by the data in Figure 2. The critic’s own Figure 2, produced here in Figure 5 with an additional year (2010) of data added, does not demonstrate an increase after 2003 when the hormone-replacement peak of increased incidence subsided (red circled portion) [4].
Figure 4.

Steady state incidence since 1990 in invasive breast cancer not due to hormone-replacement therapy (HRT) in women 40 years of age and older in Connecticut and in Surveillance, Epidemiology, and End Results (SEER) 9. The bold curves designate all nine SEER registries; the lighter curves represent Connecticut. Horizontal lines indicate mean value after impact on incidence stabilized and “HRT years” are excluded.
Figure 5.

Annual incidence of invasive breast cancer in women of all ages, 1975–2010, Surveillance, Epidemiology, and End Results (SEER) 9. Adapted from age-adjusted SEER incidence of breast cancer 1975–2010 (figure in [1]), with an additional year (2010) of data from SEER added. The circled area designates the change in incidence, or lack thereof, of invasive breast cancer incidence during 2003–2010.
Let’s also examine the report on Connecticut data that the critic relies on to eliminate overdiagnosis in his deductions. The actual and only statement in the cited report regarding incidence is from the American Cancer Society [13]: “Between 1940 and 1980, breast cancer incidence in this registry rose an average of 1% per year.” First, no data are provided in the report to substantiate the statement. Second, the “1% per year” was likely rounded to the nearest whole number because no decimal was provided. Third, the 1% per year estimate was based on a single geographic registry that in 1950 was 1.3% of the population of the U.S. Fourth, Connecticut has not been typical of the rest of the U.S. in incidence patterns of breast cancer as described below. Fifth, and most important, it included the distinct increase in breast cancer incidence during the 1970s that was due to a national increase in awareness of breast cancer during the early 1970s and was further precipitated in 1974 by the public announcements of breast cancer diagnoses in First Lady Betty Ford and the Vice President’s wife Happy Rockefeller, (the 1974–1975 spike in the chart), as also mentioned by the author of the report that criticizes our work. To some extent it also included the first years of screening mammography that by the late 1970s was estimated to be used by 5%–10% of age-eligible women in any given year [14].
Not only is Connecticut a small sample (∼1%) of the U.S., it is not representative of trends in breast cancer incidence in the U.S. As shown in Figure 6, the state has had, since 1973, the greatest increase of all 9 registries in the incidence of early-stage cancer (upper panel), which has been attributed to Connecticut having one of the most effective statewide screening mammography programs in the country [15]. It has also had the highest increase of the 9 original SEER registries in the incidence of breast cancer among women 35 to 39 years of age (lower panel), with a 1976–2010 AAPC that was 2.4 times greater than the AAPC for all registries: 0.84 (CI: 0.47–1.23) versus 0.35 (CI: 0.14–0.57). That 35- to 39-year-old women in Connecticut have had the greatest breast cancer increase among the original SEER registries is likely due to the impact of the state’s screening initiative and is supported by the observation that the breast cancer AAPC for women younger than 35 years of age is average among the original 9 SEER registries (supplemental online Fig. 2). By 2000–2010, when data from 18 SEER registries became available, Connecticut was first in breast cancer incidence and had the only registry with a rate exceeding 400 new cases per 100,000 per year (supplemental online Fig. 3).
Figure 6.

Breast cancer incidence in SEER 9 registries since 1976. Upper panel: Increase in annual incidence of in situ and localized breast cancer from prescreening mammography (1976–1985) to postscreening steady state (1995–2010), age 40 and older. Lower panel: Average annual percentage change (AAPC) in breast cancer incidence 1976–2010 among women 35 to 39 years of age.
A better source for the trend prior to the screening era are the National Cancer Institute surveys in multiple regions in the U.S. specifically selected to be more representative than Connecticut of national incidence and trends. The survey in 1947–1948, known as the second National Cancer Survey [15], included 10 metropolitan areas in three regions of the U.S. (north, south, and west). The survey in 1969–1971, known as the third National Cancer Survey [16], covered nine geographic areas with a combined population of 21 million people, 10.3% of the U.S. population at the time, nearly 10-fold that of Connecticut. Five of these areas reported breast cancer incidences in the 1950s and 1960s and ultimately became part of the SEER registry system.
A report of data from five of the geographic areas (Atlanta, Detroit, Connecticut, Iowa, San Francisco/Orlando) had the breast cancer incidence in white females increased from 74.6 to 79.4 per 100,000 from 1947-1950 to 1969-1971 [16a], which translates into an AAPC of 0.30. The American Cancer Society report cited a report from the National Cancer Institute that included the both the national survey data and early SEER data in a graph (Fig. 7) that showed that the rate per 100,000 white women increased from 74.8 in 1950 to 76.9 in 1969 [17]. This graph also shows the increase after 1970 (between the blue and purple vertical dashed lines) due to the surge of national awareness of breast cancer during the 1970s and the beginning of screening mammography as described above. From the figure, the values of 74.8 and 79.9 per 100,000 white females for 1950 and 1970, respectively, and prior the onset of screening mammography and the surge in breast cancer awareness indicate that the AAPC was 0.35 prior to 1970. The 0.35% per year from 1950 to 1970 is between the assumptions of 0.25% and 0.5% per year for 1976–2008 that we used for our analyses (supplemental online Fig. 4).
Figure 7.

Incidence of breast cancer in white females from 1950 to 1985 according to five areas and Surveillance, Epidemiology, and End Results (SEER) 9 data. All black elements are from the original figure in Kessler et al. [17].
What if Connecticut with its higher-than-average increase in breast cancer incidence is evaluated separately for overdiagnosis? Figure 8 shows the state with its 1940–1975 trend for all breast cancer in women 40 years of age and older [8] and the subsequent trends until 2010 for all, late-stage, and early-stage breast cancer in the same age group, along with the incidence of all breast cancer in women younger than 40 years of age. If the AAPC of 0.62 generated from the increase in women younger than 40 years of age is used for the baseline incidence increase, the overdiagnosis rate during 2006–2010 was 25%. If an AAPC of 1.0% is applied under the assumption that the rate during 1935–1975 is projected to occur until 2010, the overdiagnosis rate in the state was 15%.
Figure 8.

Annual breast cancer incidence in women in Connecticut of age 40 and older since 1935 [8] and by extent of disease at diagnosis and of age younger than 40 years of age after 1973 when Connecticut became a Surveillance, Epidemiology, and End Results (SEER) site. Abbreviation: DCIS, ductal carcinoma in situ.
And if despite all of the above concerns, we nonetheless use a 1.0% per year increase in incidence for the national baseline, we would still estimate that 880,000 and 34,000 women in the U.S. were overdiagnosed during 1979–2008 and 2008, respectively, with an overdiagnosis rate of 14% in 2008 (Fig. 9). (For 1979–2010 and 2010, the respective values are 937,000 and 29,000.) And if Connecticut should be relied on, the state itself has reported a 40% rate of overdiagnosis among its breast cancer patients (Table 2) [18]. That 40% for Connecticut is higher than the national rate we derived is consistent with Connecticut having a more aggressive screening program and further underscores the impact of overdiagnosis. That the rate of decrease in breast cancer mortality by SEER region is independent of the amount of screening conducted in the region [19] is also indicative of a relative lack of screening benefit.
Figure 9.

Cumulative number of women diagnosed with early- and late-stage breast cancer since 1979, age 40 and older, Surveillance, Epidemiology, and End Results 9.
Table 2.
National Comprehensive Cancer Network (NCCN) and breast cancer expert survey of treatment recommendations for the histologic types of in situ breast carcinoma

Finally, as a minor point but one that is indicative of another misunderstanding, Figure 2 in the critic’s report identifies the incidence peak at 1999 as being due to “participation in screening that plateaus in 1999 and incidence heads back down to the baseline.” This is also not correct. The peak is due to national use of hormone-replacement therapy that transiently increased breast cancer incidence, as we explained in the Methods section of our report (also shown in Fig. 4) and is a widely accepted conclusion [4].
Exclusion of DCIS From Overdiagnosed Cases of Cancer?
The critic then admonishes us to exclude DCIS in our early-stage breast cancer assessment. Yet, as we previously remarked [20], how could we estimate overdiagnosis and not include an abnormality that is detected nearly exclusively only by mammography and is treated as cancer? As David Seidenwurm of the Diagnostic Division of Radiologic Associates of Sacramento stated, “We cannot discuss mammography without DCIS any more than we can discuss DCIS without mammography” [21].
Before beginning our analysis, we surveyed breast cancer surgeons and medical oncologists at Harvard University/Dana Farber Cancer Institute, the University of Texas MD Anderson Cancer Center, and the University of North Carolina to determine how they regard DCIS. Not only did every respondent indicate that s/he would treat with either a total mastectomy followed by at least 5 years of hormonal therapy or with a lumpectomy and total breast radiation and the same years of hormonal therapy, they also did so for all 12 in situ categories that were not pure lobular carcinoma or lobular carcinoma with other carcinoma in situ (Table 2). In addition, the National Comprehensive Cancer Network recommends cancer therapy for DCIS as follows in order of preference based on level of evidence: (1) lumpectomy with reresection if margins are positive, without lymph node surgery and with whole breast radiation therapy, followed by 5 years of tamoxifen hormone therapy especially for those with estrogen-receptor positive DCIS; (2) total mastectomy with or without sentinel node biopsy and with or without breast reconstruction; (3) lumpectomy with reresection if margins are positive, without lymph node surgery and without whole breast radiation therapy, followed by 5 years of tamoxifen hormone therapy especially for those with estrogen-receptor positive DCIS. In all cases, the National Comprehensive Cancer Network also recommends risk assessment and reduction therapy for the contralateral breast that may include mastectomy (bilateral) and/or at least 5 years of tamoxifen or raloxifene therapy.
Moreover, prior to 1980 and screening mammography, SEER data show that 6% of DCIS patients died of breast cancer within 20 years. Since 1985 and the advent of screening mammography, however, the breast cancer-specific death rate of all 147,325 women in the SEER database diagnosed with DCIS has been only 2.59% (CI: 2.43%–2.76%) at 15 years after diagnosis. One might interpret this to be good news in that the prognosis of DCIS appears to have improved. An alternative explanation is overdiagnosis of nondisease, particularly in such a large number of women. The 15-year DCIS survival rate is so high—it is more than 97% and greater than any of the 20 most frequent cancers including nonmalignant subtypes (supplemental online Table 1) and all of the other cancers shown in Figure 2— that the next closest 15-year cancer-specific survival rate, for testicular carcinoma in males, is 4 percentage points lower, at 93.5% (supplemental online Table 1). It is more likely that the diagnosis, not prognosis, has “improved” by including cases of nondisease. We think it would be irresponsible not to include DCIS in a study of the population effects of screening because DCIS hardly existed before screening mammography and is now nearly always detected as a result of screening. The recent call from breast cancer experts in medical oncology and surgery to eliminate the word “carcinoma” from DCIS and rename the entity as “indolent lesions of epithelial origin” [22] derives from the current attitude of treating DCIS as cancer and the need to stop treating all of it as cancer.
If we nonetheless exclude DCIS, the overdiagnosis rate decreases from 31% to 18%. And if we not only completely ignore all the reasons to include DCIS but also use the 1% per year background incidence to completely accommodate the critic, the result is that 325,000 of 5.3 million American women diagnosed to have breast cancer during 1979–2008 were overdiagnosed.
Using [Our] Methods, There Is No Evidence of Overdiagnosis of Invasive Breast Cancer
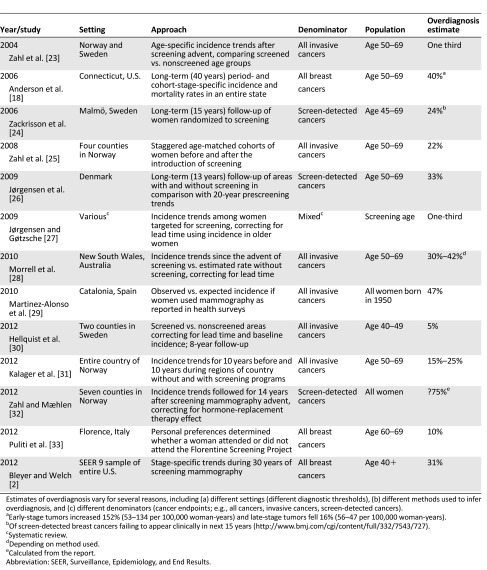
The critic states the “there have been scientific studies that are based on direct patient data that have shown that there is little if any ‘overdiagnosis’” and that the “only way to directly measure overdiagnosis is from the RCTs [randomized controlled trials].” In making these points, the critic may have missed the summary table of prior estimates of overdiagnosis we provided in our original supplemental online Appendix (repeated here in Table 3). The average overdiagnosis estimate in 12 studies from seven countries, including results from randomized controlled trials and retrospective general population studies, was 31.5%, 28% among studies in which the denominator was all cancer, and 24%, 33%, and 75% in 3 studies in which it was screen-detected cancers [18, 23–33]. Our best guess estimate of 31% is in the “middle of the pack.”
Table 3.
Studies of breast cancer overdiagnosis associated with screening mammography (supplemental online Appendix in [2])
Furthermore, all of the RCTs were conducted decades ago. The one RCT conducted in the U.S. began a half-century ago (1963) and all the others except one began more than 30 years ago (Table 4) [34–47]. The general population studies of overdiagnosis have been conducted since 2000 and reported during the last 7 years (Table 3). Reduced breast cancer mortality was found back then in trials in Europe and the U.S. but not in Canada. All-cause mortality was found to be unaffected by screening, however, in all of the RCTs. The RCTs of decades ago have been rendered less relevant today by (a) subsequent improvements in diagnosis, staging, and treatment, especially adjuvant therapy with hormonal therapy and chemotherapy that was in its infancy during the years of the RCTs; (b) improved efficiency, centralization, and increased expertise within our health care systems; and (c) a markedly increased breast cancer awareness as women seek medical help (and undergo diagnostic mammography) much earlier today if they find anything unusual. Ironically, increased awareness confers less opportunity for screening mammography to reduce the incidence of advanced cancer. Moreover, retrospective analyses of the trials have revealed deficiencies such as more surgery and radiation in women randomized to be screened and differential misclassification of cause of death in the favor of the screened group [48–50].
Table 4.
Randomized controlled trials of screening mammography for early breast cancer detection [34]

RCTs of screening interventions are much more complex than treatment RCTs, with lead time and length biases inherent to screening trials that limit interpretation. Retrospective population studies have the advantage of analyzing more current trends, those of the immediate past decades instead of the more than four decades when women were enrolled in the RCTs. In the most recent population study report, from the University of Oxford, there was no evidence in England that declines in mortality rates were consistently greater in women in age groups and cohorts that had been screened at all, or screened several times, than in other (unscreened) women in the same time periods, from 1971 to 2009 [51]. The RCTs designed more than 30 years ago are just not of the quality of those performed today.
We were also criticized for not accounting for lead time and length bias. The most recent estimate on how long women should be followed after they are screened to thoroughly eliminate lead time bias is 30 years [52]. Time of assessment on the RCTs averaged 12 years and ranged from 8 to 19 years (Table 4). Our study covered 33 years of data, from 1976 to 2008 and now 35 years with updating to 2010.
As to evidence of overdiagnosis of invasive breast cancer per se, we did estimate the frequency of overdiagnosis of invasive breast cancer in our original report [2] under the assumption that all cases of DCIS were overdiagnosed. This analysis suggested that invasive disease accounted for about half of all overdiagnoses and that about 20% of all invasive breast cancers were overdiagnosed, estimates that replicate those of other studies [26]. To the extent that less than 100% of DCIS is overdiagnosed, the amount of invasive disease that is overdiagnosed must be proportionately greater. Eliminating DCIS does not eliminate the problem.
Faulty Science? Intentional Effort to Dilute and Corrupt Estimates? Withdraw Our Report?
On a personal note, these statements, repeated in part from a prior op-ed [53], are disappointing. After 53 years as a student of science that began with undergraduate studies with Nobel laureates in medicine and molecular biology at M.I.T. and a thesis at the Harvard School of Public Health, it is hard not being offended. I was an advocate for screening mammography during the 1980s as an American Cancer Society Professor of Clinical Oncology. During the 1990s, my research included neuroblastoma screening, during which infants were needlessly treated with surgery and multiagent chemotherapy, before I learned that this screening had no mortality benefit [54]. In 2005–2006, I codirected a phase II trial of lung cancer screening [55]. I have also undergone colorectal and prostate cancer screening and have since been studying cancer screening, overdiagnosis, and overtreatment in adults and posting peer-reviewed literature and commentary on these topics [56].
Both my coauthor and I are disappointed by the critic’s comments because to mitigate the problem of overdiagnosis, primary care practitioners, surgeons, oncologists, and the public health community will all need the help of our colleagues in mammography. And the first step in addressing any problem is to acknowledge it. Another concern is that the critic may have conflicts of interest that could impact his outlook on this subject.
We believe that we have an ethical responsibility to alert women to this phenomenon. Most patient-education aids do not even mention overdiagnosis, and most women are not aware of its possibility. A recent poll in Australia demonstrated how little women in Sidney suburbs knew about overdiagnosis associated with screening mammography [57]. Effective communication about overdiagnosis of breast cancer will require great care—and evaluation to determine how best to do it; otherwise, women may become fearful or angry. Just because communicating with patients will be difficult does not mean that we should not tackle this problem. Informed women deserve no less when deciding about breast cancer screening, particularly as recently reported, if the amount of distress of a false-positive mammogram is the same for at least half a year and not fully recovered at three years afterward as it is for those who are diagnosed to have breast cancer and treated with mastectomy or lumpectomy and radiation and hormonal therapy [58].
Screening mammography does have some benefits. We did find objective value to screening in our analyses (e.g., the 8% reduction in late-stage cancer), and we do not agree with those who argue that all breast cancer screening should cease [59]. On the contrary, prior research has shown some benefit in breast cancer mortality reduction, albeit not all-cause mortality (Table 4), and decreased morbidity from diagnosis at an earlier stage requiring less therapy. For a distinct minority of American women (who we cannot identify), screening is beneficial. What we recommended was that women should be offered the choice after understanding more about potential harms, including overdiagnosis, than they generally have in the past. This author supports the 2009 U.S. Preventive Services Task Force recommendations of 13 mammograms from age 50 to 75 at every-other-year intervals [60] instead of older guidelines of annual mammograms from age 40 on that would administer as many as 40 or more mammograms in the average woman’s lifespan. As with all screening procedures, however, even the more conservative U.S. Preventive Services Task Force recommendations harbor harms that need better heed by professionals, our patients, and the public.
The question is whether on balance screening may be doing more harm than good [61]. Perhaps the situation is best described by Joann G. Elmore, M.D., M.P.H., and Suzanne W. Fletcher, M.D., of the University of Washington School of Medicine and Harvard Medical School, respectively, who in April of last year predicted that the challenge of breast cancer overdiagnosis will get worse, especially in the U.S. [62]:
Instead of focusing on the exact extent of overdiagnosis, it is time to agree that any amount of overdiagnosis is serious and to start dealing with this issue now. Ultimately, better tools are needed to reliably identify which breast cancer will be fatal without treatment and which can be safely observed over time without intervention, but we cannot wait for these tools to be developed. Mammographers, especially those in the United States, could help by considering changes in the threshold for calling a mammographic feature abnormal. Evaluating strategies for observing change in some lesions over time instead of recommending an immediate biopsy has been suggested. This may be a tough sell for women with anxiety as a result of the “watch-and-wait” approach, as well as for radiologists who do not want to miss any sign of disease and fear malpractice lawsuits. Nevertheless, unless serious efforts are made to reduce the frequency of overdiagnosis, the problem will probably increase as newer imaging modalities, such as breast magnetic resonance imaging, are introduced.
See http://www.TheOncologist.com for supplemental material available online.
Supplementary Material
Footnotes
Editor’s Note: See the related article by Daniel J. Kopans on pages 107–112 of this issue, and the commentary by Martin J. Yaffe and Kathleen I. Pritchard, on pages 103–106.
Disclosures
Archie Bleyer: Sigma Tau Pharmaceuticals (C/A, H).
(C/A) Consulting/advisory relationship; (RF) Research funding; (E) Employment; (ET) Expert testimony; (H) Honoraria received; (OI) Ownership interests; (IP) Intellectual property rights/inventor/patent holder; (SAB) Scientific advisory board
References
- 1.Kopans DB. Arguments against mammography screening continue to be based on faulty science. The Oncologist 2014;19:107–112. [DOI] [PMC free article] [PubMed]
- 2.Bleyer A, Welch HG. Effect of three decades of screening mammography on breast-cancer incidence. N Engl J Med. 2012;367:1998–2005. doi: 10.1056/NEJMoa1206809. [DOI] [PubMed] [Google Scholar]
- 3. Source: Surveillance, Epidemiology, and End Results (SEER) Program ( http://www.seer.cancer.gov) SEER*Stat Database: Incidence - SEER 18 Regs Research Data + Hurricane Katrina Impacted Louisiana Cases, Nov 2012 Sub (1973–2010 varying) - Linked To County Attributes - Total U.S., 1969–2011 Counties, National Cancer Institute, DCCPS, Surveillance Research Program, Surveillance Systems Branch, released April 2013, based on the November 2012 submission.
- 4.De P, Neutel CI, Olivotto I, et al. Breast cancer incidence and hormone replacement therapy in Canada. J Natl Cancer Inst. 2010;102:1489–1495. doi: 10.1093/jnci/djq345. [DOI] [PubMed] [Google Scholar]
- 5.Jørgensen KJ, Gøtzsche PD. Effect of screening mammography on breast cancer incidence. N Engl J Med. 2013;368:677–679. doi: 10.1056/NEJMc1215494. [DOI] [PubMed] [Google Scholar]
- 6.Sharpe RE, Jr, Levin DC, Parker L, et al. The effect of the controversial U.S. Preventive Services Task Force recommendations on the use of screening mammography. J Am Coll Radiol. 2013;10:21–24. doi: 10.1016/j.jacr.2012.07.008. [DOI] [PubMed] [Google Scholar]
- 7.Jørgensen KJ, Keen JD, Gøtzsche PC. Is mammographic screening justifiable considering its substantial overdiagnosis rate and minor effect on mortality? Radiology. 2011;260:621–627. doi: 10.1148/radiol.11110210. [DOI] [PubMed] [Google Scholar]
- 8.Forty-five years of cancer incidence in Connecticut: 1935–79. Natl Cancer Inst Monogr. 1986;70:1–706. [PubMed] [Google Scholar]
- 9.Haenszel W, Curnen MG. The first fifty years of the Connecticut Tumor Registry: Reminiscences and prospects. Yale J Biol Med. 1986;59:475–484. [PMC free article] [PubMed] [Google Scholar]
- 10.Yankaskas BC. Epidemiology of breast cancer in young women. Breast Dis. 2005–2006;23:3–8. doi: 10.3233/bd-2006-23102. [DOI] [PubMed] [Google Scholar]
- 11.Collaborative Group on Hormonal Factors in Breast Cancer Breast cancer and breastfeeding: Collaborative reanalysis of individual data from 47 epidemiological studies in 30 countries, including 50302 women with breast cancer and 96973 women without the disease. Lancet. 2002;360:187–195. doi: 10.1016/S0140-6736(02)09454-0. [DOI] [PubMed] [Google Scholar]
- 12.Helewa M, Lévesque P, Provencher D, et al. Breast cancer, pregnancy, and breastfeeding. J Obstet Gynaecol Can. 2002;24:164–180; quiz 181–184. [PubMed] [Google Scholar]
- 13.Garfinkel L, Boring CC, Heath CW., Jr Changing trends. An overview of breast cancer incidence and mortality. Cancer. 1994;74(Suppl):222–227. doi: 10.1002/cncr.2820741304. [DOI] [PubMed] [Google Scholar]
- 14.Howard J. Using mammography for cancer control: An unrealized potential. CA Cancer J Clin 1987;37:33–48. [DOI] [PubMed]
- 15.Lilienfeld DE. Harold Fred Dorn and the First National Cancer Survey (1937–1939): The founding of modern cancer epidemiology. Am J Public Health. 2008;98:2150–2158. doi: 10.2105/AJPH.2007.117440. [DOI] [PMC free article] [PubMed] [Google Scholar]
- 16.Cutler SJ, Scotto J, Devesa SS, et al. Third National cancer survey—an overview of available information. J Natl Cancer Inst. 1974;53:1565–1575. [PubMed] [Google Scholar]
- 16a.Devesa SS, Silverman DT, Young JL, et al. Cancer Incidence and Mortality Trends Among Whites in the United States, 1947-84. JNCI. . 1987;79(1):701–767. [PubMed] [Google Scholar]
- 17.Kessler LG, Feuer EJ, Brown ML. Projections of the breast cancer burden to U.S. women: 1990–2000. Prev Med. 1991;20:170–182. doi: 10.1016/0091-7435(91)90018-y. [DOI] [PubMed] [Google Scholar]
- 18.Anderson WF, Jatoi I, Devesa SS. Assessing the impact of screening mammography: Breast cancer incidence and mortality rates in Connecticut (1943–2002) Breast Cancer Res Treat. 2006;99:333–340. doi: 10.1007/s10549-006-9214-z. [DOI] [PubMed] [Google Scholar]
- 19.Bleyer A, DiPardo B, Thomas CR. Breast cancer mortality reduction in the U.S. during 1969–2010 was independent of screening mammography in its nine geographically disperse SEER regions: More evidence for less benefit of screening mammography. American Society for Radiation Oncology 55th Annual Meeting Abstract 2761, 2013. Available at http://astro2013.abstractsnet.com/aposter.wcs?entryid=010903 Accessed October 7, 2013.
- 20.Authier P, Boniol M Effect of screening mammography on breast cancer incidence (Correspondence) N Engl J Med. 2013;368:677–679. doi: 10.1056/NEJMc1215494. [DOI] [PubMed] [Google Scholar]
- 21.Seidenwurm D. Counterpoint: The New England Journal of Medicine article suggesting overdiagnosis from mammography screening is scientifically correct and should not be withdrawn. J Am Coll Radiol. 2013;10:320–322; discussion 324. doi: 10.1016/j.jacr.2013.01.017. [DOI] [PubMed] [Google Scholar]
- 22.Esserman LJ, Thompson IM, Jr, Reid B. Overdiagnosis and overtreatment in cancer: An opportunity for improvement. JAMA. 2013;310:797–798. doi: 10.1001/jama.2013.108415. [DOI] [PubMed] [Google Scholar]
- 23.Zahl PH, Strand BH, Maehlen J. Incidence of breast cancer in Norway and Sweden during introduction of nationwide screening: Prospective cohort study. BMJ. 2004;328:921–924. doi: 10.1136/bmj.38044.666157.63. [DOI] [PMC free article] [PubMed] [Google Scholar]
- 24.Zackrisson S, Andersson I, Janzon L, et al. Rate of over-diagnosis of breast cancer 15 years after end of Malmö mammographic screening trial: Follow-up study. BMJ. 2006;332:689–692. doi: 10.1136/bmj.38764.572569.7C. [DOI] [PMC free article] [PubMed] [Google Scholar]
- 25.Zahl PH, Maehlen J, Welch HG. The natural history of invasive breast cancers detected by screening mammography. Arch Intern Med. 2008;168:2311–2316. doi: 10.1001/archinte.168.21.2311. [DOI] [PubMed] [Google Scholar]
- 26.Jørgensen KJ, Zahl PH, Gøtzsche PC. Overdiagnosis in organised mammography screening in Denmark. A comparative study. BMC Womens Health. 2009;9:36. doi: 10.1186/1472-6874-9-36. [DOI] [PMC free article] [PubMed] [Google Scholar]
- 27.Jørgensen KJ, Gøtzsche PC. Overdiagnosis in publicly organised mammography screening programmes: Systematic review of incidence trends. BMJ. 2009;339:b2587. doi: 10.1136/bmj.b2587. [DOI] [PMC free article] [PubMed] [Google Scholar]
- 28.Morrell S, Barratt A, Irwig L, et al. Estimates of overdiagnosis of invasive breast cancer associated with screening mammography. Cancer Causes Control. 2010;21:275–282. doi: 10.1007/s10552-009-9459-z. [DOI] [PubMed] [Google Scholar]
- 29.Martinez-Alonso M, Vilaprinyo E, Marcos-Gragera R, et al. Breast cancer incidence and overdiagnosis in Catalonia (Spain) Breast Cancer Res. 2010;12:R58. doi: 10.1186/bcr2620. [DOI] [PMC free article] [PubMed] [Google Scholar]
- 30.Hellquist BN, Duffy SW, Nyström L, et al. Overdiagnosis in the population-based service screening programme with mammography for women aged 40 to 49 years in Sweden. J Med Screen. 2012;19:14–19. doi: 10.1258/jms.2012.011104. [DOI] [PubMed] [Google Scholar]
- 31.Kalager M, Adami HO, Bretthauer M, et al. Overdiagnosis of invasive breast cancer due to mammography screening: Results from the Norwegian screening program. Ann Intern Med. 2012;156:491–499. doi: 10.7326/0003-4819-156-7-201204030-00005. [DOI] [PubMed] [Google Scholar]
- 32.Zahl PH, Mæhlen J. Overdiagnosis of breast cancer after 14 years of mammography screening. Tidsskr Nor Laegeforen. 2012;132:414–417. doi: 10.4045/tidsskr.11.0195. [DOI] [PubMed] [Google Scholar]
- 33.Puliti D, Miccinesi G, Zappa M, et al. Balancing harms and benefits of service mammography screening programs: a cohort study. Breast Cancer Res. 2012;14:R9. doi: 10.1186/bcr3090. [DOI] [PMC free article] [PubMed] [Google Scholar]
- 34. Appendix of randomized controlled trials. Available at http://www.cancer.gov/cancertopics/pdq/screening/breast/healthprofessional/Page11#Section_377. Accessed October 2, 2013.
- 35.Shapiro S, Venet W, Strax P, et al. Ten- to fourteen-year effect of screening on breast cancer mortality. J Natl Cancer Inst. 1982;69:349–355. [PubMed] [Google Scholar]
- 36.Shapiro S. Baltimore, MD: Johns Hopkins University Press; 1988. Periodic Screening for Breast Cancer: The Health Insurance Plan Project and Its Sequelae, 1963–1986. [Google Scholar]
- 37.Huggins A, Muir BB, Donnan PT, et al. Edinburgh trial of screening for breast cancer: mortality at seven years. Lancet. 1990;335:241–246. doi: 10.1016/0140-6736(90)90066-e. [DOI] [PubMed] [Google Scholar]
- 38.Miller AB, To T, Baines CJ, et al. The Canadian National Breast Screening Study-1: Breast cancer mortality after 11 to 16 years of follow-up. A randomized screening trial of mammography in women age 40 to 49 years. Ann Intern Med. 2002;137:305–312. doi: 10.7326/0003-4819-137-5_part_1-200209030-00005. [DOI] [PubMed] [Google Scholar]
- 39.Baines CJ, Miller AB, Kopans DB, et al. Canadian National Breast Screening Study: Assessment of technical quality by external review. AJR Am J Roentgenol. 1990;155:743–747; discussion 748–749. doi: 10.2214/ajr.155.4.2119103. [PUBMED Abstract] [DOI] [PubMed] [Google Scholar]
- 40.Moss SM, Cuckle H, Evans A, et al. Effect of mammographic screening from age 40 years on breast cancer mortality at 10 years’ follow-up: A randomised controlled trial. Lancet. 2006;368:2053–2060. doi: 10.1016/S0140-6736(06)69834-6. [DOI] [PubMed] [Google Scholar]
- 41.Andersson I, Aspegren K, Janzon L, et al. Mammographic screening and mortality from breast cancer: The Malmö mammographic screening trial. BMJ. 1988;297:943–948. doi: 10.1136/bmj.297.6654.943. [DOI] [PMC free article] [PubMed] [Google Scholar]
- 42.Nyström L, Rutqvist LE, Wall S, et al. Breast cancer screening with mammography: Overview of Swedish randomised trials. Lancet. 1993;341:973–978. doi: 10.1016/0140-6736(93)91067-v. [DOI] [PubMed] [Google Scholar]
- 43.Tabár L, Fagerberg CJ, Gad A, et al. Reduction in mortality from breast cancer after mass screening with mammography. Randomised trial from the Breast Cancer Screening Working Group of the Swedish National Board of Health and Welfare. Lancet. 1985;1:829–832. doi: 10.1016/s0140-6736(85)92204-4. [DOI] [PubMed] [Google Scholar]
- 44.Tabàr L, Fagerberg G, Duffy SW, et al. Update of the Swedish two-county program of mammographic screening for breast cancer. Radiol Clin North Am. 1992;30:187–210. [PubMed] [Google Scholar]
- 45.Tabar L, Fagerberg G, Duffy SW, et al. The Swedish two county trial of mammographic screening for breast cancer: recent results and calculation of benefit. J Epidemiol Community Health. 1989;43:107–114. doi: 10.1136/jech.43.2.107. [DOI] [PMC free article] [PubMed] [Google Scholar]
- 46.Frisell J, Eklund G, Hellström L, et al. Randomized study of mammography screening—Preliminary report on mortality in the Stockholm trial. Breast Cancer Res Treat. 1991;18:49–56. doi: 10.1007/BF01975443. [DOI] [PubMed] [Google Scholar]
- 47.Green BB, Taplin SH. Breast cancer screening controversies. J Am Board Fam Pract. 2003;16:233–241. doi: 10.3122/jabfm.16.3.233. [DOI] [PubMed] [Google Scholar]
- 48.Autier P, Boniol M, Gavin A, et al. Breast cancer mortality in neighbouring European countries with different levels of screening but similar access to treatment: Trend analysis of WHO mortality database. BMJ. 2011;343:d4411. doi: 10.1136/bmj.d4411. [DOI] [PMC free article] [PubMed] [Google Scholar]
- 49.Gøtzsche PC, Nielsen M. Screening for breast cancer with mammography. Cochrane Database Syst Rev. 2011;(1, Issue 1):CD001877. doi: 10.1002/14651858.CD001877.pub4. doi:10.1002/14651858.CD001877.pub4. [DOI] [PubMed] [Google Scholar]
- 50.Gøtzsche PC, Jørgensen KJ. Screening for breast cancer with mammography. Cochrane Database Syst Rev. 2013;6(Issue 6):CD001877. doi: 10.1002/14651858.CD001877.pub5. doi:10.1002/14651858.CD001877.pub5. [DOI] [PMC free article] [PubMed] [Google Scholar]
- 51.Mukhtar TK, Yeates DR, Goldacre MJ. Breast cancer mortality trends in England and the assessment of the effectiveness of mammography screening: population-based study. J R Soc Med. 2013;106:234–242. doi: 10.1177/0141076813486779. [DOI] [PMC free article] [PubMed] [Google Scholar]
- 52.Duffy SW, Parmar D. Overdiagnosis in breast cancer screening: The importance of length of observation period and lead time. Breast Cancer Res. 2013;15:R41. doi: 10.1186/bcr3427. [Epub ahead of print] [DOI] [PMC free article] [PubMed] [Google Scholar]
- 53.Kopans DB. Point: The New England Journal of Medicine article suggesting overdiagnosis from mammography screening is scientifically incorrect and should be withdrawn. J Am Coll Radiol. 2013;10:317–319; discussion 323. doi: 10.1016/j.jacr.2013.01.024. [DOI] [PubMed] [Google Scholar]
- 54. Central Oregon Early Lung Cancer Screening (CO-ELCS) Phase 2 Trial. Available at http://www.stcharlesresearch.org/index.php?m=90&s=552&id=88. Accessed October 2, 2013.
- 55. Neuroblastoma Screening. Available at http://www.cancer.gov/cancertopics/pdq/screening/neuroblastoma/HealthProfessional/page3. Accessed December 1, 2013.
- 56. Overdiagnosis and overtreatment. Central Oregon Medical Society. Available at http://comedsoc.org/Overtreatment.htm?m=66&s=495. Accessed October 2, 2013.
- 57.Hersch J, Jansen J, Barratt A, et al. Women’s views on overdiagnosis in breast cancer screening: A qualitative study. BMJ. 2013;346:f158. doi: 10.1136/bmj.f158. [DOI] [PMC free article] [PubMed] [Google Scholar]
- 58.Brodersen J, Siersma VD. Long-term psychosocial consequences of false-positive screening mammography. Ann Fam Med. 2013;11:106–115. doi: 10.1370/afm.1466. [DOI] [PMC free article] [PubMed] [Google Scholar]
- 59. Mammography screening for breast cancer. Option 3. Kalager M. Do not recommend screening mammography. N Engl J Med 2012; 367:e31. 10.1056/NEJMclde1212888. http://www.nejm.org/doi/full/10.1056/NEJMclde1212888#t=cldeOpt3. Accessed January 13, 2014.
- 60.U.S. Preventive Services Task Force Screening for breast cancer: U.S. Preventive Services Task Force recommendation statement. Ann Intern Med. 2009;151:716–726, W-236. doi: 10.7326/0003-4819-151-10-200911170-00008. [DOI] [PubMed] [Google Scholar]
- 61. Amir E, Bedard PL, Ocaña A et al. Benefits and harms of detecting clinically occult breast cancer. J Natl Cancer Inst 2012;104:1542–1547. doi:10.1093/jnci/djs394. [DOI] [PubMed]
- 62.Elmore JG, Fletcher SW. Overdiagnosis in breast cancer screening: Time to tackle an underappreciated harm. Ann Intern Med. 2012;156:536–537. doi: 10.7326/0003-4819-156-7-201204030-00012. [DOI] [PMC free article] [PubMed] [Google Scholar]
Associated Data
This section collects any data citations, data availability statements, or supplementary materials included in this article.