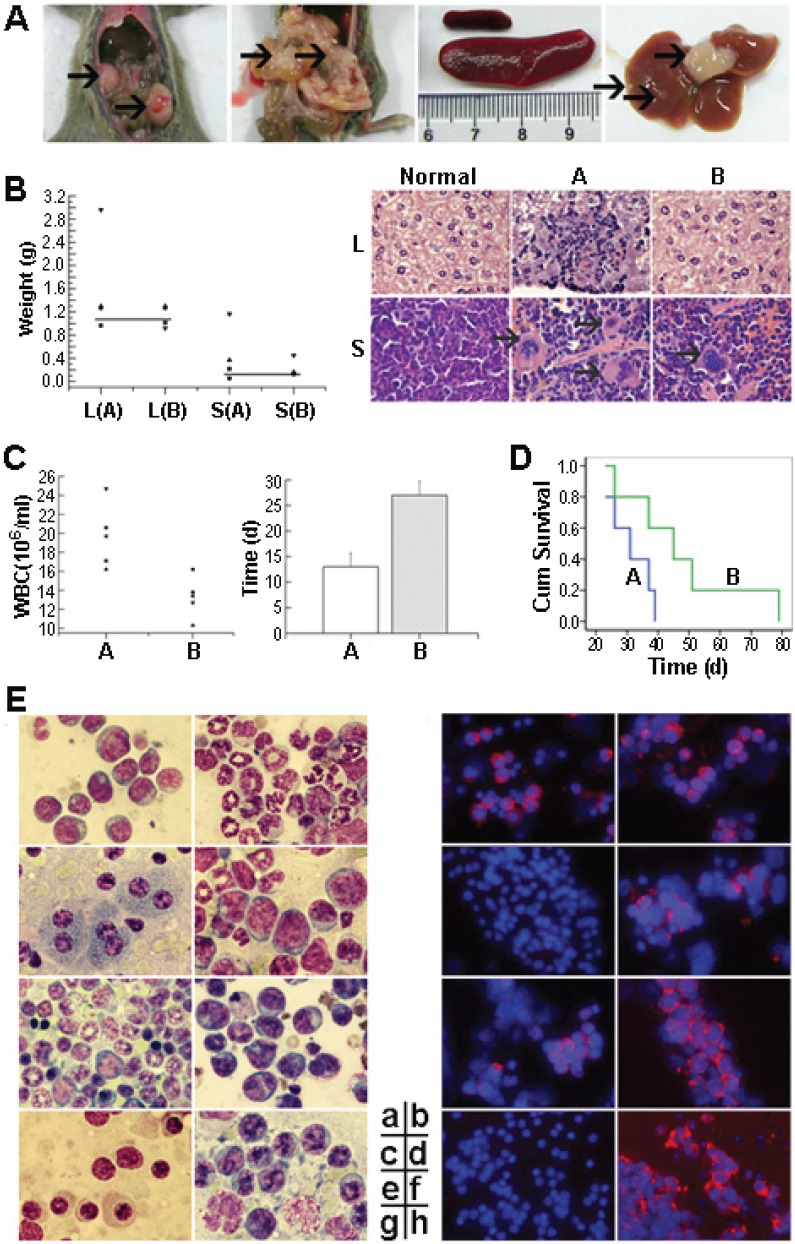
Figure 6. RNTS suppresses Bcr-Abl oncogenicity in mice.
32D-p210 cells untreated (group A) or treated (group B) with RNTS were collected and injected into C3H mice intravenously. (A) Display of enterocoelia tumor, mesenteric infiltration, splenomegaly and tumor nodule in the livers. (B) Comparison of liver and spleen weight (left) and staining of tissue by HE (right). The solid lines indicate the normal mean values. L: liver, S: spleen. (C) Comparison of the highest levels of WBC counts between mice in groups A and B (left). Average times (days) for reaching the highest WBC counts in groups A and B (right). (D) Kaplan-Meier survival curves of mice in groups A and B. (E) Tissue infiltration analysis by Wright's staining and detection of Bcr-Abl protein by immunofluorescent assay. a,b: bone marrow; c,d: liver; e,f: spleen; g: kidney; h: enterocoelia solid tumor.

