

Abstract
Neuroticism and Extraversion are linked with current wellbeing, but it is unclear whether these traits in youth predict wellbeing decades later. We applied structural equation modelling to data from 4583 people from the MRC National Survey of Health and Development. We examined the effects of Neuroticism and Extraversion at ages 16 and 26 years on mental wellbeing and life satisfaction at age 60-64 and explored the mediating roles of psychological and physical health. Extraversion had direct, positive effects on both measures of wellbeing. The impact of Neuroticism on both wellbeing and life satisfaction was largely indirect through susceptibility to psychological distress and physical health problems. Personality dispositions in youth have enduring influence on wellbeing assessed about forty years later.
Keywords: Neuroticism, Extraversion, Wellbeing, Life satisfaction, Cohort
1. Introduction
Wellbeing is predictive of a range of important life outcomes. Having a strong sense of wellbeing, defined in terms of greater positive affect or satisfaction with life, has been associated in prospective studies with greater success in work and relationships (Luhmann, Lucas, Eid, & Diener, 2013; Lyubomirsky, King, & Diener, 2005), lower mortality from all causes and cardiovascular disease (Chida & Steptoe, 2008), and healthier ageing as represented by slower physical (Ostir, Markides, Black, & Goodwin, 2000) and cognitive decline (Gerstorf, Lovden, Rocke, Smith, & Lindenberger, 2007) and a reduced likelihood of becoming physically frail (Ostir, Ottenbacher, & Markides, 2004). Understanding which factors influence wellbeing at older ages is therefore of considerable interest.
Many researchers now agree that wellbeing is best thought of as a multi-dimensional construct (Diener, 2003), although opinion remains divided as to which components should be part of this construct (Forgeard, Jayawickreme, Kern, & Seligman, 2011). Researchers favouring the hedonic perspective of wellbeing have concentrated on ‘subjective wellbeing’ or in colloquial terms, happiness. This has been conceptualized in terms of four main components: life satisfaction, satisfaction with important domains, positive affect, and low levels of negative affect (Diener, 2000). According to Diener (2003) these components of wellbeing are moderately correlated with each other, yet each provides unique information about the subjective quality of an individual’s life.
Others take the view that wellbeing is not best captured by hedonic concepts of happiness alone (Ryan & Deci, 2001). The eudaimonic perspective of wellbeing—based on Aristotle’s view that true happiness comes from doing what is worth doing—focuses on meaning and self-realization, and defines wellbeing largely in terms of ways of thought and behavior that provide fulfillment. Researchers favoring the eudaimonic perspective have advanced various theoretical models of wellbeing incorporating a broad range of constructs (Kashdan, Biswas-Diener, & King, 2008). For example, according to Ryan and Deci’s Self-Determination theory there are three innate psychological needs—for autonomy, competence and relatedness—and the fulfillment of those needs leads to greater wellbeing (Ryan & Deci, 2000). Ryff’s theoretical model of Psychological wellbeing proposed that high levels of wellbeing required fulfillment on six dimensions that she named self-acceptance, positive relations with others, autonomy, environmental mastery, purpose in life and personal growth (Ryff, 1989; Ryff & Keyes, 1995). Yet despite the traditional distinction between the hedonic and eudaimonic approach to defining wellbeing, empirical evidence using indicators of both suggests that there is considerable common variance between them, even though factor-analytic studies usually find that they load onto distinguishable, if correlated, factors (Kashdan et al., 2008). In a study that compared how scores on the Subjective Happiness Scale (hedonic wellbeing) and Ryff’s Psychological Wellbeing Questionnaire (eudaimonic wellbeing) correlated with acquaintance ratings, clinician judgments and directly observed social behaviors, there was remarkable consistency in the pattern of correlates of the two wellbeing measures (Nave, Sherman, & Funder, 2008).
In the last few years there has been increasing interest in developing measures of wellbeing that integrate the hedonic and eudaimonic perspectives (Michaelson, Abdallah, Steuer, Thompson, & Marks, 2009). One such measure is the Warwick-Edinburgh Mental Wellbeing Scale (Tennant et al., 2007). The scale was developed by an expert panel with a view to assessing positive mental health rather than mental illness in population surveys, hence the use of the term ‘mental wellbeing’. It was designed to cover a broad concept of wellbeing, including affective or emotional aspects, cognitive or evaluative aspects, and psychological functioning. Confirmatory factor analysis suggests that the scale measures a single construct (Tennant et al., 2007).
There is extensive evidence of associations between personality traits, particularly Neuroticism and Extraversion, and contemporaneous scores on various measures of wellbeing in adults (Deneve & Cooper, 1998; Schmutte & Ryff, 1997). People who are lower in Neuroticism or higher in Extraversion tend to report greater wellbeing. Similar associations between these traits and current wellbeing have also been observed in adolescents (Garcia, 2011; Richards & Huppert, 2011). Individual differences in these personality traits in adults show considerable stability over time (Matthews, Deary, & Whiteman, 2009): for instance, one study that examined test-re-test correlations of ratings on the NEO Personality Inventory after a seven year interval found correlations of .67 for Neuroticism and .81 for Extraversion (Costa & McCrae, 1992). A meta-analysis of estimates from 152 longitudinal studies suggests that the magnitude of rank-order stability of personality traits in childhood or adolescence is lower than that found in adulthood; meta-analytic estimates of mean test-re-test correlations were .30 in childhood and .54 in late adolescence (Roberts & DelVecchio, 2000). These observations raise the question as to whether assessment of Neuroticism and Extraversion, even in youth, might predict wellbeing many years later.
In subsets of participants aged between 35 and 95 years from the Baltimore Longitudinal Study of Aging who had completed personality measures several years earlier there were correlations between Neuroticism and scores on a depression symptom scale of .42 after an interval of 10 to 15 years (n=266), and .40 after an interval of 12 to 31 years (n=194) (Costa & McCrae, 1996). The authors wrote, “That dramatic prediction of a mood score from a personality measure obtained an average of 26.5 years earlier is testimony to the enduring influence of personality traits on human emotions.” In other subsets from the Baltimore Longitudinal Study of Aging there were correlations between Neuroticism and facets of Extraversion and later scores on measures of wellbeing, and many of these long-term correlations were not very different in magnitude from contemporaneous measures. For instance, the correlation between Neuroticism and scores for Satisfaction with Life was −.33 after an interval of 12 to 22 years (Costa & McCrae, 1984). These observations are consistent with results from the small number of other longitudinal studies that have investigated correlations between these personality traits and subsequent wellbeing (Deneve & Cooper, 1998).
But striking though these observations are, uncertainties remain about the long-term relation between personality traits and mental wellbeing. Nearly all the prospective investigations to date have been based on small numbers and the statistical analysis has been restricted to bivariate correlations of each personality trait separately so no account was taken of the fact that trait contributions may not be independent (Deneve & Cooper, 1998). In a large UK study, the Neuroticism scale of the NEO Five Factor Inventory correlated .40 with the Extraversion scale (Egan, Deary, & Austin, 2000), confirming the importance of examining the effect of both traits simultaneously.
Furthermore, there has been little investigation of the role of potential mediating factors. Systematic reviews of prospective studies have demonstrated that Neuroticism and Extraversion are predictive of a range of life outcomes other than wellbeing, among them occupational attainment, community involvement, and marital outcomes (Ozer & Benet-Martinez, 2006; Roberts, Kuncel, Shiner, Caspi, & Goldberg, 2007). There is a weight of evidence linking Neuroticism in particular with risk of psychological distress, somatic complaints and poorer perceived health (Charles, Gatz, Kato, & Pedersen, 2008; Costa & McCrae, 1987; Jerram & Coleman, 1999; Lahey, 2009; Ozer & Benet-Martinez, 2006; Roberts et al., 2007). Greater Neuroticism has also been linked with increased risk of specific chronic diseases, among them coronary heart disease (Friedman & Boothkewley, 1987) and the metabolic syndrome (Phillips et al., 2010) and of earlier death (Ozer & Benet-Martinez, 2006; Weiss, Gale, Batty, & Deary, 2009), though the latter is not a consistent finding. Greater Extraversion, by contrast, has been associated with better perceived health (Goodwin & Engstrom, 2002) and there is some evidence to link it with longevity (Friedman et al., 1995; Iwasa et al., 2008), though other studies have not found such an association (Chapman, Fiscella, Kawachi, & Duberstein, 2010).
Therefore, any associations between Neuroticism and Extraversion and subsequent mental well-being may be at least partially mediated through psychological distress, physical health or occupational attainment. These personality traits affect susceptibility to states of psychological distress, possibly via shared neurobiological risk factors or because they capture aspects of behaviour or thought, separate from the experience of psychological distress, that influence vulnerability to distress (Duggan et al., 2003; Foster & MacQueen, 2008). There is some evidence to link childhood measures of Extraversion, though not Neuroticism, with physical activity and smoking in adult life, both of which might influence risk of physical health (Hampson, Goldberg, Vogt, & Dubanoski, 2007). Effects of Neuroticism on later physical health might be explained by biological mechanisms, such as dysregulation of the hypothalamic-pituitary-adrenal (HPA) axis in response to stress (Phillips, Carroll, Burns, & Drayson, 2005). Both these personality traits may influence occupational attainment via their effect on ambition (Judge & Kammeyer-Mueller, 2012) or on attitude to work (Thoresen, Kaplan, Barsky, Warren, & de Chermont K., 2003).
While wellbeing and psychological distress tend to inversely correlated, it is now established that ‘positive’ wellbeing and ‘negative’ wellbeing or psychological distress are to some degree independent of each other (Diener & Emmons, 1984; Huppert & Whittington, 2003), as indicated by the findings that wellbeing is predictive of various health outcomes after controlling for the presence of depression (Chida & Steptoe, 2008; Gerstorf et al., 2007; Ostir, Markides, Peek, & Goodwin, 2001; Ostir et al., 2000; Ostir et al., 2004). As a result, we consider it appropriate to see psychological distress as one potential mediator between stable personality traits and well-being.
We used data on 4583 men and women from the United Kingdom’s Medical Research Council (MRC) National Survey for Health and Development (the 1946 birth cohort) (Kuh et al., 2011). They completed assessments of Neuroticism and Extraversion at ages 16 and 26 years and were followed-up for multi-dimensional assessment of wellbeing at age 60-64 years. Our aims were to use structural equation modelling to examine the simultaneous effects of Neuroticism and Extraversion in adolescence and young adulthood on wellbeing in later life. An important aspect of the current study was to take advantage of the long-term longitudinal data available on this cohort to test the extent to which any such effects were mediated through attained socioeconomic position, psychological distress, and physical health problems.
2. Methods
2.1. Sample
The MRC National Survey of Health and Development (NSHD; 1946 birth cohort) grew out of a maternity survey of all mothers who had a baby in England, Scotland, or Wales in one week in March 1946. The cohort was originally based on 5,362 participants and has been followed-up 23 times through childhood and adult life (Kuh et al., 2011). The last follow-up was a clinic-based data collection at 60-64 years based at six UK clinical research facilities; 2661 (84% of the target sample) provided information (Stafford et al., 2013).
2.2 Measures
2.2.1 Personality
Study members completed Eysenck’s short Maudsley Personality Inventory (MPI) at age 16 years and again at age 26 years (Eysenck, 1958). This inventory consists of six Extraversion items that assess sociability, energy and activity orientation, and six Neuroticism items that assess emotional stability, mood and distractibility. Participants respond on a three point response scale: 0 - no, 1 - don’t know, 2 - yes.
2.2.2 Mental wellbeing
When study members were aged between 60 and 64, as part of the HALCyon research collaboration (Kuh et al., 2012) two measures of wellbeing were added to questionnaires completed by participants having a clinic or home visit. This addition was made after the start of the follow-up. This meant that the questions on wellbeing were sent to 2,529 study members invited for a clinic or home visit. Of these 78% completed the Warwick-Edinburgh Mental Wellbeing Scale (Tennant et al., 2007), and 79% completed Diener’s Satisfaction with Life Scale (Diener, Emmons, Larsen, & Griffin, 1985).
The Warwick-Edinburgh Mental Wellbeing Scale was developed to measure a wide conception of wellbeing, including positive affect, psychological functioning (autonomy, competence, self acceptance, personal growth) and interpersonal relationships, thereby incorporating both hedonic and eudaimonic aspects (Ryan & Deci, 2001). The scale consists of 14 positively-worded statements. Examples include ‘I’ve been feeling optimistic about the future’, ‘I’ve been feeling interested in other people’, ‘I’ve been dealing with problems well’, ‘I’ve been feeling good about myself’. Participants respond based on the frequency of feelings using a five point likert-type response scale (“None of the time”, “Rarely”, “Some of the time”, “Often”, “All of the time”).
The Satisfaction with Life scale was developed to measure global life satisfaction and not to tap into related constructs such as positive affect (Diener et al., 1985). It consists of 5 positively-worded statements. Examples include ‘I am satisfied with my life’ and ‘The conditions of my life are excellent’. Participants respond on a 7 point likert-type response scale (“Strongly Disagree”, “Disagree”, “Slightly Disagree”, “Neither Agree nor Disagree”, “Slightly Agree”, “Agree”, “Strongly Agree”).
2.2.3 Socio-economic status
Socioeconomic position in later life was defined using occupational social class reported at age 53 years. This was based on members’ current or most recent occupation. Occupations were categorized according to the Registrar General’s classification (Office for National Statistics, 2000). For those participants who had missing social class data at age 53 we used data on social class from preceding follow-ups.
2.2.4 Psychological health problems
During the age-53 survey, participants completed the 28-item General Health Questionnaire (GHQ) (Goldberg & Hillier, 1979) a measure of psychological distress. Participants are asked to respond to a list of statements regarding their health over the past few weeks, using a 1-4 point scale (“Better than usual”, “Same as usual”, “Worse than usual”, “Much worse than usual”). For the current analysis, a mean total score calculated.
2.2.5 Physical health problems
Health problems were identified at 53 years from study member responses to the Rose/World Health Organization angina and intermittent claudication questionnaires (Rose & Blackburn, 1968), the MRC bronchitis questionnaire and a series of questions about whether they had been diagnosed by a doctor with various physical health problems. A variable capturing the number of major disease groups (cardiovascular, respiratory, diabetes, neurological, cancer, other) covered by these health problems was derived. Few participants reported three or more health problems, so for the present paper a three-level categorical variable was used: 0 – no disease group: 1 – one disease group; 2 – two or more disease groups.
2.3 Analysis Strategy
We applied structural equation modeling (SEM) to estimate three models; a personality measurement model comprising Extraversion and Neuroticism items at age 16 and 26 years (i.e., four latent factors); a two-factor wellbeing measurement model comprising the mental wellbeing and satisfaction with life items, respectively; and finally a full structural model including both measurement models and the covariates and specifying their interrelations. Details of the specification of the measurement models are provided in the results.
In the full structural model (Figure 1), we hypothesized that Neuroticism and Extraversion would have direct and indirect effects on both mental wellbeing factors at age 60-64 years, with the indirect effects being mediated via psychological distress (GHQ), physical health problems, and social class (all measured at age 53 years).
Figure 1. Personality measurement model diagram.
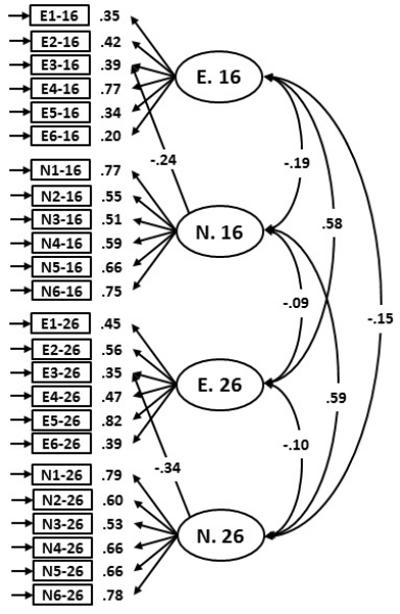
E1-16 to E6-16 = Extraversion items at age 16; E1-26 to E6-26 = Extraversion items at age 26. E.16 and E.26 = Respective latent variables for Extraversion. N1-16 to N6-16 = Neuroticism items at age 16; N1-26 to N6-26 = Neuroticism items at age 26. N.16 and N.26 = Respective latent variables for Neuroticism. All estimates are standardized and significant at a minimum of p<0.05.
All models were estimated in Mplus 6.0 (Muthen & Muthen, 2010) using weighted-least squares means and variance (WLSMV) estimation, because item-level data were treated as categorical. WLSMV is appropriate for model estimation with categorical data, and is robust to non-normality. Model fit was assessed based on the comparative fit index (CFI), Tucker-Lewis fit index (TLI), root mean square error approximation (RMSEA), and weighted root mean residual (WRMR). We applied conventional cut-off criteria of values approximately ≤ 0.05 to 0.08 for the RMSEA, ≥ 0.95 for the CFI and TLI, and ≤ 1.0 for the WRMR (Hu & Bentler, 1999; Yu, 2002). These cut-off criteria were taken as indicative rather than absolute, and were used to guide the plausibility of the model for substantive interpretation. We tested the significance of indirect effects of Extraversion and Neuroticism on mental wellbeing and satisfaction with life using bias-corrected bootstrap estimation for confidence intervals based on 500 bootstraps (Mackinnon, Lockwood, & Williams, 2004).
2.3.1 Model stability checks
In order to assess the stability of the model, the model was estimated using different methods for accounting for missing data, different estimation methods (maximum likelihood and robust maximum likelihood), and in males and females independently.
2.3.2 Assessment of the impact of item overlap
In this study we used self-report measures of personality, psychological distress and wellbeing. Within any network of related self-report constructs, it is possible that similar item wording across inventories can upwardly bias the strength of associations. In order to investigate this possibility in our mediation model, we re-estimated the final model removing items identified as being highly similar in wording and content and considered the degree to which parameter estimates are affected by item overlap.
3. Results
3.1 Descriptive Statistics
The descriptive statistics for each variable used in the models are shown in Table 1. As is appropriate for the SEM procedure, the statistics for each variable are based on the total available sample for that variable. The data are largely normally distributed with no absolute values for skew exceeding ±1.48, or values for kurtosis exceeding ±2.17. The exception to this was GHQ total mean score (skew=1.74; kurtosis=5.32). However, WLSMV is a robust estimation method to non-normality and as a result these values were not considered problematic and variables were not transformed. Before reporting the SEM results, we give the key longitudinal correlations which the study was designed to report and understand, all of which were statistically significant at p<.001. The correlation between Neuroticism at ages 16 and 26, respectively, and satisfaction with life was −.12 and −.20. The correlation between Neuroticism at ages 16 and 26, respectively, and mental wellbeing was −.15 and −.23. The correlation between Extraversion at ages 16 and 26, respectively, and satisfaction with life was .15 and .15. The correlation between Extraversion at ages 16 and 26, respectively, and mental wellbeing was .22 and .21.
Table 1. Descriptive Statistics for Input Variables to SEM Models.
| N | Min | Max | Mean | SD | Skew | Kurtosis | |
|---|---|---|---|---|---|---|---|
|
Extraversion items from
MPI at age 16 years |
|||||||
| E1 | 3871 | 0 | 2 | 1.22 | 0.92 | −0.46 | −1.66 |
| E2 | 3868 | 0 | 2 | 1.32 | 0.88 | −0.67 | −1.38 |
| E3 | 3855 | 0 | 2 | 1.20 | 0.89 | −0.40 | −1.61 |
| E4 | 3860 | 0 | 2 | 1.52 | 0.77 | −1.19 | −0.28 |
| E5 | 3883 | 0 | 2 | 1.32 | 0.91 | −0.68 | −1.46 |
| E6 | 3885 | 0 | 2 | 1.31 | 0.89 | −0.64 | −1.44 |
|
Neuroticism items from
MPI at age 16 years |
|||||||
| N1 | 3889 | 0 | 2 | 1.22 | 0.96 | −0.46 | −1.77 |
| N2 | 3884 | 0 | 2 | 1.18 | 0.97 | −0.36 | −1.85 |
| N3 | 3881 | 0 | 2 | 0.65 | 0.92 | 0.74 | −1.40 |
| N4 | 3870 | 0 | 2 | 1.16 | 0.96 | −0.33 | −1.84 |
| N5 | 3866 | 0 | 2 | 0.89 | 0.97 | 0.22 | −1.90 |
| N6 | 3880 | 0 | 2 | 0.90 | 0.97 | 0.19 | −1.92 |
|
Extraversion items from
MPI at age 26 years |
|||||||
| E1 | 3723 | 0 | 2 | 1.47 | 0.86 | −1.07 | −0.80 |
| E2 | 3720 | 0 | 2 | 1.20 | 0.95 | −0.41 | −1.77 |
| E3 | 3717 | 0 | 2 | 1.28 | 0.93 | −0.59 | −1.58 |
| E4 | 3719 | 0 | 2 | 1.49 | 0.84 | −1.11 | −0.65 |
| E5 | 3719 | 0 | 2 | 1.13 | 0.98 | −0.27 | −1.90 |
| E6 | 3722 | 0 | 2 | 1.32 | 0.91 | −0.68 | −1.44 |
|
Neuroticism items from MPI at age 26 years |
|||||||
| N1 | 3722 | 0 | 2 | 1.28 | 0.96 | −0.57 | −1.66 |
| N2 | 3722 | 0 | 2 | 1.10 | 0.99 | −0.20 | −1.95 |
| N3 | 3721 | 0 | 2 | 0.83 | 0.98 | 0.35 | −1.86 |
| N4 | 3722 | 0 | 2 | 1.32 | 0.94 | −0.67 | −1.52 |
| N5 | 3719 | 0 | 2 | 0.89 | 0.98 | 0.22 | −1.93 |
| N6 | 3721 | 0 | 2 | 0.89 | 0.98 | 0.22 | −1.93 |
|
Warwick-Edinburgh
Mental Wellbeing items |
|||||||
| WEMWBS 1 | 1969 | 1 | 5 | 3.45 | 0.92 | −0.25 | 0.08 |
| WEMWBS 2 | 1967 | 1 | 5 | 3.75 | 0.81 | −0.31 | 0.22 |
| WEMWBS 3 | 1961 | 1 | 5 | 3.51 | 0.82 | −0.17 | 0.03 |
| WEMWBS 4 | 1966 | 1 | 5 | 3.69 | 0.87 | −0.34 | 0.12 |
| WEMWBS 5 | 1962 | 1 | 5 | 2.94 | 0.88 | −0.02 | 0.04 |
| WEMWBS 6 | 1965 | 1 | 5 | 3.71 | 0.79 | −0.25 | 0.14 |
| WEMWBS 7 | 1967 | 1 | 5 | 3.92 | 0.79 | −0.28 | −0.31 |
| WEMWBS 8 | 1972 | 1 | 5 | 3.58 | 0.85 | −0.28 | 0.09 |
| WEMWBS 9 | 1970 | 1 | 5 | 3.79 | 0.86 | −0.35 | −0.13 |
| WEMWBS 10 | 1967 | 1 | 5 | 3.63 | 0.86 | −0.29 | 0.04 |
| WEMWBS 11 | 1973 | 1 | 5 | 4.09 | 0.80 | −0.62 | 0.22 |
| WEMWBS 12 | 1968 | 1 | 5 | 4.16 | 0.89 | −0.86 | 0.29 |
| WEMWBS 13 | 1973 | 1 | 5 | 3.63 | 0.95 | −0.21 | −0.53 |
| WEMWBS 14 | 1974 | 1 | 5 | 3.77 | 0.77 | −0.30 | 0.19 |
|
Diener Satisfaction with
Life items |
|||||||
| SWL 1 | 1988 1 | 7 | 2.79 | 1.43 | 0.96 | 0.20 | |
| SWL 2 | 1987 1 | 7 | 2.66 | 1.38 | 1.02 | 0.52 | |
| SWL 3 | 1983 1 | 7 | 2.38 | 1.30 | 1.36 | 1.51 | |
| SWL 4 | 1987 1 | 7 | 2.24 | 1.24 | 1.48 | 2.17 | |
| SWL 5 | 1988 1 | 7 | 3.23 | 1.73 | 0.54 | −0.92 | |
| GHQ - Total Mean Score | 2934 | 1 | 4 | 1.62 | 0.35 | 1.74 | 5.32 |
| 1 | 2 | 3 | |||||||
| Physical Health | 2988 | 1782 | 895 | 311 | |||||
| 1 | 2 | 3 | 4 | 5 | 6 | ||||
| Social Class | 3280 | 233 | 1207 | 725 | 592 | 383 | 140 | ||
| Male | Female | ||||||||
| Sex | 4583 | 2388 | 2195 | ||||||
Social Class Coding: 1= Unskilled; 2=Semi-skilled; 3=Skilled Manual; 4=Skilled Non-manual; 5=Intermediate; 6=Professional
3.2 Personality Measurement Model
In the initial specification we modelled four latent personality variables; Extraversion at age 16, Extraversion at age 26, Neuroticism at age 16 and Neuroticism at age 26. Each latent factor was loaded by the hypothesised six items from the Eysenck MPI questionnaire. Factors were identified by setting the variance of the latent variables to 1 (Bollen, 1989). In order to take account of the longitudinal nature of the data, we included correlated residuals between the same items given at the two time points (see Table 2 upper panel). This initial model showed poor to moderate fit to the data (χ2=2571.23(234), p<.05; CFI=.90; TLI=.88; RMSEA=.048; WRMR=2.821).
Table 2. Correlated residuals from the personality measurement model.
| Parameter | Standardized Estimate | p-value |
|---|---|---|
| Same Item Across Time | ||
| El-16 ↔ E1-26 | .26 | <.001 |
| E2-16 ↔ E2-26 | .26 | <.001 |
| E3-16 ↔ E3-26 | .25 | <.001 |
| E4-16 ↔ E4-26 | .14 | =.053(ns) |
| E5-16 ↔ E5-26 | .29 | <.001 |
| E6-16 ↔ E6-26 | .22 | <.001 |
| N1-16 ↔ N1-26 | .23 | <.001 |
| N2-16 ↔ N2-26 | .38 | <.001 |
| N3-16 ↔ N3-26 | .24 | <.001 |
| N4-16 ↔ N4-26 | .17 | <.001 |
| N5-16 ↔ N5-26 | .35 | <.001 |
| N6-16 ↔ N6-26 | .07 | =.123(ns) |
| Residual Correlations Based on Modification Indices | ||
| N2-16 ↔ N3-16 | .27 | <.001 |
| N2-26 ↔ N3-26 | .35 | <.001 |
| N5-16 ↔ N6-16 | .52 | <.001 |
| N5-26 ↔ N6-26 | .66 | <.001 |
| E1-16 ↔ E6-16 | .29 | <.001 |
| E1-26 ↔ E6-26 | .30 | <.001 |
Notes: ↔ = correlation.
Based on modification indices, we included a series of additional parameters (see Table 2 lower panel and Figure 1 for estimates). The purpose of these modifications was to model appropriately and explicitly the unique co-variances among items, over and above latent trait covariances. In particular, we included a cross loading from Extraversion item 3 (Are you included to be quick and sure in your actions?) on to Neuroticism at both time points. We suggest that the addition of ‘sure’ in action may relate to aspects of Neuroticism such as worry and self-assuredness. We included three further correlated residuals between pairs of items within the same trait which shared content. Neuroticism items 2 and 3 concerned concentration/focus; Neuroticism items 5 and 6 concerned mood; and Extraversion items 1 and 6 concerned activity. The revised model showed good fit to the data (χ2=1203.19(226), p<.05; CFI=.96; TLI=.95; RMSEA=.031; WRMR=1.899). The four factors accounted on average for between 17.2% and 45% of variance in the items.
Both Extraversion and Neuroticism were reasonably stable over the 10 years between questionnaire administrations. Extraversion at age 16 correlated at 0.58 (p<.001; 95% CI = .52 to .64) with Extraversion at age 26. These and subsequent point-estimates are standardized parameter weights with the associated 95% confidence intervals. Similarly, Neuroticism at age 16 correlated at 0.59 (p<.001; 95% CI = .54 to .63) with Neuroticism at age 26. For the full structural model (see below) we modelled single second order Extraversion and Neuroticism factors identified by the measurements of the respective traits at 16 and 26. Therefore, in the full structural model, we used an estimate of the stable variance in personality traits in early adulthood.
3.3 Wellbeing Measurement Model
The wellbeing measurement model (Figure 2) contained the 5 items from the Satisfaction with Life Scale and the 14 items from the Warwick-Edinburgh Mental Wellbeing Scale. Again, we fixed the variance of the latent factors to 1 in order to identify the model. The initial fit for this model was good according to the CFI and TLI (χ2=2803.75(151), p<.05; CFI=.96; TLI=.95), but poor according to the RMSEA and WRMR (RMSEA = .093; WRMR=2.824).
Figure 2. Well-being measurement model diagram.
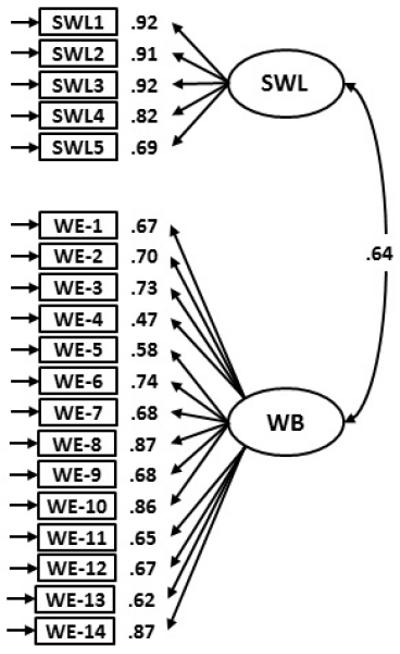
SWL1 to SWL5 = Satisfaction with Life items; SWL = Satisfaction with Life; WE-1 to WE-14 = Warwick-Edinburgh Mental Well-being Scale items; WB = Well-being. All estimates are standardized and significant at a minimum of p<0.05.
Again, based on modification indices we included a number of additional parameters. Warwick-Edinburgh items 9 and 12 concerned feelings of closeness; Warwick-Edinburgh items 4 and 9 concerned attachment to others; Warwick-Edinburgh items 6, 7 and 11 concerned clarity of thought; and finally Warwick-Edinburgh items 4 and 13 concerned curiosity/interest. Table 3 contains the standardized parameter estimates for the correlated residuals. The revised model showed good fit to the data (χ2=1668.23(146), p<.05; CFI=.98; TLI=.97; RMSEA=.072; WRMR=2.131). The two factors accounted on average for between 49.0% and 72.6% of the variance in the items.
Table 3. Correlated residuals from the well-being measurement model.
| Parameter | Standardized Estimate | p-value |
|---|---|---|
| WE-9 ↔ WE-12 | .45 | <.001 |
| WE-4 ↔ WE-9 | .30 | <.001 |
| WE-7 ↔ WE-11 | .40 | <.001 |
| WE-6 ↔ WE-7 | .38 | <.001 |
| WE-4 ↔ WE-13 | .32 | <.001 |
Notes: ↔ = correlation
The wellbeing measurement model contained a moderate number of correlated residuals. As a result, we explored whether this was indicative of a more complex factor solution. Based on the polychoric correlation matrix of the 19 wellbeing items from both inventories, we applied Velicer’s minimum average partial test (Velicer, 1976) parallel analysis based on Timmerman and Lorenzo-Seva (2011), and the Hull method for selecting the number of common factors (Lorenzo-Seva, Timmerman, & Kiers, 2011) in FACTOR8.31 (Lorenzo-Seva & Ferrando, 2006). All three methods suggested that 2 common factors were present in the data. Thus, although some additional complexity was evident, we retained just two factors.
3.4 Full Structural Model
As a first step, we estimated the structural model without the potential mediators in order to assess the magnitude of the main effects (Figure 3). Latent factors in this and subsequent models were estimated from the item level measurement models discussed above. However, for clarity, Figure 3 includes only structural parameters (those between latent constructs). The main effects model displayed good fit to the data χ2=2683.47(825), p<.05; CFI=.98; TLI=.98; RMSEA=.022; WRMR=1.726). Extraversion in youth had a significant positive main effect on both mental wellbeing (.24, p<.001, 95% CI = .17 to .32) and satisfaction with life (.16, p<.001, 95% CI = .08 to .23). Neuroticism also had significant negative main effects on both mental wellbeing (−.20, p<.001, 95% CI = −.26 to −.13) and satisfaction with life (−.18, p<.001, 95% CI = −.24 to −.11).
Figure 3. Structural diagram for the main effects between personality and wellbeing.
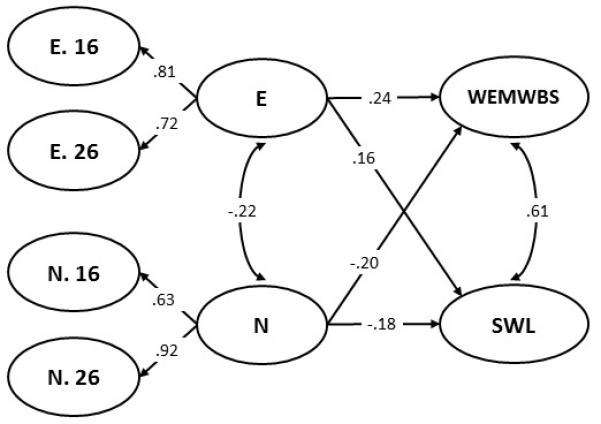
E.16 = Extraversion measured at age 16; E.26 = Extraversion measured at age 26; N.16= Neuroticism measured at age 16; N.26=Neuroticism measured at age 26. E= Extraversion; N=Neuroticism; WEMWBS= Warwick-Edinburgh Mental Wellbeing Scale total score; SWL=Satisfaction with Life total score… Parameter estimates are standardized and significant at a minimum p<.05.
3.5 Mediation
Next we estimated the full structural model including mediators (Figure 4). As with Figure 3, Figure 4 contains only structural parameters. The full model showed good fit to the data (χ2=3066.29(945), p<.05; CFI=.98; TLI=.98; RMSEA=.022; WRMR=1.714).
Figure 4. Full structural diagram of the latent variable associations.
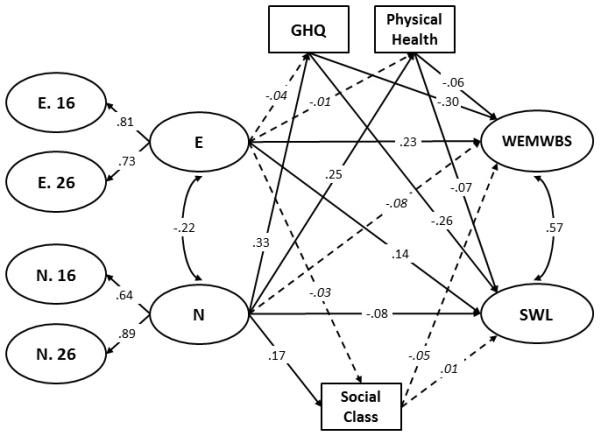
E.16 = Extraversion measured at age 16; E.26 = Extraversion measured at age 26; N.16= Neuroticism measured at age 16; N.26=Neuroticism measured at age 26. E= Extraversion; N=Neuroticism; WEMWBS= Warwick-Edinburgh Mental Wellbeing Scale total score; SWL=Satisfaction with Life total score; GHQ= General Health Questionnaire total score; Physical health=Number of physical health problems. All parameters are standardized. Non-significant parameters are shown italicized with dashed lines. Significant parameters (minimum p<.05) are shown in normal font on solid lines.
Similarly to the previous model (Figure 3), Extraversion in youth had a significant positive direct effect on both mental wellbeing (.23, p<.001; 95% CI = .15 to .30) and satisfaction with life (.14, p<.001, 95% CI = .07 to .22) about forty years later. Neuroticism had a negative direct effect on both measures (Mental Wellbeing = −.08, p=.051, 95% CI= −.15 to .00; Satisfaction with Life = −.08, p<.05, 95% CI= −.15 to −.01), though only the association with satisfaction with life reached statistical significance. Psychological distress (GHQ) had significant negative effects on both mental wellbeing (−.30, p<.001, 95% CI= −.35 to −.25) and satisfaction with life (−.26, p<.001, 95% CI= −.31 to −.21). Physical health problems also had significant negative effects on both mental wellbeing (−.06, p<.05, 95% CI= −.12 to −.01) and satisfaction with life (−.07, p<.05, 95% CI= −.13 to −.02). Social class had no significant direct effects. Therefore, individuals who were higher in Extraversion and lower in Neuroticism in youth, and who had better psychological and physical health in middle age, tended to report higher levels of mental wellbeing at age 60-64 years. In total, the model accounted for 20.5% of the variance in mental wellbeing, and 13.1% of the variance in satisfaction with life. Neuroticism, but not Extraversion, had significant effects on psychological distress (GHQ; .33, p<.001, 95% CI= .27 to .38), physical health problems (.24, p<.001, 95% CI= .18 to .30), and social class (.17, p<.001, 95% CI= .12 to .22), indicating that individuals higher in Neuroticism in youth reported poorer psychological and physical health in mid life and were more likely at that time to be in more manual occupational social classes.
Therefore, given the pattern of results noted above, a number of significant mediation, or indirect paths were evident. There were no notable attenuations of the main effects of Extraversion, with the differences seen across models (Figure 3 and Figure 4) with and without mediators being .01 for mental wellbeing, and .02 for satisfaction with life. The attenuations were greater for Neuroticism. The main effects dropped from −.20 to −.08 for mental wellbeing, and from −.18 to −.08 for satisfaction with life when mediators were included in the models; the mediators therefore accounted for 56% to 60% of the total effect. Accordingly, four significant indirect effects were present from Neuroticism through GHQ to both mental wellbeing (−.10, p<.001, 95% CI = −.13 to −.07) and satisfaction with life (−.08, p<.001, 95% CI = −.11 to −.06), and from Neuroticism through Physical Health to both mental wellbeing (−.02, p<.05, 95% CI = −.03 to .00) and satisfaction with life (−.02, p<.05, 95% CI = −.03 to .00).
Lastly, we considered the consistency of the parameter estimates across missing data method, estimator and sex1. Changes in parameter estimates were generally at the second decimal place (see Table 4), suggesting that the model was largely stable. A number of small differences were seen between the male and female models. Male Extraversion was primarily loaded by Extraversion at age 16; whilst female Neuroticism was primarily loaded by Neuroticism aged 26. However, overall the majority of parameters continued to show small changes, with no changes in substantive interpretation.
Table 4. Structural model parameter estimates for the estimator, missing data and sex stability analysis.
| Parameter | Listwise Deletion |
Maximum Likelihood |
Robust Maximum Likelihood |
Male | Female |
|---|---|---|---|---|---|
| Factor Loadings | |||||
| E → E.16 | 0.80 (0.000) | 0.84 (0.000) | 0.84 (0.000) | 0.97 (0.000) | 0.72 (0.000) |
| E → E.26 | 0.74 (0.000) | 0.67 (0.000) | 0.67 (0.000) | 0.59 (0.000) | 0.82 (0.000) |
| N → N.16 | 0.65 (0.000) | 0.67 (0.000) | 0.67 (0.000) | 0.68 (0.000) | 0.58 (0.000) |
| N → N.26 | 0.92 (0.000) | 0.81 (0.000) | 0.81 (0.000) | 0.75 (0.000) | 0.90 (0.000) |
| Factor Correlations | |||||
| E ↔ N | −0.24 (0.000) | −0.22 (0.000) | −0.22 (0.000) | −0.17 (0.000) | −0.24 (0.000) |
| WB ↔ SWL | 0.55 (0.000) | 0.56 (0.000) | 0.56 (0.000) | 0.53 (0.000) | 0.60 (0.000) |
| Direct Effects – Well-Being | |||||
| E → WEMWBS | 0.24 (0.000) | 0.21 (0.000) | 0.21 (0.000) | 0.23 (0.000) | 0.23 (0.000) |
| N → WEMWBS | −0.09 (0.034) | −0.12 (0.001) | −0.12 (0.002) | −0.10 (0.101 ns) | −0.11 (0.028) |
| GHQ → WEMWBS | −0.26 (0.000) | −0.30 (0.000) | −0.30 (0.000) | −0.31 (0.000) | −0.29 (0.000) |
| Social Class → WEMWBS | −0.07 (0.011) | −0.04 (0.136 ns) | −0.04 (0.141 ns) | −0.02 (0.604 ns) | −0.09 (0.009) |
| Health → WEMWBS | −0.02 (0.579 ns) | −0.02 (0.452 ns) | −0.02 (0.471 ns) | −0.12 (0.006) | −0.02 (0.686 ns) |
| E → SWL | 0.15 (0.000) | 0.12 (0.001) | 0.12 (0.002) | 0.14 (0.019) | 0.15 (0.003) |
| N → SWL | −0.07 (0.076 ns) | −0.10 (0.010) | −0.10 (0.008) | −0.15 (0.013) | −0.06 (0.207 ns) |
| GHQ → SWL | −0.24 (0.000) | −0.27 (0.000) | −0.27 (0.000) | −0.26 (0.000) | −0.26 (0.000) |
| Social Class → SWL | −0.03 (0.360 ns) | −0.01 (0.587 ns) | −0.01 (0.594 ns) | 0.03 (0.355 ns) | −0.02 (0.531 ns) |
| Health → SWL | −0.04 (0.184 ns) | −0.03 (0.212 ns) | −0.03 (0.229 ns) | −0.09 (0.043) | −0.05 (0.197 ns) |
| Direct Effects - Health | |||||
| E → GHQ | −0.06 (0.119 ns) | −0.03 (0.461 ns) | −0.03 (0.594 ns) | 0.03 (0.452 ns) | −0.08 (0.050) |
| E → Social Class | 0.02 (0.657 ns) | −0.04 (0.177 ns) | −0.04 (0.203 ns) | 0.07 (0.077 ns) | −0.15 (0.001) |
| E → Physical Health | 0.00 (0.944 ns) | −0.00 (0.918 ns) | −0.00 (0.941 ns) | 0.07 (0.193 ns) | −0.06 (0.217 ns) |
| N → GHQ | 0.29 (0.000) | 0.34 (0.000) | 0.34 (0.000) | 0.30 (0.000) | 0.28 (0.000) |
| N → Social Class | 0.19 (0.000) | 0.15 (0.000) | 0.15 (0.000) | 0.16 (0.000) | 0.07 (0.060 ns) |
| N → Psychical Health | 0.23 (0.000) | 0.24 (0.000) | 0.24 (0.000) | 0.29 (0.000) | 0.19 (0.000) |
Notes: → = regression parameter; ↔ = correlation; E = Extraversion; N= Neuroticism; WEMWBS = Warwick Edinburgh Mental Well-Being Scale; SWL = Satisfaction with Life; GHQ = General Health Questionnaire. All parameters are standardized. p-values are shown in parentheses. Comparable estimates for the full structural model are presented in Figure 3.
3.6 Item Overlap Analysis
In total, we removed 19 items from the General Health Questionnaire and the WEMWBS (see Table 5) that were considered to overlap significantly with items from other inventories. We elected not to remove items from the personality measure given that this scale only contains 6 items. We re-estimated the main effects and full structural model using the reduced set of items.
Table 5. Items Excluded from Self-Report Inventories.
| Excluded Item | Suggested Overlapping Item |
|---|---|
| WEMWBS | |
| I’ve been feeling interested in other people. | Would you be very unhappy if you were prevented from making numerous social contacts? (MPI) |
| I’ve had energy to spare. | Are you sometimes bubbling over with energy and sometimes very sluggish? (MPI) |
| I’ve been thinking clearly. | Does your mind often wander while you are trying to concentrate? (MPI) |
| Are you frequently ’lost in thought’ even when supposed to be taking part in a conversation? (MPI) | |
| I’ve been feeling close to other people. | Would you be very unhappy if you were prevented from making numerous social contacts? (MPI) |
| GHQ | |
| Been feeling run down and out of sorts? | I’ve had energy to spare. (WEMWBS) |
| Been taking longer over the things you do? | Are you sometimes bubbling over with energy and sometimes very sluggish? (MPI) |
| Felt on the whole you were doing things well? | I’ve been feeling optimistic about the future. (WEMWBS) |
| I’ve been feeling useful. (WEMWBS) | |
| I’ve been feeling confident. (WEMWBS) | |
| Been satisfied with the way you’ve carried out your task? | I’ve been feeling useful. (WEMWBS) |
| I’ve been feeling confident. (WEMWBS) | |
| Felt that you are playing a useful part in things? | I’ve been feeling useful. (WEMWBS) |
| Felt capable of making decisions about things? | I’ve been able to make up my own mind about things. (WEMWBS) |
| Felt constantly under strain? | I’ve been feeling relaxed. (WEMWBS) |
| Been able to enjoy your normal day-to-day activities? | I’ve been feeling cheerful. (WEMWBS) |
| Been getting edgy and bad tempered? | I’ve been feeling relaxed. (WEMWBS) |
| Been getting scared and panicky for no good reason? | I’ve been feeling relaxed. (WEMWBS) |
| Found everything getting on top of you? | I’ve been feeling optimistic about the future. (WEMWBS) |
| I’ve been dealing with problems well. (WEMWBS) | |
| Been thinking of yourself as a worthless person? | I’ve been feeling useful. (WEMWBS) |
| I’ve been feeling good about myself. (WEMWBS) | |
| Felt that life is entirely hopeless? | I’ve been feeling optimistic about the future. (WEMWBS) |
| I’ve been feeling useful. (WEMWBS) | |
| I’ve been feeling confident. (WEMWBS | |
| Been feeling nervous and strung-up all the time? | I’ve been feeling relaxed. (WEMWBS) |
| Found at times you couldn’t do anything because your nerves were too bad? | I’ve been feeling relaxed. (WEMWBS) |
| I’ve been dealing with problems well. (WEMWBS) | |
| I’ve been able to make up my own mind about things. (WEMWBS) |
Note: WEMWBS = Warwick Edinburgh Mental Well-Being Scale; GHQ = General Health Questionnaire; MPI = Maudsley Personality Inventory.
The reduced models showed equally good fit to the data as the full models (CFI=.98 & .98; TLI=.98 & .98; RMSEA=.022 & .022; WRMR=1.654 & 1.642, respectively for the main effects and full structural models). The differences in the main parameter estimates are detailed in Table 6. All changes were at the second decimal place with the largest difference in effects being .04. It is of note that in the case of the direct effect of Neuroticism on WEMWBS, the increase in the magnitude of the estimate from −.08 to −.12 resulted in the parameter becoming significant in the reduced item model.
Table 6. Standardized Parameter Estimates for the Full and Reduced Item Models.
| Parameter | Full Model | Reduced Model | Difference |
|---|---|---|---|
| Main Effects Model | |||
| E → WEMWBS | .24 | .24 | .00 |
| N → WEMWBS | −.20 | −.21 | .01 |
| E → SWL | .16 | .15 | .01 |
| N → SWL | −.18 | −.18 | .00 |
| Full Structural Model | |||
| Direct Effects – Well-Being | |||
| E → WEMWBS | .23 | .23 | .00 |
| N → WEMWBS | −.08 | −.12 | .04 |
| GHQ → WEMWBS | −.30 | −.26 | .04 |
| Social Class → WEMWBS | −.05 | −.03 | .02 |
| Health → WEMWBS | −.06 | −.05 | .01 |
| E → SWL | .14 | .15 | .01 |
| N → SWL | −.08 | −.09 | .01 |
| GHQ → SWL | −.26 | −.22 | .04 |
| Social Class → SWL | .01 | .01 | .00 |
| Health → SWL | −.07 | −.07 | .00 |
| Direct Effects - Health | |||
| E → GHQ | −.04 | −.02 | .02 |
| E → Social Class | −.03 | −.03 | .00 |
| E → Physical Health | −.01 | .00 | .01 |
| N → GHQ | .33 | .34 | .01 |
| N → Social Class | .17 | .17 | .00 |
| N → Psychical Health | .24 | .25 | .01 |
Note: WEMWBS = Warwick Edinburgh Mental Well-Being Scale; GHQ = General Health Questionnaire; SWL = Satisfaction with Life.
4. Discussion
In this prospective study of 4583 men and women from a national birth cohort we found significant bivariate correlations between Neuroticism and Extraversion assessed at ages 16 and 26 years and scores on Warwick-Edinburgh Mental Wellbeing Scale and the Diener Satisfaction with Life Scale approximately forty years later. These correlations differed little in size from the overall bivariate correlations between Neuroticism and Extraversion and largely contemporaneous measures of wellbeing (−.22 and .17 respectively) that were estimated in a meta-analysis (Deneve & Cooper, 1998). In a structural equation model we examined the simultaneous effects of Neuroticism and Extraversion on wellbeing and tested the extent to which any such effects were mediated through attained socioeconomic position, psychological distress, and physical health problems. Extraversion assessed at ages 16 and 26 years had significant direct effects on wellbeing at age 60-64 years. Individuals who were higher in Extraversion tended to have greater wellbeing as assessed by the Warwick-Edinburgh Mental Wellbeing Scale and the Diener Satisfaction with Life Scale. The effects of Extraversion were not mediated through psychological distress, physical health problems or attained social class. Neuroticism assessed at ages 16 and 26 years had a smaller direct effect on mental wellbeing, such that higher Neuroticism was significantly associated with lower satisfaction with life scores only. However, there were indirect effects such that both psychological distress and to a lesser extent physical health significantly transmitted some of the effects of Neuroticism on the two measures of mental wellbeing at age 60-64 years.
To our knowledge, only one previous study has examined the long-term impact of Extraversion and Neuroticism on wellbeing with control for potential mediating factors. This study, based solely on the female members of the cohort used here, examined the relation between these personality traits at ages 16 and 26 years and aspects of psychological functioning measured by Ryff’s Psychological Wellbeing scale at age 52 years (Abbott et al., 2008). Greater Extraversion was directly associated with higher scores on the six dimensions of psychological functioning that make up this scale, and nearly all the effect of Neuroticism on these dimensions was indirect, mediated through susceptibility to psychological distress. There was no examination in that study of the potential mediating role of physical health. In the present study of men and women from the same cohort at age 60-64 years, when both eudaimonic and hedonic aspects of wellbeing were assessed, our findings show that, even after a period of nearly 50 years, Extraversion is a direct predictor of wellbeing, whereas up to 60% of the detrimental effect of higher Neuroticism on wellbeing is mediated through other factors, mainly psychological distress and also, to a lesser extent, poorer physical health. Of course, there may be some construct overlap between distress and wellbeing, in which case the mediation effects may be overestimated. When we re-estimated our model after excluding items from the General Health Questionnaire and the Warwick-Edinburgh Mental Wellbeing Scale that we thought overlapped with items from the other inventories, in general the main parameters estimates changed only slightly but the direct effect between Neuroticism and mental wellbeing was strengthened.
Other longitudinal studies have found that people higher in Neuroticism are more likely subsequently to report a range of physical health problems (Charles et al., 2008), but so far as we are aware none of these had as long an interval between assessment of Neuroticism and measurement of health status as in the present study. The strength of the association suggests that reducing Neuroticism in youth could potentially have an important impact on public health in later life.
It may that some of the effect on Extraversion on later wellbeing could have been mediated via other factors that we did not examine: prospective studies have shown that Extraversion is predictive of community involvement, such as volunteering, and quality of relationships (Ozer & Benet-Martinez, 2006), both of which may affect wellbeing.
One partial explanation for our findings might be that personality traits and wellbeing are influenced by shared genetic factors. In a representative sample of 973 twin pairs the genetic variance underlying individual differences in mental wellbeing was also responsible for individual differences in Neuroticism and Extraversion (Weiss, Bates, and Luciano, 2008). Shared genetic risk factors also explain much of the association between Neuroticism and susceptibility to depression (Kendler, Gatz, Gardner, & Pedersen, 2006). Another possibility is that these personality traits may affect wellbeing indirectly by predisposing individuals to particular life events, behaviors and experiences other than those examined here (Costa & McCrae, 1996; Magnus, Diener, Fujita, & Pavot, 1993).
The strengths of the present study lie in its size, its representativeness, the fact that we examined the effects of Neuroticism and Extraversion simultaneously, and the availability of data on several factors across the life course that might potentially mediate associations between personality and later mental wellbeing. It is worth emphasizing that these potential mediators were measured 10 years before wellbeing and more than thirty years after personality traits, making shared state-effects with either personality traits or wellbeing unlikely. Shared state-effects would have been more likely for contemporaneous measurements. Additional strengths are the fact that Neuroticism and Extraversion were measured on two occasions, at ages 16 and 26 years, thereby allowing us to derive a single latent factor for each personality dimension from these data, improving the reliability of the measures, and the fact that these personality dimensions had a relatively low correlation compared to that obtained with more modern inventories (Egan et al., 2000). Furthermore, mental wellbeing was modeled as latent traits thereby reducing random measurement error.
Our study also has some weaknesses. Neuroticism and Extraversion were assessed using a short-form version of Eysenck’s Maudsley Personality Inventory developed in 1958 based on six items for each trait (Eysenck, 1958). Contemporary definitions of these personality traits usually require a larger number of items to ensure that all facets of the traits are adequately covered (McCrae & Costa, 2003). Given the date when personality was assessed no data are available on the other Big Five personality factors -Conscientiousness, Agreeableness and Openness – so their additional effects on wellbeing remain untested here. There was no concurrent measure of personality at the time wellbeing was assessed at age 60-64 years and no concurrent measure of wellbeing at the time personality was assessed at age 16 and 26 years. Without being able to control for levels of wellbeing in youth we are unable to tell whether the more extravert members of the cohort were in fact just always happier. In addition, it is possible that the effects of personality in youth on later wellbeing that we observed might be accounted for by personality traits currently. There is some evidence that levels of neuroticism and extraversion can change over time as satisfaction with relationships or work change (Scollon & Diener, 2006). Without a concurrent measure of personality we cannot rule out the possibility that the measures of wellbeing, or indeed the GHQ data collected 10 years previously, are acting as proxies for later life levels of extraversion and neuroticism. What appear in our analyses to be effects over time, could in reality be two concurrent relationships. Further limitations of our study are that there has inevitably been some attrition of the original sample over time and data on wellbeing were not available for all those who took part in the follow-up at age 60-64 years. However, re-estimation of the model using list-wise deletion, maximum likelihood and robust maximum likelihood estimation, which apply full information maximum likelihood as a methodology for dealing with missing data, produced very similar results to those presented here so it seems unlikely that loss to follow-up has biased our findings.
A final consideration with respect to the measurement models presented in the current study was the need to include a number of model modifications in order to achieve satisfactory model fit. There remains debate as to whether such modifications should be included within a given model. Certainly, it is desirable for such additional parameters to be cross validated, which was not possible here. Alternative modeling strategies such as item parceling may have been possible. Item parceling, like the inclusion of model modifications, has pros and cons (Little, Rhemtulla, Gibson, & Schoemann, 2013). For the current analysis, we preferred to model item level data and to make explicit our model modifications where initial measurement models failed to show satisfactory model fit.
In this national birth cohort, we have shown that the personality traits Extraversion and Neuroticism measured using brief scales in youth are associated with wellbeing about 40 years later. Extraversion had a direct effect on later life wellbeing, whereas most of the impact of Neuroticism on wellbeing was mediated through susceptibility to psychological distress and physical health problems. Personality dispositions by the time of early adulthood have an enduring influence on wellbeing decades later.
Acknowledgments
The National Survey for Health and Development is funded by the Medical Research Council. The HALCyon collaborative research programme is funded by the New Dynamics of Ageing (NDA) programme (RES-353-25-0001), a joint seven-year initiative of five UK Research Councils. The Centre for Cognitive Ageing and Cognitive Epidemiology is funded by the Biotechnology Sciences Research Council, the Engineering and Physical Sciences Research Council, the Economic and Social Research Council, the Medical Research Council and the University of Edinburgh as part of the cross-council Lifelong Health and Wellbeing initiative (G0700704/84698).
Footnotes
In order to check the stability of the parameter estimates, we re-estimated the final mediation model in a number of different ways. Models were estimated using list wise deletion (n=1303) in order to assess the stability of the pair wise present missing data procedure applied when using WLSMV in Mplus as there was substantial variation in parameter coverage (36% to 100%). Secondly, we used two alternative estimation methods (maximum likelihood and robust maximum likelihood). This was done a) to assess model fit based on more the more commonly reported standardised root mean square residual (SRMR) not available with WLSMV estimation, and b) to further assess the issue of parameter coverage by estimating mores using full information maximum likelihood (FIML) procedures. FIML is considered to be one of the most robust methods for estimation of models in the presence of missingness (Enders & Bandalos, 2001). Finally, we estimated the model in males and females separately. Model fit was good across all re-estimations (Range CFI = .93 to .98; Range TLI = .92 to .98; Range RMSEA = .024 to .030; Range WRMR = 1.276 to 1.383). Table 4 displays the structural model parameters from all re-estimations.
References
- Abbott RA, Croudace TJ, Ploubidis GB, Kuh D, Richards M, Huppert FA. The relationship between early personality and midlife psychological well-being: evidence from a UK birth cohort study. Social Psychiatry and Psychiatric Epidemiology. 2008;43:679–687. doi: 10.1007/s00127-008-0355-8. doi:10.1007/s00127-008-0355-8. [DOI] [PMC free article] [PubMed] [Google Scholar]
- Bollen KA. Structural equations with latent variables. Wiley; New York: 1989. [Google Scholar]
- Chapman BP, Fiscella K, Kawachi I, Duberstein PR. Personality, socioeconomic status, and all-cause mortality in the United States. American Journal of Epidemiology. 2010;171(1):83–92. doi: 10.1093/aje/kwp323. doi: 10.1093/aje/kwp323. [DOI] [PMC free article] [PubMed] [Google Scholar]
- Charles ST, Gatz M, Kato K, Pedersen NL. Physical health 25 years later: the predictive ability of neuroticism. Health Psychology. 2008;27(3):369–378. doi: 10.1037/0278-6133.27.3.369. doi:10.1037/0278-6133.27.3.369. [DOI] [PubMed] [Google Scholar]
- Chida Y, Steptoe A. Positive psychological well-being and mortality: a quantitative review of prospective observational studies. Psychosomatic Medicine. 2008;70(7):741–756. doi: 10.1097/PSY.0b013e31818105ba. doi:10.1097/PSY.0b013e31818105ba. [DOI] [PubMed] [Google Scholar]
- Costa PT, McCrae RR. Personality as a lifelong determinant of wellbeing. In: Malatesta CZ, Izard CE, editors. Emotion in adult development. Sage Publications Inc.; Beverley Hills,CA: 1984. pp. 141–157. [Google Scholar]
- Costa PT, McCrae RR. Neuroticism, somatic complaints, and disease: is the bark worse than the bite? Journal of Personality. 1987;55(2):299–316. doi: 10.1111/j.1467-6494.1987.tb00438.x. doi:10.1111/j.1467-6494.1987.tb00438.x. [DOI] [PubMed] [Google Scholar]
- Costa PT, McCrae RR. 4 ways 5 factors are basic. Personality and Individual Differences. 1992;13(6):653–665. doi:10.1016/0191-8869(92)90236-I. [Google Scholar]
- Costa PT, McCrae RR. Mood and personality in adulthood. In: Magai C, McFadden SH, editors. Handbook of emotion, adult development, and aging. Academic Press; San Diego: 1996. pp. 369–383. [Google Scholar]
- Deneve KM, Cooper H. The happy personality: A meta-analysis of 137 personality traits and subjective well-being. Psychological Bulletin. 1998;124(2):197–229. doi: 10.1037/0033-2909.124.2.197. doi:10.1037/0033-2909.124.2.197. [DOI] [PubMed] [Google Scholar]
- Diener E. Subjective well-being - The science of happiness and a proposal for a national index. American Psychologist. 2000;55(1):34–43. doi:10.1037/0003-066X.55.1.34. [PubMed] [Google Scholar]
- Diener E. The evolving concept of subjective well-being: the multifaceted nature of happiness. Advances in Cell Aging and Gerontology. 2003;15:187–219. [Google Scholar]
- Diener E, Emmons RA. The independence of positive and negative affect. Journal of Personality and Social Psychology. 1984;47(5):1105–1117. doi: 10.1037//0022-3514.47.5.1105. doi:0.1037//0022-3514.47.5.1105. [DOI] [PubMed] [Google Scholar]
- Diener E, Emmons RA, Larsen RJ, Griffin S. The satisfaction with life scale. Journal of Personality Assessment. 1985;49(1):71–75. doi: 10.1207/s15327752jpa4901_13. doi:10.1207/s15327752jpa4901_13. [DOI] [PubMed] [Google Scholar]
- Duggan C, Milton J, Egan V, McCarthy L, Palmer B, Lee A. Theories of general personality and mental disorder. British Journal of Psychiatry. Supplement. 2003;182:S19–S23. doi: 10.1192/bjp.182.44.s19. doi:10.1192/bjp.182.44.s19. [DOI] [PubMed] [Google Scholar]
- Egan V, Deary I, Austin E. The NEO-FFI: emerging British norms and an item-level analysis suggest N, A and C are norms reliable than O and E. Personality and Individual Differences. 2000;29(5):907–920. doi:10.1016/S0191-8869(99)00242-1. [Google Scholar]
- Enders CK, Bandalos DL. The relative performance of full information maximum likelihood estimation for missing data in structural equation models. Structural Equation Modeling. 2001;8:430–457. doi:10.1207/S15328007SEM0803_5. [PubMed] [Google Scholar]
- Eysenck HJ. A short questionnaire for the measurement of two dimensions of personality. Journal of Applied Psychology. 1958;42:14–17. [Google Scholar]
- Forgeard MJ, Jayawickreme E, Kern ML, Seligman MEP. Doing the right thing: measuring wellbeing for public policy. International Journal of Wellbeing. 2011;1:79–106. [Google Scholar]
- Foster JA, MacQueen G. Neurobiological factors linking personality traits and major depression. Canadian Journal of Psychiatry-Revue Canadienne de Psychiatrie. 2008;53(1):6–13. doi: 10.1177/070674370805300103. [DOI] [PubMed] [Google Scholar]
- Friedman HS, Booth-Kewley S. The “disease-prone personality”. A meta-analytic view of the construct. The American Psychologist. 1987;42(6):539–555. doi: 10.1037//0003-066x.42.6.539. doi:10.1037/0003-066X.42.6.539. [DOI] [PubMed] [Google Scholar]
- Friedman HS, Tucker JS, Schwartz JE, Tomlinson Keasey C, Martin LR, Wingard DL, Criqui MH. Psychosocial and behavioral predictors of longevity - the aging and death of the Termites. American Psychologist. 1995;50(2):69–78. doi: 10.1037//0003-066x.50.2.69. doi:10.1037/0003-066X.50.2.69. [DOI] [PubMed] [Google Scholar]
- Garcia D. Two models of personality and well-being among adolescents. Personality and Individual Differences. 2011;50(8):1208–1212. doi:10.1016/j.paid.2011.02.009. [Google Scholar]
- Gerstorf D, Lovden M, Rocke C, Smith J, Lindenberger U. Well-being affects changes in perceptual speed in advanced old age: Longitudinal evidence for a dynamic link. Developmental Psychology. 2007;43(3):705–718. doi: 10.1037/0012-1649.43.3.705. doi:10.1037/0012-1649.43.3.705. [DOI] [PubMed] [Google Scholar]
- Goldberg DP, Hillier VF. A scaled version of the General Health Questionnaire. Psychological Medicine. 1979;9(1):139–145. doi: 10.1017/s0033291700021644. [DOI] [PubMed] [Google Scholar]
- Goodwin R, Engstrom G. Personality and the perception of health in the general population. Psychological Medicine. 2002;32(2):325–332. doi: 10.1017/s0033291701005104. doi:10.1017/S0033291701005104. [DOI] [PubMed] [Google Scholar]
- Hampson SE, Goldberg LR, Vogt TM, Dubanoski JP. Mechanisms by which childhood personality traits influence adult health status: Educational attainment and healthy behaviors. Health Psychology. 2007;26(1):121–125. doi: 10.1037/0278-6133.26.1.121. doi:10.1037/0278-6133.26.1.121. [DOI] [PMC free article] [PubMed] [Google Scholar]
- Hu LT, Bentler PM. Cutoff criteria for fit indexes in covariance structure analysis: conventional criteria versus new alternatives. Structural Equation Modeling-A Multidisciplinary Journal. 1999;6(1):1–55. doi:10.1080/10705519909540118. [Google Scholar]
- Huppert FA, Whittington JE. Evidence for the independence of positive and negative well-being: Implications for quality of life assessment. British Journal of Health Psychology. 2003;8:107–122. doi: 10.1348/135910703762879246. doi:10.1348/135910703762879246. [DOI] [PubMed] [Google Scholar]
- Iwasa H, Masui Y, Gondo Y, Inagaki H, Kawaai C, Suzuki T. Personality and all-cause mortality among older adults dwelling in a Japanese community: A five-year population-based prospective cohort study. American Journal of Geriatric Psychiatry. 2008;16(5):399–405. doi: 10.1097/JGP.0b013e3181662ac9. doi:10.1097/JGP.0b013e3181662ac9. [DOI] [PubMed] [Google Scholar]
- Jerram KL, Coleman PG. The big five personality traits and reporting of health problems and health behaviour in old age. British Journal of Health Psychology. 1999;4:181–192. doi:10.1348/135910799168560. [Google Scholar]
- Judge TA, Kammeyer-Mueller JD. On the value of aiming high: the causes and consequences of ambition. J Appl.Psychol. 2012;97(4):758–775. doi: 10.1037/a0028084. doi:10.1037/a0028084. [DOI] [PubMed] [Google Scholar]
- Kashdan TB, Biswas-Diener R, King LA. Reconsidering happiness: the costs of distinguishing between hedonics and eudaimonia. Journal of Positive Psychology. 2008;3(4):219–233. doi:10.1080/17439760802303044. [Google Scholar]
- Kendler KS, Gatz M, Gardner CO, Pedersen NL. Personality and major depression - A Swedish longitudinal, population-based twin study. Archives of General Psychiatry. 2006;63(10):1113–1120. doi: 10.1001/archpsyc.63.10.1113. doi:10.1001/archpsyc.63.10.1113. [DOI] [PubMed] [Google Scholar]
- Kuh D, Cooper R, Richards M, Gale C, von Zglinicki T, Guralnik J. A life course approach to healthy ageing: the HALCyon programme. Public Health. 2012;126(3):193–195. doi: 10.1016/j.puhe.2012.01.025. doi:10.1016/j.puhe.2012.01.025. [DOI] [PubMed] [Google Scholar]
- Kuh D, Pierce M, Adams J, Deanfield J, Ekelund U, Friberg P, Hardy R. Cohort profile: updating the cohort profile for the MRC National Survey of Health and Development: a new clinic-based data collection for ageing research. International Journal of Epidemiology. 2011;40(1):e1–9. doi: 10.1093/ije/dyq231. doi:10.1093/ije/dyq231. [DOI] [PMC free article] [PubMed] [Google Scholar]
- Lahey BB. Public health significance of neuroticism. American Psychologist. 2009;64(4):241–256. doi: 10.1037/a0015309. doi:10.1037/a0015309. [DOI] [PMC free article] [PubMed] [Google Scholar]
- Little TD, Rhemtulla M, Gibson K, Schoemann AM. Why the items versus parcels controversy needn’t be one. Psychological Methods. 2013;18:285–300. doi: 10.1037/a0033266. [DOI] [PMC free article] [PubMed] [Google Scholar]
- Lorenzo-Seva U, Ferrando PJ. FACTOR: A computer program to fit the exploratory factor analysis model. Behavioral Research Methods, Instruments and Computers. 2006;38:88–91. doi: 10.3758/bf03192753. doi:10.3758/BF03192753. [DOI] [PubMed] [Google Scholar]
- Lorenzo-Seva U, Timmerman ME, Kiers HAL. The Hull method for selecting the number of common factors. Multivariate Behavioural Research. 2011;46:340–364. doi: 10.1080/00273171.2011.564527. doi:10.1080/00273171.2011.564527. [DOI] [PubMed] [Google Scholar]
- Luhmann M, Lucas RE, Eid M, Diener E. The prospective effect of life satisfaction on life events. Social Psychological and Personality Science. 2013;4:39–45. doi:10.1037/a0025948. [Google Scholar]
- Lyubomirsky S, King L, Diener E. The benefits of frequent positive affect: Does happiness lead to success? Psychological Bulletin. 2005;131(6):803–855. doi: 10.1037/0033-2909.131.6.803. doi:10.1037/0033-2909.131.6.803. [DOI] [PubMed] [Google Scholar]
- Mackinnon DP, Lockwood CM, Williams J. Confidence limits for the indirect effect: Distribution of the product and resampling methods. Multivariate Behavioral Research. 2004;39:99–128. doi: 10.1207/s15327906mbr3901_4. doi:10.1207/s15327906mbr3901_4. [DOI] [PMC free article] [PubMed] [Google Scholar]
- Magnus K, Diener E, Fujita F, Pavot W. Extroversion and neuroticism as predictors of objective life events - A longitudinal analysis. Journal of Personality and Social Psychology. 1993;65(5):1046–1053. doi: 10.1037//0022-3514.65.5.1046. doi:10.1037/0022-3514.65.5.1046. [DOI] [PubMed] [Google Scholar]
- Matthews G, Deary IJ, Whiteman MC. Personality traits. 3rd edition ed. Cambridge University Press; Cambridge: 2009. Personality across the life span; pp. 63–84. [Google Scholar]
- McCrae RR, Costa PT. Personality in adulthood: a five-factor theory perspective. Guilford Press; New York: 2003. [Google Scholar]
- Michaelson J, Abdallah S, Steuer N, Thompson S, Marks N. National accounts of well-being: bringing real wealth onto the balance sheet. New Economics Foundation; London: 2009. [Google Scholar]
- Muthen LK, Muthen BO. Mplus user’s guide. Sixth edition Muthen & Muthen; Los Angeles, CA: 2010. [Google Scholar]
- Nave CS, Sherman RA, Funder DC. Beyond self-report in the study of hedonic and eudaimonic well-being: Correlations with acquaintance reports, clinician judgments and directly observed social behavior. Journal of Research in Personality. 2008;42(3):643–659. doi: 10.1016/j.jrp.2007.09.001. doi:10.1016/j.jrp.2007.09.001. [DOI] [PMC free article] [PubMed] [Google Scholar]
- Office for National Statistics . Standard occupational classification. HMSO; London: 2000. [Google Scholar]
- Ostir GV, Markides KS, Black SA, Goodwin JS. Emotional well-being predicts subsequent functional independence and survival. Journal of the American Geriatrics Society. 2000;48(5):473–478. doi: 10.1111/j.1532-5415.2000.tb04991.x. [DOI] [PubMed] [Google Scholar]
- Ostir GV, Markides KS, Peek MK, Goodwin JS. The association between emotional well-being and the incidence of stroke in older adults. Psychosomatic Medicine. 2001;63(2):210–215. doi: 10.1097/00006842-200103000-00003. [DOI] [PubMed] [Google Scholar]
- Ostir GV, Ottenbacher KJ, Markides KS. Onset of frailty in older adults and the protective role of positive affect. Psychology and Aging. 2004;19(3):402–408. doi: 10.1037/0882-7974.19.3.402. doi:10.1037/0882-7974.19.3.402. [DOI] [PubMed] [Google Scholar]
- Ozer DJ, Benet-Martinez V. Personality and the prediction of consequential outcomes. Annu. Rev. Psychol. 2006;57:401–421. doi: 10.1146/annurev.psych.57.102904.190127. doi:10.1146/annurev.psych.57.102904.190127. [DOI] [PubMed] [Google Scholar]
- Phillips AC, Batty GD, Weiss A, Deary I, Gale CR, Thomas GN, Carroll D. Neuroticism, cognitive ability, and the metabolic syndrome: The Vietnam Experience Study. Journal of Psychosomatic Research. 2010;69(2):193–201. doi: 10.1016/j.jpsychores.2010.01.016. doi:10.1016/j.jpsychores.2010.01.016. [DOI] [PubMed] [Google Scholar]
- Phillips AC, Carroll D, Burns VE, Drayson M. Neuroticism, cortisol reactivity, and antibody response to vaccination. Psychophysiology. 2005;42(2):232–238. doi: 10.1111/j.1469-8986.2005.00281.x. doi:10.1111/j.1469-8986.2005.00281.x. [DOI] [PubMed] [Google Scholar]
- Richards M, Huppert FA. Do positive children become positive adults? Evidence from a longitudinal birth cohort study. Journal of Positive Psychology. 2011;6(1):75–87. doi: 10.1080/17439760.2011.536655. doi:10.1080/17439760.2011.536655. [DOI] [PMC free article] [PubMed] [Google Scholar]
- Roberts BW, DelVecchio WF. The rank-order consistency of personality traits from childhood to old age: A quantitative review of longitudinal studies. Psychological Bulletin. 2000;126(1):3–25. doi: 10.1037/0033-2909.126.1.3. doi:10.1037/0033-2909.126.1.3. [DOI] [PubMed] [Google Scholar]
- Roberts BW, Kuncel NR, Shiner R, Caspi A, Goldberg LR. The power of personality the comparative validity of personality traits, socioeconomic status, and cognitive ability for predicting important life outcomes. Perspectives on Psychological Science. 2007;2(4):313–345. doi: 10.1111/j.1745-6916.2007.00047.x. doi:10.1111/j.1745-6916.2007.00047.x. [DOI] [PMC free article] [PubMed] [Google Scholar]
- Rose GA, Blackburn H. Cardiovascular survey methods. World Health Organization; 1968. (World Health Organization Monograph Series; no 56). [PubMed] [Google Scholar]
- Ryan RM, Deci EL. Self-determination theory and the facilitation of intrinsic motivation, social development, and well-being. American Psychologist. 2000;55(1):68–78. doi: 10.1037//0003-066x.55.1.68. doi:10.1037//0003-066X.55.1.68. [DOI] [PubMed] [Google Scholar]
- Ryan RM, Deci EL. On happiness and human potentials: a review of research on hedonic and eudaimonic well-being. Annual Review of Psychology. 2001;52:141–166. doi: 10.1146/annurev.psych.52.1.141. doi:10.1146/annurev.psych.52.1.141. [DOI] [PubMed] [Google Scholar]
- Ryff CD. In the eye of the beholder - views of psychological well-being among middle-aged and older adults. Psychology and Aging. 1989;4(2):195–210. doi: 10.1037//0882-7974.4.2.195. doi:10.1037//0882-7974.4.2.195. [DOI] [PubMed] [Google Scholar]
- Ryff CD, Keyes CL. The structure of psychological well-being revisited. Journal of Personality and Social Psychology. 1995;69(4):719–727. doi: 10.1037//0022-3514.69.4.719. doi:10.1037/0022-3514.69.4.719. [DOI] [PubMed] [Google Scholar]
- Schmutte PS, Ryff CD. Personality and well-being: reexamining methods and meanings. Journal of Personality and Social Psychology. 1997;73(3):549–559. doi: 10.1037//0022-3514.73.3.549. doi:10.1037//0022-3514.73.3.549. [DOI] [PubMed] [Google Scholar]
- Scollon CN, Diener E. Love, work, and changes in extraversion and neuroticism over time. Journal of Personality and Social Psychology. 2006;91:1152–1165. doi: 10.1037/0022-3514.91.6.1152. doi:10.1037/0022.3514.91.6.1152. [DOI] [PubMed] [Google Scholar]
- Stafford M, Black S, Shah I, Hardy R, Pierce M, Richards M, Kuh D. Using a birth cohort to study ageing: representativeness and response rates in the National Survey of Health and Development. European Journal of Ageing. 2013;10(2):145–157. doi: 10.1007/s10433-013-0258-8. doi:10.1007/s10433-013-0258-8. [DOI] [PMC free article] [PubMed] [Google Scholar]
- Tennant R, Hiller L, Fishwick R, Platt S, Joseph S, Weich S, Stewart-Brown S. The Warwick-Edinburgh mental well-being scale (WEMWBS): development and UK validation. Health Qual.Life Outcomes. 2007;5:63. doi: 10.1186/1477-7525-5-63. doi:10.1186/1477-7525-5-63. [DOI] [PMC free article] [PubMed] [Google Scholar]
- Thoresen CJ, Kaplan SA, Barsky AP, Warren CR, de Chermont K. The affective underpinnings of job perceptions and attitudes: a meta-analytic review and integration. Psychological Bulletin. 2003;129(6):914–945. doi: 10.1037/0033-2909.129.6.914. doi:10.1037/0033-2909.129.6.914. [DOI] [PubMed] [Google Scholar]
- Timmerman ME, Lorenzo-Seva U. Dimensionality assessment of ordered polytomous items with parallel analysis. Psychological Methods. 2011;16 doi: 10.1037/a0023353. doi:10.1037/a0023353. [DOI] [PubMed] [Google Scholar]
- Velicer WF. Determining the number of components from the matrix of partial correlations. Psychometrika. 1976;41:321–327. doi:10.1007/BF02293557. [Google Scholar]
- Weiss A, Bates TC, Luciano M. Happiness is a personal(ity) thing: the genetics of personality and well-being in a representative sample. Psychological Science. 2008;19:205–210. doi: 10.1111/j.1467-9280.2008.02068.x. doi:10.1111/j.1467-9280.2008.02068.x. [DOI] [PubMed] [Google Scholar]
- Weiss A, Gale CR, Batty GD, Deary IJ. Emotionally stable, intelligent men live longer: The Vietnam Experience Study Cohort. Psychosomatic Medicine. 2009;71(4):385–394. doi: 10.1097/PSY.0b013e318198de78. doi:10.1097/PSY.0b013e318198de78. [DOI] [PubMed] [Google Scholar]
- Yu CY. Evaluating cutoff criteria of model fit indices for latent variable models with binary and continuous outcomes [Unpublished doctoral dissertation] University of California; Los Angeles, CA: 2002. [Google Scholar]