Abstract
The Cancer Genome Atlas (TCGA) has used the latest sequencing and analysis methods to identify somatic variants across thousands of tumours. Here we present data and analytical results for point mutations and small insertions/deletions from 3,281 tumours across 12 tumour types as part of the TCGA Pan-Cancer effort. We illustrate the distributions of mutation frequencies, types and contexts across tumour types, and establish their links to tissues of origin, environmental/carcinogen influences, and DNA repair defects. Using the integrated data sets, we identified 127 significantly mutated genes from well-known (for example, mitogen-activated protein kinase, phosphatidylinositol-3-OH kinase, Wnt/β-catenin and receptor tyrosine kinase signalling pathways, and cell cycle control) and emerging (for example, histone, histone modification, splicing, metabolism and proteolysis) cellular processes in cancer. The average number of mutations in these significantly mutated genes varies across tumour types; most tumours have two to six, indicating that the number of driver mutations required during oncogenesis is relatively small. Mutations in transcriptional factors/regulators show tissue specificity, whereas histone modifiers are often mutated across several cancer types. Clinical association analysis identifies genes having a significant effect on survival, and investigations of mutations with respect to clonal/subclonal architecture delineate their temporal orders during tumorigenesis. Taken together, these results lay the groundwork for developing new diagnostics and individualizing cancer treatment.
Supplementary information
The online version of this article (doi:10.1038/nature12634) contains supplementary material, which is available to authorized users.
Subject terms: Cancer genomics, Cancer
As part of The Cancer Genome Atlas Pan-Cancer effort, data analysis for point mutations and small indels from 3,281 tumours and 12 tumour types is presented; among the findings are 127 significantly mutated genes from cellular processes with both established and emerging links in cancer, and an indication that the number of driver mutations required for oncogenesis is relatively small.
Supplementary information
The online version of this article (doi:10.1038/nature12634) contains supplementary material, which is available to authorized users.
Genomic landscape of twelve tumour types
As part of The Cancer Genome Atlas Pan-Cancer project, these authors present data analysis for point mutations and small indels from more than 3,000 tumours representing 12 tumour types. Among the findings are 127 significantly mutated genes from cellular processes with both established and emerging links to cancer, and an indication that the number of driver mutations required for oncogenesis is relatively small. Additional analyses also identify genes with significant impact on survival and a likely temporal order of mutational events during tumorigenesis.
Supplementary information
The online version of this article (doi:10.1038/nature12634) contains supplementary material, which is available to authorized users.
Main
The advancement of DNA sequencing technologies now enables the processing of thousands of tumours of many types for systematic mutation discovery. This expansion of scope, coupled with appreciable progress in algorithms1,2,3,4,5, has led directly to characterization of significant functional mutations, genes and pathways6,7,8,9,10,11,12,13,14,15,16,17,18. Cancer encompasses more than 100 related diseases19, making it crucial to understand the commonalities and differences among various types and subtypes. TCGA was founded to address these needs, and its large data sets are providing unprecedented opportunities for systematic, integrated analysis.
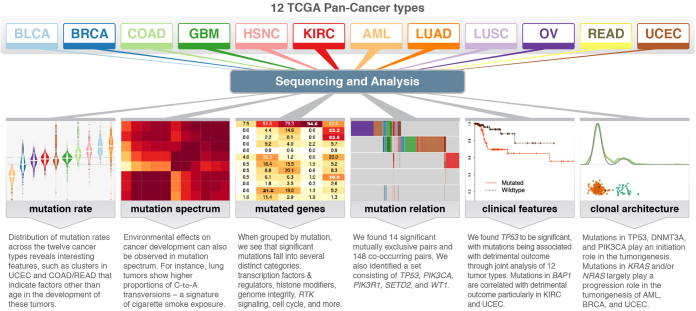
We performed a systematic analysis of 3,281 tumours from 12 cancer types to investigate underlying mechanisms of cancer initiation and progression. We describe variable mutation frequencies and contexts and their associations with environmental factors and defects in DNA repair. We identify 127 significantly mutated genes (SMGs) from diverse signalling and enzymatic processes. The finding of a TP53-driven breast, head and neck, and ovarian cancer cluster with a dearth of other mutations in SMGs suggests common therapeutic strategies might be applied for these tumours. We determined interactions among mutations and correlated mutations in BAP1, FBXW7 and TP53 with detrimental phenotypes across several cancer types. The subclonal structure and transcription status of underlying somatic mutations reveal the trajectory of tumour progression in patients with cancer.
Standardization of mutation data
Stringent filters (Methods) were applied to ensure high quality mutation calls for 12 cancer types: breast adenocarcinoma (BRCA), lung adenocarcinoma (LUAD), lung squamous cell carcinoma (LUSC), uterine corpus endometrial carcinoma (UCEC), glioblastoma multiforme (GBM), head and neck squamous cell carcinoma (HNSC), colon and rectal carcinoma (COAD, READ), bladder urothelial carcinoma (BLCA), kidney renal clear cell carcinoma (KIRC), ovarian serous carcinoma (OV) and acute myeloid leukaemia (LAML; conventionally called AML) (Supplementary Table 1). A total of 617,354 somatic mutations, consisting of 398,750 missense, 145,488 silent, 36,443 nonsense, 9,778 splice site, 7,693 non-coding RNA, 523 non-stop/readthrough, 15,141 frameshift insertions/deletions (indels) and 3,538 inframe indels, were included for downstream analyses (Supplementary Table 2).
Distinct mutation frequencies and sequence context
Figure 1a shows that AML has the lowest median mutation frequency and LUSC the highest (0.28 and 8.15 mutations per megabase (Mb), respectively). Besides AML, all types average over 1 mutation per Mb, substantially higher than in paediatric tumours20. Clustering21 illustrates that mutation frequencies for KIRC, BRCA, OV and AML are normally distributed within a single cluster, whereas other types have several clusters (for example, 5 and 6 clusters in UCEC and COAD/READ, respectively) (Fig. 1a and Supplementary Table 3a, b). In UCEC, the largest patient cluster has a frequency of approximately 1.5 mutations per Mb, and the cluster with the highest frequency is more than 150 times greater. Multiple clusters suggest that factors other than age contribute to development in these tumours14,16. Indeed, there is a significant correlation between high mutation frequency and DNA repair pathway genes (for example, PRKDC, TP53 and MSH6) (Supplementary Table 3c). Notably, PRKDC mutations are associated with high frequency in BLCA, COAD/READ, LUAD and UCEC, whereas TP53 mutations are related with higher frequencies in AML, BLCA, BRCA, HNSC, LUAD, LUSC and UCEC (all P < 0.05). Mutations in POLQ and POLE associate with high frequencies in multiple cancer types; POLE association in UCEC is consistent with previous observations14.
Figure 1. Mutation frequencies, spectra and contexts across 12 cancer types.
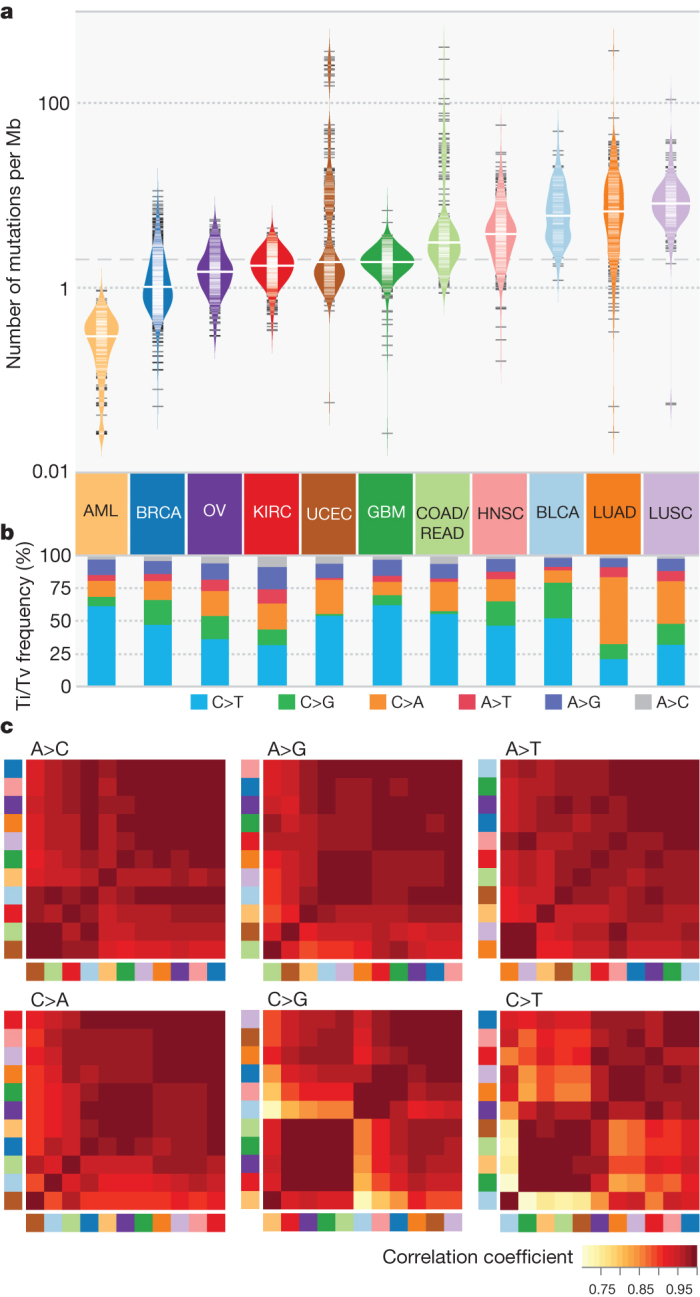
a, Distribution of mutation frequencies across 12 cancer types. Dashed grey and solid white lines denote average across cancer types and median for each type, respectively. b, Mutation spectrum of six transition (Ti) and transversion (Tv) categories for each cancer type. c, Hierarchically clustered mutation context (defined by the proportion of A, T, C and G nucleotides within ±2 bp of variant site) for six mutation categories. Cancer types correspond to colours in a. Colour denotes degree of correlation: yellow (r = 0.75) and red (r = 1).
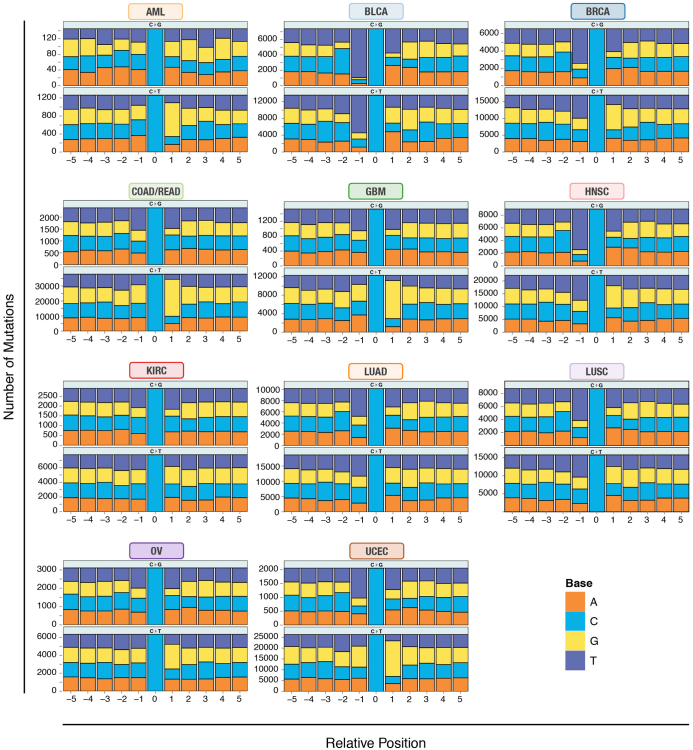
Comparison of spectra across the 12 types (Fig. 1b and Supplementary Table 3d) reveals that LUSC and LUAD contain increased C>A transversions, a signature of cigarette smoke exposure10. Sequence context analysis across 12 types revealed the largest difference being in C>T transitions and C>G transversions (Fig. 1c). The frequency of thymine 1-bp (base pair) upstream of C>G transversions is markedly higher in BLCA, BRCA and HNSC than in other cancer types (Extended Data Fig. 1). GBM, AML, COAD/READ and UCEC have similar contexts in that the proportions of guanine 1 base downstream of C>T transitions are between 59% and 67%, substantially higher than the approximately 40% in other cancer types. Higher frequencies of transition mutations at CpG in gastrointestinal tumours, including colorectal, were previously reported22. We found three additional cancer types (GBM, AML and UCEC) clustered in the C>T mutation at CpG, consistent with previous findings of aberrant DNA methylation in endometrial cancer23 and glioblastoma24. BLCA has a unique signature for C>T transitions compared to the other types (enriched for TC) (Extended Data Fig. 1).
Extended Data Figure 1. Mutation context across 12 cancer types.
Mutation context showing proportions of A, T, C and G nucleotides within ±5 bp for all validated mutations of type C>G/G>C and C>T/G>A across all 12 cancer types. The y axis denotes the total number of mutations in each category.
Significantly mutated genes
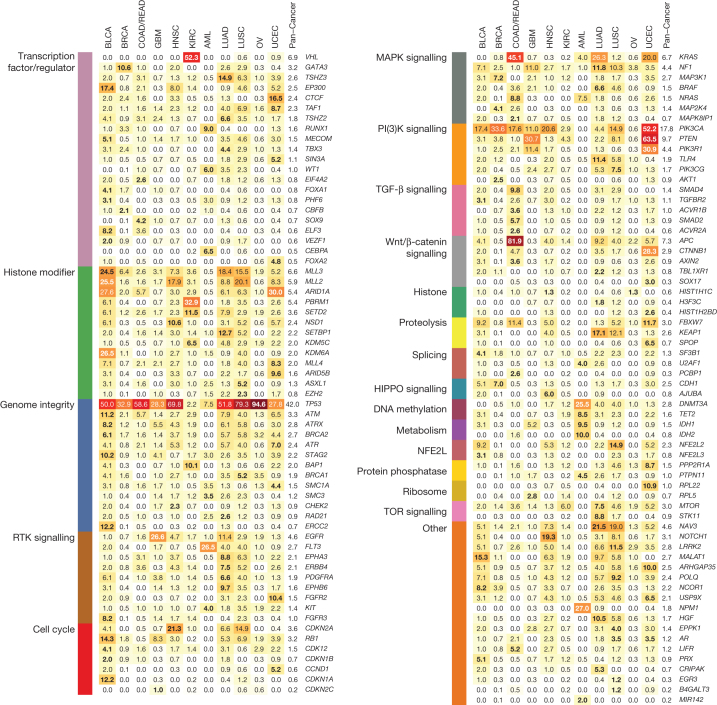
Genes under positive selection, either in individual or multiple tumour types, tend to display higher mutation frequencies above background. Our statistical analysis3, guided by expression data and curation (Methods), identified 127 such genes (SMGs; Supplementary Table 4). These SMGs are involved in a wide range of cellular processes, broadly classified into 20 categories (Fig. 2), including transcription factors/regulators, histone modifiers, genome integrity, receptor tyrosine kinase signalling, cell cycle, mitogen-activated protein kinases (MAPK) signalling, phosphatidylinositol-3-OH kinase (PI(3)K) signalling, Wnt/β-catenin signalling, histones, ubiquitin-mediated proteolysis, and splicing (Fig. 2). The identification of MAPK, PI(3)K and Wnt/β-catenin signalling pathways is consistent with classical cancer studies. Notably, newer categories (for example, splicing, transcription regulators, metabolism, proteolysis and histones) emerge as exciting guides for the development of new therapeutic targets. Genes categorized as histone modifiers (Z = 0.57), PI(3)K signalling (Z = 1.03), and genome integrity (Z = 0.66) all relate to more than one cancer type, whereas transcription factor/regulator (Z = 0.40), TGF-β signalling (Z = 0.66), and Wnt/β-catenin signalling (Z = 0.55) genes tend to associate with single types (Methods).
Figure 2. The 127 SMGs from 20 cellular processes in cancer identified in 12 cancer types.
Percentages of samples mutated in individual tumour types and Pan-Cancer are shown, with the highest percentage in each gene among 12 cancer types in bold.
Notably, 3,053 out of 3,281 total samples (93%) across the Pan-Cancer collection had at least one non-synonymous mutation in at least one SMG. The average number of point mutations and small indels in these genes varies across tumour types, with the highest (∼6 mutations per tumour) in UCEC, LUAD and LUSC, and the lowest (∼2 mutations per tumour) in AML, BRCA, KIRC and OV. This suggests that the numbers of both cancer-related genes (only 127 identified in this study) and cooperating driver mutations required during oncogenesis are small (most cases only had 2–6) (Fig. 3), although large-scale structural rearrangements were not included in this analysis.
Figure 3. Distribution of mutations in 127 SMGs across Pan-Cancer cohort.
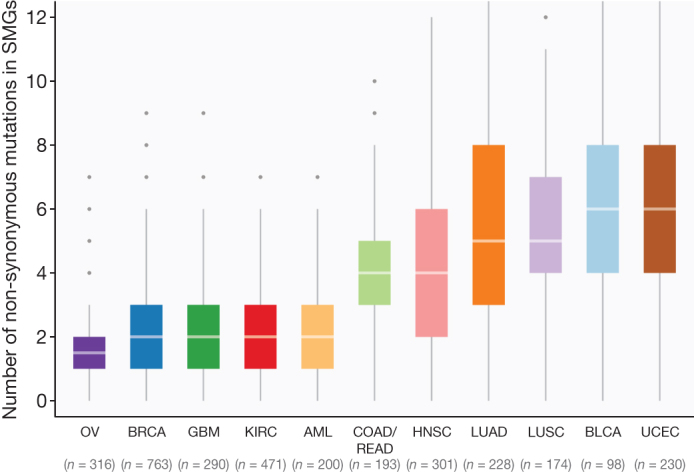
Box plot displays median numbers of non-synonymous mutations, with outliers shown as dots. In total, 3,210 tumours were used for this analysis (hypermutators excluded).
Common mutations
The most frequently mutated gene in the Pan-Cancer cohort is TP53 (42% of samples). Its mutations predominate in serous ovarian (95%) and serous endometrial carcinomas (89%) (Fig. 2). TP53 mutations are also associated with basal subtype breast tumours. PIK3CA is the second most commonly mutated gene, occurring frequently (>10%) in most cancer types except OV, KIRC, LUAD and AML. PIK3CA mutations frequented UCEC (52%) and BRCA (33.6%), being specifically enriched in luminal subtype tumours. Tumours lacking PIK3CA mutations often had mutations in PIK3R1, with the highest occurrences in UCEC (31%) and GBM (11%) (Fig. 2).
Many cancer types carried mutations in chromatin re-modelling genes. In particular, histone-lysine N-methyltransferase genes (MLL2 (also known as KMT2D), MLL3 (KMT2C) and MLL4 (KMT2B)) cluster in bladder, lung and endometrial cancers, whereas the lysine (K)-specific demethylase KDM5C is prevalently mutated in KIRC (7%). Mutations in ARID1A are frequent in BLCA, UCEC, LUAD and LUSC, whereas mutations in ARID5B predominate in UCEC (10%) (Fig. 2).
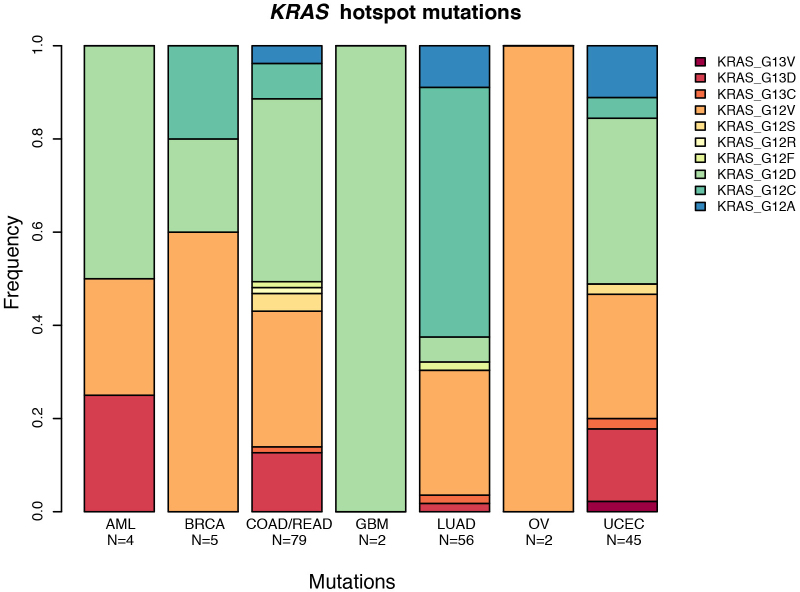
KRAS and NRAS mutations are typically mutually exclusive, with recurrent activating mutations (KRAS (Gly 12), KRAS (Gly 13) and NRAS (Gln 61)) common in COAD/READ (30%, 5% and 5%, respectively), UCEC (15%, 4% and 2%) and LUAD (24%, 1% and 2%). EGFR mutations are frequent in GBM (27%) and LUAD (11%). Recurrent, gain-of-function mutations in IDH1 (Arg 132) and/or IDH2 (Arg 172) typify GBM and AML (Supplementary Table 2 and Fig. 2). Although KRAS residues Gly 12 and Gly 13 are commonly mutated in LUAD, COAD/READ and UCEC, the proportion of Gly12Cys changes is significantly higher in lung cancer (P < 3.2 × 10⁻¹⁰), resulting from the high C>A transversion rate (Extended Data Fig. 2).
Extended Data Figure 2. The distribution of KRAS hotspot mutations across tumour types.
Distribution of changes caused by mutations of the KRAS hotspot at amino acids 12 and 13. Lung adenocarcinoma has a significantly higher proportion of Gly12Cys mutations than other cancers (P < 3.2 × 10⁻¹⁰), caused by the increase in C>A transversions in the genomic DNA at that location.
Tumour-type-specific mutations
Signature mutations exclusive to KIRC include those affecting VHL (52%) and PBRM1 (33%) (Fig. 2). Mutations to BAP1 (10%) and SETD2 (12%) are also most common in KIRC. Transcription factor CTCF, ribosome component RPL22, and histone modifiers ARID1A and ARID5B have the highest frequencies in UCEC. Predominant COAD/READ-specific mutations are those affecting APC (82%) and Wnt/β-catenin signalling (93% of samples). Several mutations occur exclusively in AML, including recurrent mutations in NPM1 (27%) and FLT3 (27%), and rare mutations affecting MIR142 (Fig. 2). Mutations of methylation and chromatin modifiers are also typical in AML, mostly affecting DNMT3A and TET2. BRCA-specific mutations include GATA3 and MAP3K1, whereas KEAP1 mutations predominate in lung cancer (LUAD 17%, LUSC 12%). EPHA3 (9%), SETBP1 (13%) and STK11 (9%) are characteristic in LUAD.
Shared and cancer type-specific mutation signatures
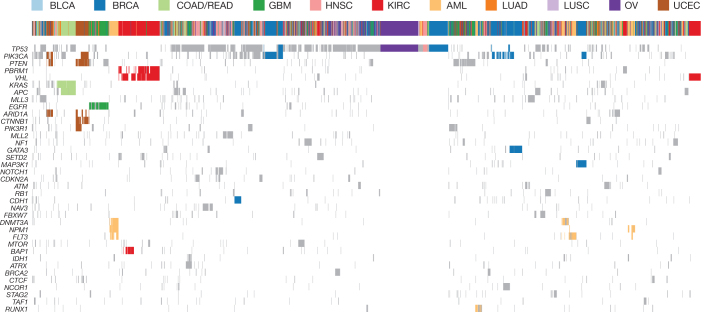
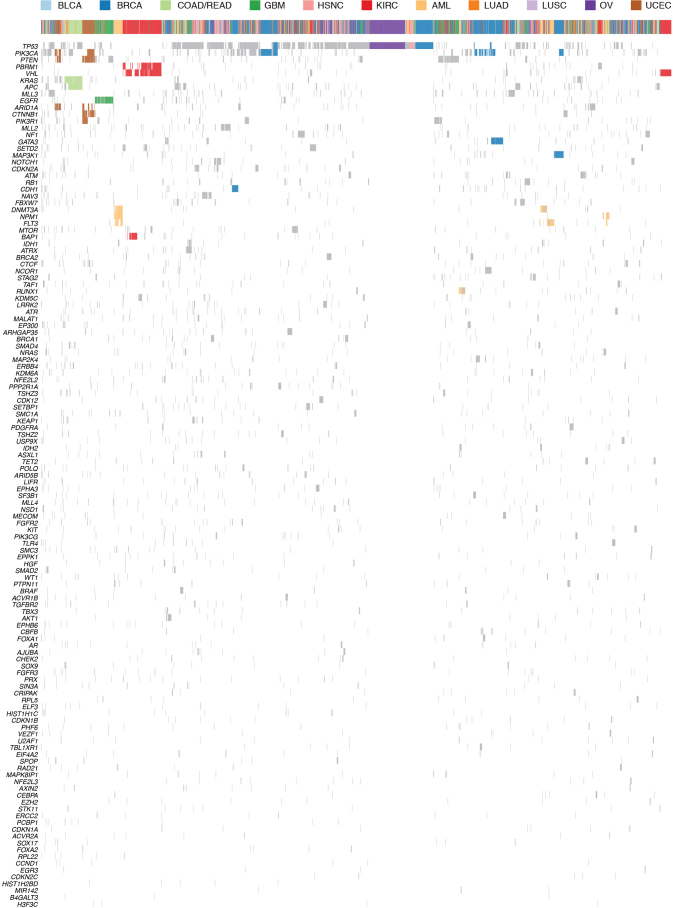
Cluster analysis on mutations in SMGs (Fig. 4 and Extended Data Fig. 3) showed 72% (1,881 of 2,611) of tumours are adjacent to those from the same tissue type. Notably, clustering identified several dominant groups in UCEC, COAD, GBM, AML, KIRC, OV and BRCA. Two major endometrial endometroid clusters were found, one having mutations in PIK3CA, PTEN and ARID1A, and the other containing mutations in two additional genes (PIK3R1 and CTNNB1). Five major breast cancer clusters were observed, with mutations in CDH1, GATA3, MAP3K1, PIK3CA and TP53 as drivers for respective clusters. The TP53-driven cluster is adjacent to an HNSC cluster and an ovarian cancer cluster, all having a dearth of other SMG mutations (Fig. 4). The glioblastoma cluster is characterized by mutations in EGFR. Two kidney clear cell cancer clusters were detected; both have VHL as the common driver and one has additional mutations in PBRM1 and/or BAP1 (refs 25–27). PBRM1 and BAP1 mutations are mutually exclusive in KIRC (P = 0.006), consistent with previous reports26,28. AML has three major clusters represented by various combinations of DNMT3A, NPM1 and FLT3 mutations, and one cluster dominated by RUNX1 mutations. One cluster having APC and KRAS mutations was almost exclusively detected in COAD/READ. Tumours from BLCA, HNSC, LUAD and LUSC are largely scattered over the Pan-Cancer cohort, indicating extensive heterogeneity in these diseases.
Figure 4. Unsupervised clustering based on mutation status of SMGs.
Tumours having no mutation or more than 500 mutations were excluded. A mutation status matrix was constructed for 2,611 tumours. Major clusters of mutations detected in UCEC, COAD, GBM, AML, KIRC, OV and BRCA were highlighted. Complete gene list shown in Extended Data Fig. 3.
Extended Data Figure 3. Unsupervised clustering based on mutation status of SMGs.
Tumours having no mutation or more than 500 mutations were excluded to reduce noise. A mutation status matrix was constructed for 2,611 tumours. Major clusters of mutations detected in UCEC, COAD, GBM, AML, KIRC, OV and BRCA were highlighted. The shorter version is shown in Fig. 4.
Mutual exclusivity and co-occurrence among SMGs
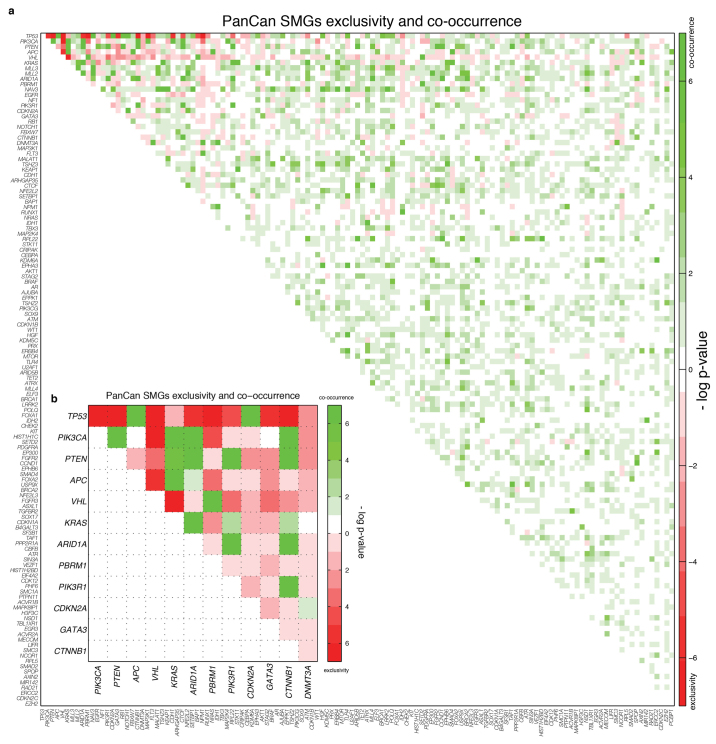
Pairwise exclusivity and co-occurrence analysis for the 127 SMGs found 14 mutually exclusive (false discovery rate (FDR) < 0.05) and 148 co-occurring (FDR < 0.05) pairs (Supplementary Table 6). TP53 and CDH1 are exclusive in BRCA, with mutations enriched in different subtypes13, as are TP53 and CTNNB1 in UCEC. Cohort analysis identified pairs where at least one gene has mutations strongly associated (corrected P < 0.05) to one cancer type, and also identifies TP53 and PIK3CA with significant exclusivity (Extended Data Fig. 4). Pairs with significant co-occurrence include IDH1 and ATRX in GBM29, TP53 and CDKN2A in HNSC, and TBX3 and MLL4 in LUAD.
Extended Data Figure 4. Mutation relation analysis in individual tumour types and the Pan-Cancer set.
a, Exclusivity and co-occurrence between SMGs in each tumour type. The −log10 P value appears in either red or green if the pair shows exclusivity or co-occurrence, respectively. b, Exclusivity and co-occurrence between genes in the most significant (q < 0.05) pairs in Pan-Cancer set. Colour scheme is as in a.
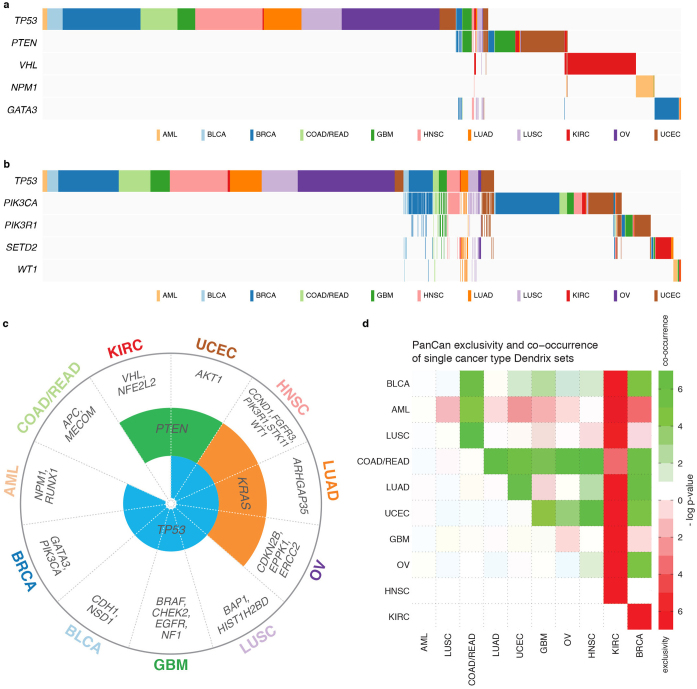
Dendrix30 identified a set of five genes (TP53, PTEN, VHL, NPM1 and GATA3) having strong mutual exclusivity (P < 0.01) (Extended Data Fig. 5a and Supplementary Table 7). Not surprisingly, many are associated (P < 0.05) with one cancer type (for example, VHL mutations in KIRC), demonstrating a strong relationship between exclusivity and tissue of origin. When 600 non-cancer-type-specific genes were added to the analysis (Methods), we identified another set consisting of TP53, PIK3CA, PIK3R1, SETD2 and WT1 (P < 0.01; Extended Data Fig. 5b and Supplementary Table 7). Dendrix also finds genes with strong mutual exclusivity from each cancer type separately (Extended Data Fig. 5c), allowing calculation of ‘cancer exclusivity’. KIRC has the strongest exclusivity from the other 11 cancer types, followed by AML with clear exclusivity from BRCA and UCEC. Conversely, COAD/READ displayed the greatest co-occurrence with other cancer types (Extended Data Fig. 5d).
Extended Data Figure 5. Mutually exclusive mutations identified by Dendrix in the Pan-Cancer and individual cancer type data sets.
a, The highest scoring exclusive set of mutated genes in 127 SMGs contains several genes that are strongly associated with one cancer type. b, The highest scoring exclusive set of mutations in the top 600 genes (not enriched for mutations in one cancer type) reported by MuSiC. c, Relationships between exclusive gene sets identified by Dendrix in individual cancer types. Eight types include TP53 in the most exclusive set, three include KRAS, and two include PTEN, with the remaining genes appearing in only a single type. d, Exclusivity and co-occurrence assessed at the Pan-Cancer level. The −log10 P value appears in red or green if the pair shows exclusivity or co-occurrence, respectively. KIRC is most exclusive to other tumour types, whereas COAD/READ presented strong co-occurrence with other types.
Clinical correlation across tumour types
We examined how clinical features (Supplementary Table 8) correlate with somatic events in 127 SMGs within tumour types. Some findings are unsurprising, such as the correlation of TP53 mutations with generally unfavourable indicators, for example in tumour stage (P = 0.01, Fisher's exact test) and elapsed time to death (P = 0.006, Wilcoxon) in HNSC, age (P = 0.002, Wilcoxon rank test) and time to death (P = 0.09, Wilcoxon) in AML, and vital status in OV (P = 0.04, Fisher). In UCEC, mutations in several genes are correlated with the endometrioid rather than serous subtype: PTEN, CTNNB1, PIK3R1, KRAS, ARID1A, CTCF, RPL22 and ARID5B (all P < 0.03) (Supplementary Table 9).
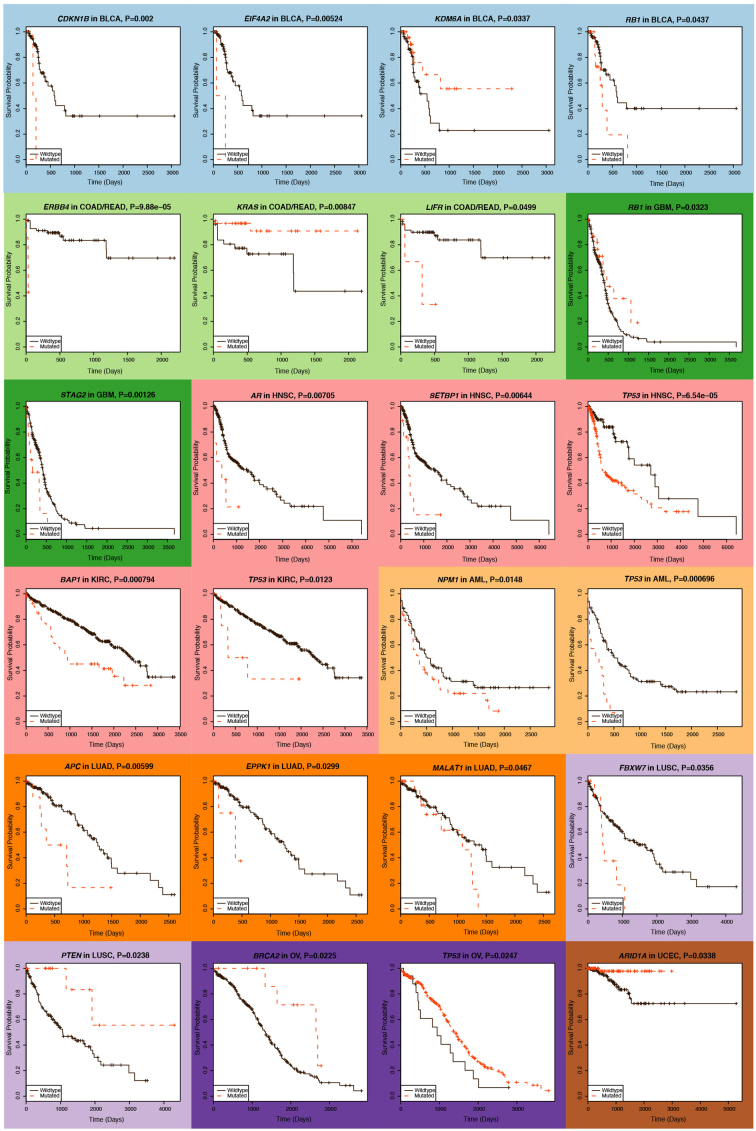
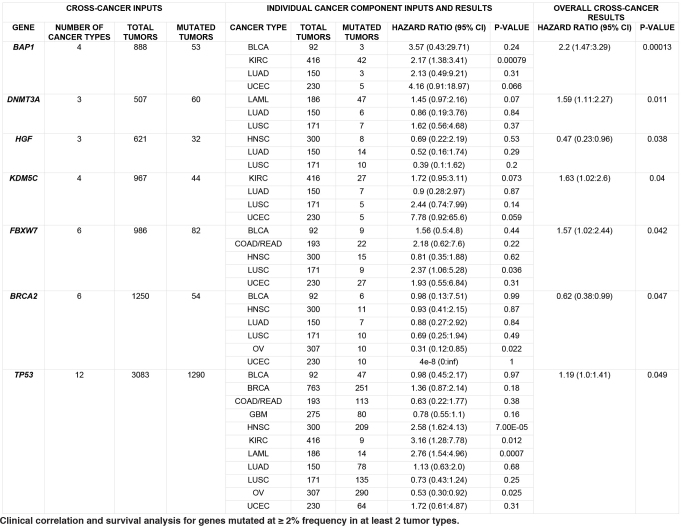
We examined which genes correlate with survival using the Cox proportional hazards model, first analysing individual cancer types using age and gender as covariates; an average of 2 genes (range: 0–4) with mutation frequency ≥2% were significant (P ≤ 0.05) in each type (Supplementary Table 10a and Extended Data Fig. 6). KDM6A and ARID1A mutations correlate with better survival in BLCA (P = 0.03, hazard ratio (HR) = 0.36, 95% confidence interval (CI): 0.14–0.92) and UCEC (P = 0.03, HR = 0.11, 95% CI: 0.01–0.84), respectively, but mutations in SETBP1, recently identified with worse prognosis in atypical chronic myeloid leukaemia (aCML)31, have a significant detrimental effect in HNSC (P = 0.006, HR = 3.21, 95% CI: 1.39–7.44). BAP1 strongly correlates with poor survival (P = 0.00079, HR = 2.17, 95% CI: 1.38–3.41) in KIRC. Conversely, BRCA2 mutations (P = 0.02, HR = 0.31, 95% CI: 0.12–0.85) associate with better survival in ovarian cancer, consistent with previous reports32,33; BRCA1 mutations showed positive correlation with better survival, but did not reach significance here.
Extended Data Figure 6. Kaplan–Meier plots for genes significantly associated with survival.
Plots are shown for 24 genes showing significant (P ≤ 0.05) association in individual cancer types. Although NPM1 mutations in patients with AML having intermediate cytogenetic risk are relatively benign in the absence of internal tandem duplications in FLT3, we did not stratify patients based on cytogenetics or FLT3 internal tandem duplication status in this analysis, and cannot discern this effect. Because most patients with OV (95%) have TP53 mutations, we could not obtain sufficient non-TP53 mutant controls for confidently dissecting the relationship between TP53 status and survival in OV.
We extended our survival analysis across cancer types, restricting our attention to the subset of 97 SMGs whose mutations appeared in ≥2% of patients having survival data in ≥2 tumour types. Taking type, age and gender as covariates, we found 7 significant genes: BAP1, DNMT3A, HGF, KDM5C, FBXW7, BRCA2 and TP53 (Extended Data Table 1). In particular, BAP1 was highly significant (P = 0.00013, HR = 2.20, 95% CI: 1.47–3.29, more than 53 mutated tumours out of 888 total), with mutations associating with detrimental outcome in four tumour types and notable associations in KIRC (P = 0.00079), consistent with a recent report28, and in UCEC (P = 0.066). Mutations in several other genes are detrimental, including DNMT3A (HR = 1.59), previously identified with poor prognosis in AML34, and KDM5C (HR = 1.63), FBXW7 (HR = 1.57) and TP53 (HR = 1.19). TP53 has significant associations with poor outcome in KIRC (P = 0.012), AML (P = 0.0007) and HNSC (P = 0.00007). Conversely, BRCA2 (P = 0.05, HR = 0.62, 95% CI: 0.38 to 0.99) correlates with survival benefit in six types, including OV and UCEC (Supplementary Table 10a, b). IDH1 mutations are associated with improved prognosis across the Pan-Cancer set (HR = 0.67, P = 0.16) and also in GBM (HR = 0.42, P = 0.09) (Supplementary Table 10a, b), consistent with previous work35.
Extended Data Table 1.
Clinical correlation and survival analysis for genes mutated at ≥2% frequency in at least 2 tumour types
Driver mutations and tumour clonal architecture
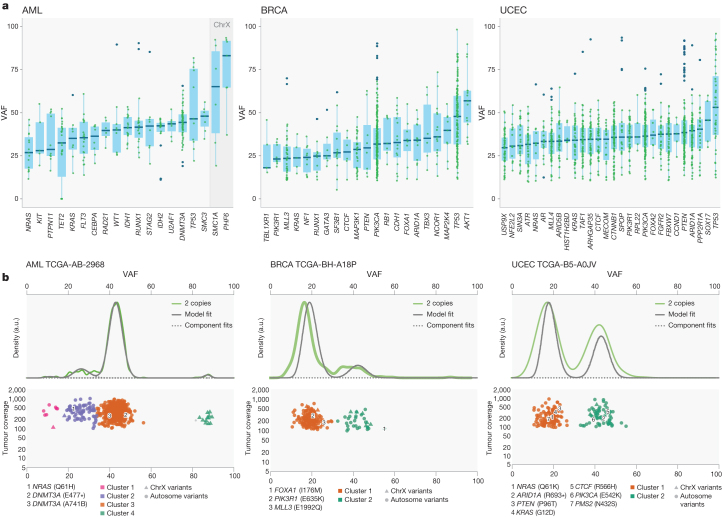
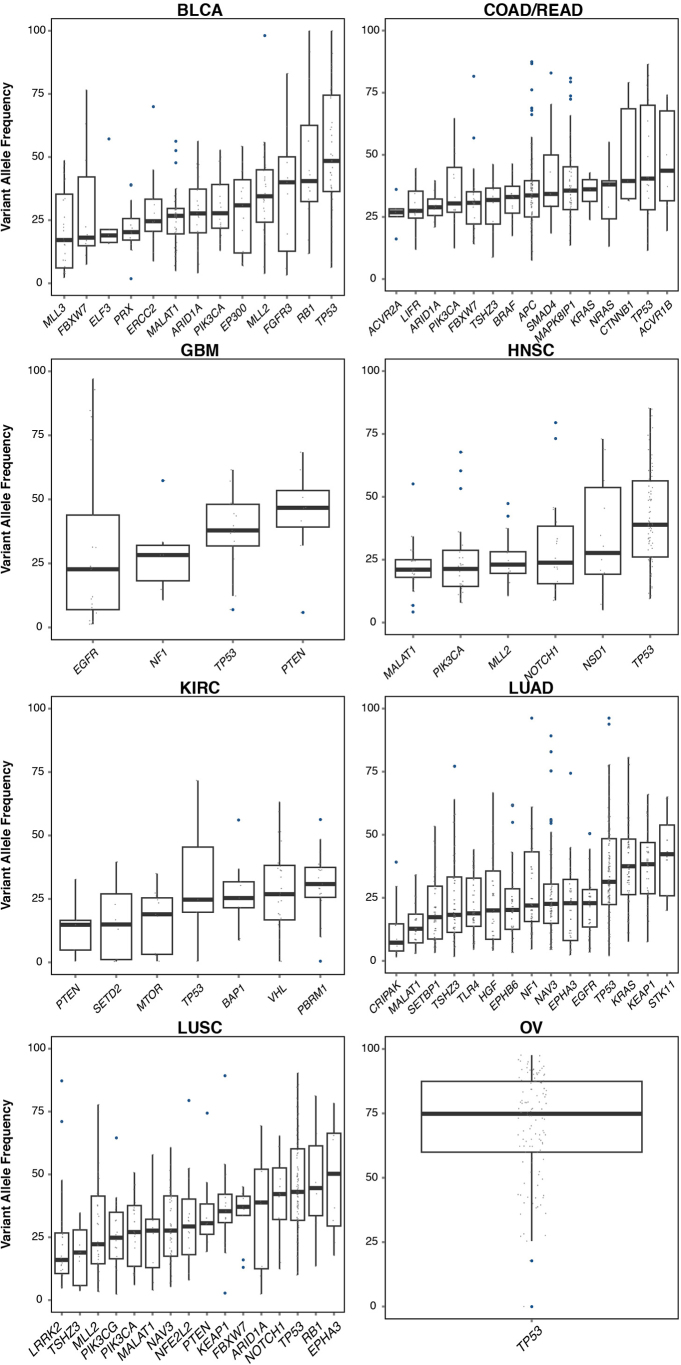
To understand the temporal order of somatic events, we analysed the variant allele fraction (VAF) distribution of mutations in SMGs across AML, BRCA and UCEC (Fig. 5a and Supplementary Table 11a) and other tumour types (Extended Data Fig. 7). To minimize the effect of copy number alterations, we focused on mutations in copy neutral segments. Mutations in TP53 have higher VAFs on average in all three cancer types, suggesting early appearance during tumorigenesis, although it is possible that a later mutation contributing to tumour cell expansion might have a high VAF. It is worth noting that copy neutral loss of heterozygosity is commonly found in classical tumour suppressors such as TP53, BRCA1, BRCA2 and PTEN, leading to increased VAFs in these genes. In AML, DNMT3A (permutation test P = 0), RUNX1 (P = 0.0003) and SMC3 (P = 0.05) have significantly higher VAFs than average among SMGs (Fig. 5a and Supplementary Table 11b). In breast cancer, AKT1, CBFB, MAP2K4, ARID1A, FOXA1 and PIK3CA have relatively high average VAFs. For endometrial cancer, multiple SMGs (for example, PIK3CA, PIK3R1, PTEN, FOXA2 and ARID1A) have similar median VAFs. Conversely, KRAS and/or NRAS mutations tend to have lower VAFs in all three tumour types (Fig. 5a), suggesting NRAS (for example, P = 0 in AML) and KRAS (for example, P = 0.02 in BRCA) have a progression role in a subset of AML, BRCA and UCEC tumours. For all three cancer types, we clearly observed a shift towards higher expression VAFs in SMGs versus non-SMGs, most apparent in BRCA and UCEC (Extended Data Fig. 8a and Methods).
Figure 5. Driver initiation and progression mutations and tumour clonal architecture.
a, Variant allele fraction (VAF) distribution of mutations in SMGs across tumours from AML, BRCA and UCEC for mutations (≥20× coverage) in copy neutral segments. SMGs having ≥5 mutation data points were included. ChrX, chromosome X. b, In AML sample TCGA-AB-2968 (WGS), two DNMT3A mutations are in the founding clone, and one NRAS mutation is in the subclone. In BRCA tumour TCGA-BH-A18P (exome), one FOXA1 mutation is in the founding clone, and PIK3R1 and MLL3 mutations are in the subclone. In UCEC tumour TCGA-B5-A0JV (exome), PIK3CA, ARID1A and CTCF mutations are in the founding clone, and NRAS, PTEN and KRAS mutations are in the secondary clone. Asterisk denotes stop codon.
Extended Data Figure 7. VAF distribution of mutations in SMGs across tumours from BLCA, KIRC, HNSC, LUAD, LUSC, COAD/READ, OV and GBM.
To minimize the effect of copy number alterations on VAFs, only mutations residing in copy number neutral segments were used for this analysis. Only mutation sites with ≥20× coverage were used for analysis and plotting. SMGs with at least five data points were included in the plot.
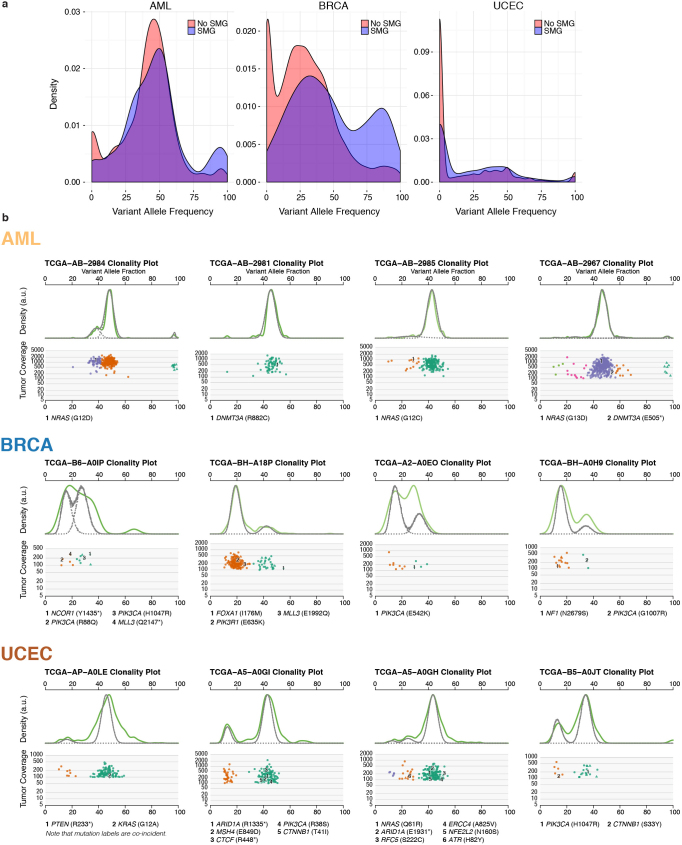
Extended Data Figure 8. Mutation expression and tumour clonal architecture in AML, BRCA and UCEC.
a, Density plots of expressed VAFs for mutations in SMGs (blue) and non-SMGs (red). b, SciClone clonality example plots for AML (validation data), BRCA and UCEC. Two plots are shown for each case: kernel density (top), followed by the plot of tumour VAF by sequence depth for sites from selected copy number neutral regions. Mutations (with annotations) in SMGs were shown.
Previous analysis using whole-genome sequencing (WGS) detected subclones in approximately 50% of AML cases15,36,37; however, analysis is difficult using AML exome owing to its relatively few coding mutations. Using 50 AML WGS cases, sciClone (http://github.com/genome/sciclone) detected DNMT3A mutations in the founding clone for 100% (8 out of 8) of cases and NRAS mutations in the subclone for 75% (3 out of 4) of cases (Extended Data Fig. 8b). Among 304 and 160 of BRCA and UCEC tumours, respectively, with enough coding mutations for clustering, 35% BRCA and 44% UCEC tumours contained subclones. Our analysis provides the lower bound for tumour heterogeneity, because only coding mutations were used for clustering. In BRCA, 95% (62 out of 65) of cases contained PIK3CA mutations in the founding clone, whereas 33% (3 out of 9) of cases had MLL3 mutations in the subclone. Similar patterns were found in UCEC tumours, with 96% (65 out of 68) and 95% (62 out of 65) of tumours containing PIK3CA and PTEN mutations, respectively, in the founding clone, and 9% (2 out of 22) of KRAS and 14% (1 out of 7) of NRAS mutations in the subclone (Extended Data Fig. 8b and Supplementary Table 12).
Discussion
We have performed systematic analysis of the TCGA Pan-Cancer mutation data set, finding key insights for cancer genomes, as summarized in Extended Data Fig. 9. The data set contains 127 diverse SMGs, demonstrating that many cellular and enzymatic processes are involved in tumorigenesis. Notably, 66 of them are also on the ‘mut-driver genes’ list generated by a ratiometric method using COSMIC mutations38. Although a common set of driver mutations exists in each cancer type, the combination of drivers within a cancer type and their distribution within the founding clone and subclones varies for individual patients. This suggests that knowing the clonal architecture of each patient’s tumour will be crucial for optimizing their treatment.
Extended Data Figure 9. Summary of major findings in Pan-Cancer 12.
Systematic analysis of the TCGA Pan-Cancer mutation dataset identifies SMGs, cancer-related cellular processes, and genes associated with clinical features and tumour progression.
Given the rate at which TCGA and International Cancer Genome Consortium projects are generating genomic data, there are reasonable chances of identifying the ‘core’ cancer genes and pathways and tumour-type-specific genes and pathways in the near term. These results will be immediately circulated within the research community to assess their potential for candidate targets for diverse tumour types or for specific tumour type. Ultimately, these data and their associations with different clinical features and subtypes should contribute to the formulation of a reference candidate gene panel for all tumour types that could be helpful for prognosis at various clinical time points.
Methods Summary
Mutation data were standardized for 12 cancer types and tracked on Synapse with documentation (10.7303/syn1729383.2). All mutation annotation format files were downloaded from the TCGA data coordinating centre, each being reprocessed to eliminate known, recurrent false positives and germline single nucleotide polymorphisms (SNP) present in the dbSNP database. All variant coordinates were converted to GRCh37 and re-annotated using the Gencode human transcript annotation imported from Ensembl release 69. Mutation context (−2 to +2 bp) was calculated for each somatic variant in each mutation category, and hierarchical clustering was then performed using the pairwise mutation context correlation across all cancer types. The mutational significance in cancer (MuSiC)3 package was used to identify significant genes for both individual tumour types and the Pan-Cancer collective. An R function ‘hclust’ was used for complete-linkage hierarchical clustering across mutations and samples, and Dendrix30 was used to identify sets of approximately mutual exclusive mutations. Cross-cancer survival analysis was based on the Cox proportional hazards model, as implemented in the R package ‘survival’ (http://cran.r-project.org/web/packages/survival/), and the sciClone algorithm (http://github.com/genome/sciclone) generated mutation clusters using point mutations from copy number neutral segments. A complete description of the materials and methods used to generate this data set and its results is provided in the Methods.
Online Methods
Standardization and tracking of mutation data from 12 cancer types
The three TCGA genome sequencing centres (GSCs; Baylor Human Genome Center, Broad Institute, and The Genome Institute at Washington University) collectively performed exome sequencing on thousands of tumour samples and matched normal tissues, the latter being used as controls to distinguish somatic mutations from inherited variants. These controls were most often peripheral blood, but skin tissue was used in 199 AML samples as well as 1 buccal source, and adjacent tumour-free tissue was used for 927 cases, with 120 cases having normal DNA from blood and adjacent solid normal tissue.
Exome capture targets may differ among GSCs, as well as across cohorts at the same GSC because the capture technologies and sequencing platforms continue to evolve over time. Therefore, collecting sequencing coverage data for each sample is crucial for most variant significance analyses. Somatic variant calling methods also differ among GSCs for similar reasons, in addition to the fact that filtering strategies may be tuned to emphasize either sensitivity or specificity of calls. Finally, the TCGA disease analysis working groups (AWGs) may optionally perform manual curation of the variant calls, in which false positives are removed and true negatives are recovered. AWGs and GSCs also collaboratively select putative variants for validation or for recovering variants from regions that reported low coverage in the first pass of exome sequencing. These steps mean that somatic variant sensitivity and specificity are mostly comparable across samples of a given TCGA tumour type, but that they differ considerably among tumour types, creating significant challenges for Pan-Cancer analyses.
Complete standardization of sensitivity could not be attained, as it would have required a uniform variant calling and filtering workflow across all tumour–normal pairs. Instead, publicly available somatic variant calls in mutation annotation format (MAF) files from the TCGA were used to both ensure reproducibility and take advantage of extensive manual curation performed over the years by experts in the disease or in genomic sequence analysis and annotation. Specifically, all MAF files were downloaded from the TCGA data coordinating centre, each being reprocessed to eliminate known, recurrent false positives and germline single nucleotide polymorphisms (SNP) present in the dbSNP database. All variant coordinates were transferred to GRCh37 and re-annotated using the Gencode human transcript annotation imported from Ensembl release 69. Per sample, per gene coverage values were obtained using WIG-formatted reference coverage files associated with the BAMs or by processing the original BAM files directly. Details were tracked on Synapse with provenance and documentation (https://www.synapse.org/#!Synapse:syn1729383).
Mutation frequency and spectrum analysis
We calculate mutation frequency by dividing the number of validated somatic variants by the number of base pairs that have sufficient coverage. Minimum coverage is six and eight reads for normal and tumour BAMs, respectively. For mutation spectrum we classify the mutation by six types (transitions/transversions). Mutation context is generated by counting the frequency of A, T, C and G nucleotides that are 2 bp 5′ and 3′ to each variant within the six mutation categories. For the clustering, we pooled all samples (excluding hypermutators having >500 mutations) for each cancer type. We calculated the mutation context (−2 to +2 bp) for each somatic variant in each mutation category. A hierarchical clustering was then done using the pairwise correlation of the mutation context across all cancer types. We used correlation modules in the mutational significance in cancer (MuSiC) package to identify genes with mutations that are positively correlated with the number of mutations in the tumour sample. This analysis was performed for all 12 cancer types. Only genes mutated in at least 5% of tumours were included in the analysis. A list of genes known to be involved in DNA mismatch repair is included Supplementary Table 13.
SMG analysis
We used the SMG test in the MuSiC suite3 to identify significant genes for each tumour type and also for Pan-Cancer tumours. This test assigns mutations to seven categories: AT transition, AT transversion, CG transition, CG transversion, CpG transition, CpG transversion and indel, and then uses statistical methods based on convolution, the hypergeometric distribution (Fisher’s test), and likelihood to combine the category-specific binomials to obtain overall P values. All P values were combined using the methods described previously3. SMGs are listed in Fig. 2. Finally, for the analysis of SMGs, genes not typically expressed in individual tumour type or/and Pan-Cancer tumour samples were filtered if they had an average read per kilobase per million (RPKM) ≤ 0.5. For the RNA sequencing (RNA-seq)-based gene expression analysis, we used the ‘Pancan12 per-sample log2-RSEM’ matrix from Synapse (https://www.synapse.org/#!Synapse:syn1734155). A gene qualified as ‘expressed’ if it had at least three reads in at least 70% of samples. Annotation based curation was also performed.
Tumour specificity analysis
To make quantitative inferences as to the number of cancer types with which an individual gene associates, we calculated the empirical distributions of frequency for each cancer (tissue) type and declared an association (setting indicator variable to 1) if a given gene frequency within a type exceeded a threshold. Otherwise we set the indicator to 0, indicating no association. We took the threshold as a standardized Z-score of 0.2 above the mean based on the estimated level of noise in the 127 significant genes as quantified by the coefficient of variation for each cancer type. We then computed an overall distribution on the indicator variable. The mean for each functional category having at least five genes was then converted to a Z-score based on the descriptive statistics (mean and standard deviation) of the indicator distribution.
Unsupervised clustering
Somatic point mutations and small indels of 127 SMGs across the 3,281 tumours were collected. To reduce noise from passenger mutations, tumours having more than 500 somatic mutations (considered hypermutators) were excluded from this analysis. Tumours with zero detected somatic mutations were also excluded, resulting in mutations from 2,611 tumours for downstream clustering analysis. A mutation status matrix (sample × gene) was constructed and passed to the R function ‘hclust’ for complete-linkage hierarchical clustering and a respective heatmap with a dendrogram was plotted. Tumours from BLCA, HNSC, LUAD and LUSC are largely scattered over the Pan-Cancer cohort, indicating extensive heterogeneity in these diseases. For instance, eight LUAD and two LUSC tumours are in the solid colorectal cluster, largely owing to their KRAS mutations (Fig. 4). Three UCEC, two GBM, one OV and one HSNC samples are in the BRCA cluster courtesy of TP53 and PIK3CA mutations. The resolution of this analysis could be improved by incorporating copy number data, structural variants, gene expression, proteomics and methylation.
Dendrix analysis of mutation relationships
We used Fisher’s exact test to identify pairs of SMGs with significant (FDR = 0.05 by Benjamini–Hochberg) exclusivity and co-occurrence. We identified significant pairs by analysing all samples together and by analysing samples in each cancer type separately. A large number of pairs (142) with significant co-occurring mutations is identified only considering the Pan-Cancer data set (Extended Data Fig. 4); these pairs include several candidate genes (for example, NAV3, RPL22 and TSHZ3) whose function in carcinogenesis is not well characterized.
We applied our de novo driver exclusivity (Dendrix) algorithm to identify sets of approximately mutually exclusive mutations on all samples together. Dendrix finds a set M of genes of maximum weight W(M), in which W(M) is the difference between the number of samples with a mutation in M and the number of samples with more than one mutation in M. The maximum scoring set of genes of a given size is identified using a Markov chain Monte Carlo approach. We first applied Dendrix considering only the 127 SMGs, and then extended our analysis to consider the 1,000 genes of smallest median q value among the three q values (convolution, Fisher’s combined test, and likelihood ratio) reported by MuSiC. From these 1,000 genes, we discarded the ones with mutations strongly associated (Bonferroni corrected P ≤ 0.05 by Fisher’s exact test) with a cancer type, and this resulted in 600 genes for Dendrix analysis.
We also applied Dendrix to identify sets of exclusive mutations among the SMGs in each cancer type separately. The exclusivity and co-occurrence between different sets of mutations was assessed using Fisher’s exact test, and the mutation status (‘mutated’ if at least one gene in the set is mutated, ‘not mutated’ otherwise) of the two sets as categories for the 2 × 2 contingency table.
Cross-cancer-type survival analysis using Cox proportional hazards model
We used the clinical correlation module of MuSiC to examine how clinical features correlate with somatic events within individual tumour types. Fisher’s exact test was used for analysing categorical features, and the Wilcoxon rank sum test was used for quantitative variables. We used the standard Cox proportional hazards model for individual cancer types as well as cross-cancer survival analysis, as implemented in the R package ‘survival’ (http://cran.r-project.org/web/packages/survival/). Here, the effects of all mutations are taken to be constant over time, that is, they are ‘stationary coefficients’. Hazard ratios exceeding 1 indicate an overall detrimental effect across cancers, whereas those below 1 associate with better outcome. Calculations included only those genes having mutation frequencies of at least 2% (for both individual cancer types and Pan-Cancer) in at least two cancer types (for Pan-Cancer). In practice, this means that although some genes encompass many types, for example, TP53 is calculated over 12 types, most are based on only a few (Extended Data Table 1 and Supplementary Table 10a, b). There is no basis for calculation of genes having 2% mutation in only a single type, although single-type analysis was computed similarly for all genes having at least 2% in all cancer types. Analyses were performed using age and gender as covariates.
We also performed Pan-Cancer survival analysis by stratifying on cancer type in the Cox regression model and found the results are largely consistent with taking cancer type as a covariate (14 out of top 15 significant genes are overlapping from these two analyses) (Supplementary Table 10b). Furthermore, stage was used as a covariate for individual cancer type survival analysis (AML and COAD/READ not included). Again, the results are fairly consistent with taking only age and gender as covariates (for example, 12 out of top 15 significant genes are overlapping from these two analyses for UCEC) (Supplementary Table 14).
Clonality and mutation VAF analysis
We computed the VAFs of somatic mutations in SMGs using TCGA targeted validation data or/and exome and RNA sequencing data for AML, BRCA and UCEC. An internally developed tool called Bam2ReadCount (unpublished), which counts the number of reads supporting the reference and variant alleles, was used for computing VAFs for point mutations and short indels in copy number neutral segments. Only mutation sites having ≥20× coverage and SMGs having at least five data points were included in downstream analyses. Permutation and t-tests were used to identify genes with significantly higher or lower VAFs than the average (Supplementary Table 11a, b). These indicate chronological order-of-appearance of somatic events during tumorigenesis. VAFs for mutations from genes that are not identified as significantly mutated were similarly computed for generating control VAF density distribution. We also computed VAF distribution for the other nine cancer types, and plots are included in Extended Data Fig. 7. In total, 91 BLCA, 772 BRCA, 144 COAD/READ, 62 GBM, 144 HNSC, 195 KIRC, 197 LAML, 216 LUAD, 146 LUSC, 278 OV and 248 UCEC tumours were used for SMG VAF distribution analysis.
We further investigated the expression level of somatic mutations using available RNA sequencing data for AML, BRCA and UCEC, and then compared observed mutant allele expressions with expected levels based on DNA VAFs (assuming no allelic expression bias). A total of 671 BRCA, 170 AML and 190 UCEC tumours with RNA-seq BAMs were used for this analysis. Notably, we observed at least a twofold increase of variant allele expressions in 3.9%, 12.9% and 5.9% of mutations from SMGs in AML (for example, TP53, STAG2 and SMC3), BRCA (for example, CDH1, TP53, GATA3 and MLL3), and UCEC (for example, ARID1A and FGFR2), respectively (Supplementary Table 11a). We further compared expression level distributions across mutations from SMGs and non-SMGs. For all three cancer types, we clearly observed a shift towards higher expression VAFs in SMGs versus non-SMGs, which was most apparent in BRCA and UCEC (Extended Data Fig. 8a). This result suggests potential selection of these mutations during tumorigenesis.
SciClone (http://github.com/genome/sciclone) was used for generating mutation clusters using point mutations from copy number neutral segments. Only variants with greater than or equal to 100× coverage were used for clustering and plotting. Validation data were used for AML, and exome sequencing data were used for BRCA and UCEC. SMGs were highlighted automatically by sciClone to show their clonal association (Extended Data Fig. 8b).
Supplementary information
This zipped file contains Supplementary Tables 1 and 3-14. (ZIP 22792 kb)
This zipped file contains Supplementary Table 2. (ZIP 32847 kb)
Acknowledgements
This work was supported by the National Cancer Institute grants R01CA180006 to L.D. and PO1CA101937 to T.J.L., and National Human Genome Research Institute grants R01HG005690 to B.J.R., U54HG003079 to R.K.W., and U01HG006517 to L.D., and National Science Foundation grant IIS-1016648 to B.J.R. We gratefully acknowledge the contributions from TCGA Research Network and its TCGA Pan-Cancer Analysis Working Group. We also thank M. Bharadwaj for technical assistance.
Extended data figures and tables
PowerPoint slides
Author Contributions
L.D. and R.K.W. supervised the research. L.D., C.K., M.D.M., F.V., K.Y., B.N., C.L., M.X., M.D.M.L., M.A.W., J.F.M., M.J.W., C.A.M., J.S.W. and B.J.R. analysed the data. M.C.W. and Q.Z. performed statistical analysis. M.D.M., C.K., F.V., C.L., M.X., K.Y., B.N., Q.Z., M.C.W., J.F.M., M.D.M., M.A.W. and L.D. prepared the figures and tables. L.D., T.J.L., C.K. and B.J.R conceived and designed the experiments. L.D., M.D.M., C.K., F.V., C.L., B.J.R., K.Y. and M.C.W. wrote the manuscript.
Competing interests
The authors declare no competing financial interests.
Footnotes
Cyriac Kandoth and Michael D. McLellan: These authors contributed equally to this work.
References
- 1.Larson DE, et al. SomaticSniper: identification of somatic point mutations in whole genome sequencing data. Bioinformatics. 2012;28:311–317. doi: 10.1093/bioinformatics/btr665. [DOI] [PMC free article] [PubMed] [Google Scholar]
- 2.Koboldt DC, et al. VarScan 2: somatic mutation and copy number alteration discovery in cancer by exome sequencing. Genome Res. 2012;22:568–576. doi: 10.1101/gr.129684.111. [DOI] [PMC free article] [PubMed] [Google Scholar]
- 3.Dees ND, et al. MuSiC: Identifying mutational significance in cancer genomes. Genome Res. 2012;22:1589–1598. doi: 10.1101/gr.134635.111. [DOI] [PMC free article] [PubMed] [Google Scholar]
- 4.Roth A, et al. JointSNVMix: a probabilistic model for accurate detection of somatic mutations in normal/tumour paired next-generation sequencing data. Bioinformatics. 2012;28:907–913. doi: 10.1093/bioinformatics/bts053. [DOI] [PMC free article] [PubMed] [Google Scholar]
- 5.Cibulskis K, et al. Sensitive detection of somatic point mutations in impure and heterogeneous cancer samples. Nature Biotechnol. 2013;31:213–219. doi: 10.1038/nbt.2514. [DOI] [PMC free article] [PubMed] [Google Scholar]
- 6.Jones S, et al. Core signaling pathways in human pancreatic cancers revealed by global genomic analyses. Science. 2008;321:1801–1806. doi: 10.1126/science.1164368. [DOI] [PMC free article] [PubMed] [Google Scholar]
- 7.Parsons DW, et al. An integrated genomic analysis of human glioblastoma multiforme. Science. 2008;321:1807–1812. doi: 10.1126/science.1164382. [DOI] [PMC free article] [PubMed] [Google Scholar]
- 8.Sjöblom T, et al. The consensus coding sequences of human breast and colorectal cancers. Science. 2006;314:268–274. doi: 10.1126/science.1133427. [DOI] [PubMed] [Google Scholar]
- 9.The Cancer Genome Atlas Research Network. Comprehensive genomic characterization defines human glioblastoma genes and core pathways. Nature455, 1061–1068 (2008) [DOI] [PMC free article] [PubMed]
- 10.Ding L, et al. Somatic mutations affect key pathways in lung adenocarcinoma. Nature. 2008;455:1069–1075. doi: 10.1038/nature07423. [DOI] [PMC free article] [PubMed] [Google Scholar]
- 11.Wood LD, et al. The genomic landscapes of human breast and colorectal cancers. Science. 2007;318:1108–1113. doi: 10.1126/science.1145720. [DOI] [PubMed] [Google Scholar]
- 12.The Cancer Genome Atlas Research Network. Integrated genomic analyses of ovarian carcinoma. Nature474, 609–615 (2011) [DOI] [PMC free article] [PubMed]
- 13.The Cancer Genome Atlas Network. Comprehensive molecular portraits of human breast tumours. Nature490, 61–70 (2012) [DOI] [PMC free article] [PubMed]
- 14.Levine Douglas A. Integrated genomic characterization of endometrial carcinoma. Nature. 2013;497(7447):67–73. doi: 10.1038/nature12113. [DOI] [PMC free article] [PubMed] [Google Scholar]
- 15.The Cancer Genome Atlas Research Network. Genomic and epigenomic landscapes of adult de novo acute myeloid leukemia. N. Engl. J. Med.368, 2059–2074 (2013) [DOI] [PMC free article] [PubMed]
- 16.The Cancer Genome Atlas Network. Comprehensive molecular characterization of human colon and rectal cancer. Nature487, 330–337 (2012) [DOI] [PMC free article] [PubMed]
- 17.Ellis MJ, et al. Whole-genome analysis informs breast cancer response to aromatase inhibition. Nature. 2012;486:353–360. doi: 10.1038/nature11143. [DOI] [PMC free article] [PubMed] [Google Scholar]
- 18.The Cancer Genome Atlas Research Network. Comprehensive molecular characterization of clear cell renal cell carcinoma. Nature499, 43–49 (2013) [DOI] [PMC free article] [PubMed]
- 19.Hanahan D, Weinberg RA. The hallmarks of cancer. Cell. 2000;100:57–70. doi: 10.1016/S0092-8674(00)81683-9. [DOI] [PubMed] [Google Scholar]
- 20.Downing JR, et al. The Pediatric Cancer Genome Project. Nature Genet. 2012;44:619–622. doi: 10.1038/ng.2287. [DOI] [PMC free article] [PubMed] [Google Scholar]
- 21.Ma Z, Leijon A. Bayesian estimation of beta mixture models with variational inference. IEEE Trans. Pattern Anal. Mach. Intell. 2011;33:2160–2173. doi: 10.1109/TPAMI.2011.63. [DOI] [PubMed] [Google Scholar]
- 22.Lawrence MS, et al. Mutational heterogeneity in cancer and the search for new cancer-associated genes. Nature. 2013;499:214–218. doi: 10.1038/nature12213. [DOI] [PMC free article] [PubMed] [Google Scholar]
- 23.Tao MH, Freudenheim JL. DNA methylation in endometrial cancer. Epigenetics. 2010;5:491–498. doi: 10.4161/epi.5.6.12431. [DOI] [PMC free article] [PubMed] [Google Scholar]
- 24.Etcheverry A, et al. DNA methylation in glioblastoma: impact on gene expression and clinical outcome. BMC Genomics. 2010;11:701. doi: 10.1186/1471-2164-11-701. [DOI] [PMC free article] [PubMed] [Google Scholar]
- 25.Varela I, et al. Exome sequencing identifies frequent mutation of the SWI/SNF complex gene PBRM1 in renal carcinoma. Nature. 2011;469:539–542. doi: 10.1038/nature09639. [DOI] [PMC free article] [PubMed] [Google Scholar]
- 26.Peña-Llopis S, et al. BAP1 loss defines a new class of renal cell carcinoma. Nature Genet. 2012;44:751–759. doi: 10.1038/ng.2323. [DOI] [PMC free article] [PubMed] [Google Scholar]
- 27.Clapier CR, Cairns BR. The biology of chromatin remodeling complexes. Annu. Rev. Biochem. 2009;78:273–304. doi: 10.1146/annurev.biochem.77.062706.153223. [DOI] [PubMed] [Google Scholar]
- 28.Kapur P, et al. Effects on survival of BAP1 and PBRM1 mutations in sporadic clear-cell renal-cell carcinoma: a retrospective analysis with independent validation. Lancet Oncol. 2013;14:159–167. doi: 10.1016/S1470-2045(12)70584-3. [DOI] [PMC free article] [PubMed] [Google Scholar]
- 29.Jiao Y, et al. Frequent ATRX, CIC, FUBP1 and IDH1 mutations refine the classification of malignant gliomas. Oncotarget. 2012;3:709–722. doi: 10.18632/oncotarget.588. [DOI] [PMC free article] [PubMed] [Google Scholar]
- 30.Vandin F, Upfal E, Raphael BJ. De novo discovery of mutated driver pathways in cancer. Genome Res. 2012;22:375–385. doi: 10.1101/gr.120477.111. [DOI] [PMC free article] [PubMed] [Google Scholar]
- 31.Piazza R, et al. Recurrent SETBP1 mutations in atypical chronic myeloid leukemia. Nature Genet. 2013;45:18–24. doi: 10.1038/ng.2495. [DOI] [PMC free article] [PubMed] [Google Scholar]
- 32.Yang D, et al. Association of BRCA1 and BRCA2 mutations with survival, chemotherapy sensitivity, and gene mutator phenotype in patients with ovarian cancer. J. Am. Med. Assoc. 2011;306:1557–1565. doi: 10.1001/jama.2011.1456. [DOI] [PMC free article] [PubMed] [Google Scholar]
- 33.Bolton KL, et al. Association between BRCA1 and BRCA2 mutations and survival in women with invasive epithelial ovarian cancer. J. Am. Med. Assoc. 2012;307:382–390. doi: 10.1001/jama.2012.20. [DOI] [PMC free article] [PubMed] [Google Scholar]
- 34.Ley TJ, et al. DNMT3A mutations in acute myeloid leukemia. N. Engl. J. Med. 2010;363:2424–2433. doi: 10.1056/NEJMoa1005143. [DOI] [PMC free article] [PubMed] [Google Scholar]
- 35.Myung JK, et al. IDH1 mutation of gliomas with long-term survival analysis. Oncol. Rep. 2012;28:1639–1644. doi: 10.3892/or.2012.1994. [DOI] [PubMed] [Google Scholar]
- 36.Ding L, et al. Clonal evolution in relapsed acute myeloid leukaemia revealed by whole-genome sequencing. Nature. 2012;481:506–510. doi: 10.1038/nature10738. [DOI] [PMC free article] [PubMed] [Google Scholar]
- 37.Welch JS, et al. The origin and evolution of mutations in acute myeloid leukemia. Cell. 2012;150:264–278. doi: 10.1016/j.cell.2012.06.023. [DOI] [PMC free article] [PubMed] [Google Scholar]
- 38.Vogelstein B, et al. Cancer genome landscapes. Science. 2013;339:1546–1558. doi: 10.1126/science.1235122. [DOI] [PMC free article] [PubMed] [Google Scholar]
Associated Data
This section collects any data citations, data availability statements, or supplementary materials included in this article.
Supplementary Materials
This zipped file contains Supplementary Tables 1 and 3-14. (ZIP 22792 kb)
This zipped file contains Supplementary Table 2. (ZIP 32847 kb)


