

SUMMARY
Removal of introns from nascent transcripts (pre-mRNAs) by the spliceosome is an essential step in eukaryotic gene expression. Previous studies have suggested that the earliest steps in spliceosome assembly in yeast are highly ordered, with stable recruitment of U1 snRNP to the 5' splice site necessarilypreceding recruitment of U2 snRNP to the branch site to form the “pre-spliceosome”. Using Colocalization Single Molecule Spectroscopy (CoSMoS) to follow initial spliceosome assembly on eight different S. cerevisiae pre-mRNAs, we here demonstrate that active yeast spliceosomes can form by both U1-first and U2-first pathways. Both assembly pathways yield prespliceosomes functionally equivalent for subsequent U5•U4/U6 tri-snRNP recruitment and for intron excision. Although fractional flux through the two pathways varies on different introns, both are operational on all introns studied. Thus, multiple pathways exist toassemble functional spliceosomes. These observations provide new insight into the mechanisms of cross-intron coordination of initial spliceosome assembly.
INTRODUCTION
Excision of introns from precursors to messenger RNAs (pre-mRNA splicing) is carried out by the spliceosome, a multimegadalton machine composed of five small nuclear ribonucleoprotein particles (U1, U2, U4, U5 and U6 snRNPs), the protein-only Prp19 complex (NTC) and numerous transiently interacting splicing factors. For each round of intron excision, these pieces must assemble into an active spliceosome. Ensemble studies following the appearance and disappearance of stable complexes in vitro(Ruby and Abelson, 1988; Seraphin and Rosbash, 1989) and the accumulation of chromatin IP (ChIP) signaturesfor snRNPsin vivo(Gornemann et al., 2005; Moore et al., 2006; Tardiff et al., 2006) have led to a widely accepted model for earlyspliceosome assembly across yeast introns wherein 5' splice site (SS) recognition by U1 precedes branch site (BS) recognition by U2 (reviewed in(Hoskins and Moore, 2012; Matlin and Moore, 2007; Staley and Woolford, 2009; Wahl et al., 2009)). After establishment of a U1•U2 prespliceosome (A complex), U5•U4/U6 tri-snRNP addition(to form B complex) is quickly followed by NTC acquisition and subsequent structural rearrangementsculminating in a catalytically active spliceosome (C complex) (Figure 1A). Using Colocalization Single Molecule Spectroscopy (CoSMoS) (Friedman et al., 2006) to directly observethe real-time dynamics of subcomplex associations with surface-tethered pre-mRNA molecules in S.cerevisiae whole cell extract (WCE) (Crawford et al., 2008), we recently confirmed that spliceosome assembly on RP51A pre-mRNA, an optimized splicing substrate containing a shortened intron (Pikielny et al., 1986), occurs predominantly by this ordered U1→U2→U5•U4/U6→NTC pathway (Hoskins et al., 2011).
Figure 1.

Splicing of S. cerevisiae pre-mRNAs studied in ensemble experimentsin vitro. (A) Spliceosome assembly and splicing pathway for RP51A pre-mRNA (Hoskins et al., 2011). Rectangles, exons; line, intron.(B)Cartoon showing the first and second chemical steps of splicing. (C) Products of the first and second step reactions of radioactively-labeled RP51A pre-mRNAincubated with WCE in the presence of ATPfor 0 – 60 min and visualized by denaturing PAGE. (D)Fraction of molecules that completed the first and second steps of splicing for eight different pre-mRNAs as a function of incubation time. (E) Compiled first (darker bars) and second step (lighter bars) rates (±S.E.) for the specified pre-mRNAs.
Is this single highly ordered assembly pathway the same for all yeast introns? To address this, we here selected for CoSMoS seven additional single-intron pre-mRNAs fromS.cerevisiae. In ensemble splicing assays, these pre-mRNAs displayed a wide range of splicing rates and efficiencies. We then examined the rates and binding order for all major subcomplexes via CoSMoS. This revealed an alternate spliceosome assembly pathway wherein U2 is recruited before U1. Both the U1-first and U2-first pathways were usedon all pre-mRNAs studied, including RP51A, but the fractionalfluxesthrough these pathways varied widely for different pre-mRNAs.Additional experiments revealed that U1•U2•pre-mRNA pre-spliceosomal complexes formed by either the U1-first or U2-first pathway are functionally equivalent for both tri-snRNP recruitment and intron excision. Taken together, our results show that there is no requisite binding order for U1 and U2 during the initial stage of spliceosome assembly.Both thehigh reversibility ofU1 binding and the existence of multiple alternativeassembly pathways have implications for our understanding of the cross-intron coordination of initial spliceosome assembly in vivo and of regulated splice site pairing that closely followspre-spliceosome formation in higher eukaryotes (Kotlajich et al., 2009).
RESULTS
Ensemble splicing rates and efficiencies differ for different pre-mRNAs
Very few S.cerevisiae pre-mRNAs have previously been analyzed in in vitro splicing reactions.To remedy this, we selected eight single-intron pre-mRNAs with diverse features (Table 1). Included were bothRP51A, the optimized splicing substrate (Pikielny et al., 1986) we used in our previous CoSMoS study (Hoskins et al., 2011),and the full-length intron from its parent gene (RPS17A). ACT1 and UBC4 are two other well-studied introns(Abelson et al., 2010; Ruby and Abelson, 1988). The introns of TEF4 and IMD4 contain snoRNAs, so are likely highly structured(Villa et al., 2000). RPS30A and RPS30B, which both encode the same ribosomal protein, displayed differential sensitivities to mutations in core spliceosome components in vivo(Pleiss et al., 2007); this suggested that splicing of these two introns might be governed by different rate-limiting steps.
Table 1.
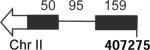
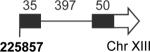
Pre-mRNAs examined in this study. Schematics indicate exons (blocks), introns (lines) and their lengths in nucleotides (numbers above). Except for RP51A, each pre-mRNA began at the 5' end of the endogenous transcript(chromosomal position indicated below) (Xu et al., 2009). Right and left arrows indicate Watson and Crick transcripts. Underlined letters in the 5' splice site (SS) sequence column indicate deviations from the canonical sequences.
| Name | Features | Schematic | 5'SS | BS | 3'SS |
|---|---|---|---|---|---|
| RP51A | Model pre-mRNA with shortened intron |
|
GUAUGU | UACUAAC | UAG |
| RPS30A | Differentially affected by mutations in core spliceosome components |
|
GUACGU | UACUAAC | UAG |
| RPS30B |
|
GUACGU | UACUAAC | UAG | |
| ACT1 | Full length parent of well-studied model pre-mRNA |
|
GUAUGU | UACUAAC | UAG |
| UBC4 | Model pre-mRNA with a short intron |
|
GUAUGU | UACUAAC | UAG |
| TEF4 | snoRNA (snR38) in intron |
|
GUAUGU | UACUAAC | UAG |
| IMD4 | snoRNA (snR45) in intron |
|
GUAUGU | UACUAAC | CAG |
| RPS17A | Full length parent of RP51A |
|
GUAUGU | UACUAAC | UAG |
RP51A pre-mRNA was generated as previously described (Hoskins et al., 2011). For the seven endogenous introns, pre-mRNAs were transcribed from PCR products amplified from genomic DNA of strain BJ2168.Since S. cerevisae introns tend to be located very close to the transcription start site(Fink, 1987), eachin vitro-transcribed premRNA consisted of the entire first exon, the intron, and 50 nucleotides of the second exon of the parent gene. When assayed in bulk splicing reactions, first and second step products could be observed for all eight pre-mRNA species. Thus the ability to splice in vitro seems to be a general feature of yeast introns. Nonetheless, they exhibited significantly different rates and yields for the two chemical steps of splicing (Figure 1). The difference in splicing rates between the fastest and slowest pre-mRNAs, RPS30A andRPS17A, respectively, was >30-fold.
Subcomplex association kinetics are similar for pre-mRNAs that are spliced at widely different rates
To determine if the above ensemble splicing rate differences (Figure 1E) were attributable to different rates of subcomplexassociation , we employed CoSMoS experiments to individually monitor U1, U2, U5 and NTC binding dynamics on all eight pre-mRNA species. These experiments were performedin WCEs in which the subcomplex of interest was fluorescently labeled by a tight, noncovalent interaction between two protein substituents carrying a C-terminal E. colidihydrofolatereductase (eDHFR) tag and a trimethoprim-dye conjugate.We exposed surface-tethered, dye labeled pre-mRNA molecules to WCE (Figure 2A). Subcomplex binding was detected as co-localization of subcomplex and pre-mRNA fluorescent labels (Figure 2B). Neither photobleaching(see Experimental Procedures) nor dye exchange (Hoskins et al., 2011) contributes significantly to the subcomplexdynamics observed under the experimental conditions used here. Control samples lacking surfaced-tethered premRNAs exhibited very few binding events for any of the four subcomplexes. For each pre-mRNA species, hundreds of individual molecules were analyzed (N = 153 to 422), allowing production of rastergrams(digital representations of single molecule fluorescence time records)that display the binding dynamics of each subcomplex (Figures 2C and D).
Figure 2.

Recruitment of individual spliceosomalsubcomplexes to single surface-tethered pre-mRNA molecules observed by CoSMoS.(A)Experimental design.Spliceosomalsubcomplexes (circles) labeled with a green dye (star) colocalized with surface-tethered pre-mRNA moleculeslabeled with a red dye (star) were visualized by total internal reflection fluorescence (TIRF) microscopy using excitation with red and green lasers (arrows). Subcomplexes free in bulk solution (gray shading) were not detected. (B) Example CoSMoS data showing binding of U1 snRNP to ACT1 premRNA. Fluorescence emission from a single field of view (diameter 24 μm) was separated to produce images of pre-mRNA and U1 snRNP molecules. Individual molecules are detected as discrete spots of fluorescence; red squares mark an example of a pre-mRNA molecule with U1 bound. (C) Top: part of the time series of U1 fluorescence images taken from the location of the pre-mRNA molecule marked in (B) (1 sec per frame). Bottom: Complete time record of U1 fluorescence from the same premRNA. Intervals in which U1 is colocalized with the pre-mRNA are indicated as black bands on the time ribbon. (D)Rastergrams (stacked time ribbonsfor multiple individual pre-mRNA molecules) summarizing the recruitment of the U1, U2, U5 and NTC by eight different pre-mRNAs. Each rastergram shows data on 100 pre-mRNA molecules taken from a separate experiment (32 experiments total). Only the first 1100, 1600, 2000, and 2000 sec of data are shown for U1, U2, U5 and NTC, respectively. (E). Average time (±S.E.M.) to first binding of the indicated subcomplex to each pre-mRNA molecule. See also Figure S1.
In these experiments the majority of pre-mRNA molecules bound each subcomplex at least once. Further, as observed in previous work on RP51A(Hoskins et al., 2011), many pre-mRNA molecules bound a given subcomplexmultiple times(Figure S1A). Thus reversible binding of individual subcomplexes is a common feature of initial spliceosome assembly on many pre-mRNAs. As we previously reported, U1 snRNP exhibited the most dynamic binding [during the first 20 minutes, an average of 3.2 ± 0.5 (S.E.M.) binding events lasting ≥1.5 sec were observed per pre-mRNA molecule],with the other subcomplexes being less dynamic [1.7 ± 0.2 for U2; 1.9 ± 0.3 for U5; 1.4 ± 0.2 for NTC].Among pre-mRNA species there was no apparent correlation between the splicing rate (Figure 1D, E) and either the percentage of pre-mRNA molecules that boundindividual subcomplexes or the total number of subcomplex binding events(Figure S1A). Therefore, the>30-fold range in splicing rates cannot be readily explained by differences in subcomplexbinding rates or the apparent ratio between productive and unproductive events.
In addition to the number of binding events, our single molecule traces allowed us to examine the kinetics of subcomplex association. We observed that different premRNA species exhibited distinct kinetics. For example, much of the U2 association withRPS30A occurred in the first 500 seconds, whereas U2 association with UBC4 was more uniformly distributed across the 1600-second time course shown (Figure 2D). Nevertheless, when the subcomplex binding data are considered as a whole (Figure 2E), there is no single subcomplex binding step whose kinetics appears to explain the >30-fold range in splicing rates (Figure 1). Notably, even the most poorly spliced premRNAs in our set (TEF4, IMD4 and RPS17A) displayed average times to first subcomplexbinding that were similar to (or at most 2-fold greater than) those of the fastest splicing pre-mRNAs. Further,for all three species>48% of pre-mRNA molecules exhibited one or more long-lived (≥ 1.5 sec) U5 binding events and >33% exhibited one or more long-lived NTC binding events during the first 20 min of the experiment (Figure S1A). Thus, we hypothesize that the low splicing efficiencies for TEF4, IMD4 and RPS17A are not due to theirfailure to enter and proceed along the initial spliceosome assembly pathway.
Taken together, the data characterizing subcomplex recruitment by (Figure 2) and splicing rates and efficiencies for different pre-mRNAs demonstrate that processes other than subcomplex binding kinetics must account for the differences in splicing rates observed in vitro. A likely explanation is that different rates of activation or chemistry after the spliceosome is assembled account for the broad range of splicing kinetics observed.
U1•U2•pre-mRNA pre-spliceosome formation prior totri-snRNP recruitment is a general feature of yeast spliceosome assembly
In our previous CoSMoS study (Hoskins et al., 2011) we used dual-labeled WCEs to examine the order in which spliceosomalsubcomplexes bound to pre-mRNA molecules. This analysis revealed that for RP51A pre-mRNA, U1 generally binds before U2, and U2 generally binds before the U5•U4/U6 tri-snRNP. However, those experiments were unable to reveal whether tri-snRNP binding requires prior formation of an U1•U2•pre-mRNA complex, as suggested by the sequential spliceosome assembly model(Figure 1A). To test whether U1•U2•pre-mRNA complex formation generally precedes tri-snRNP recruitment, we performed CoSMoS experiments with triply-labeled WCE in which U1, U2 and U5 were each labeled with a different colored fluorophore. For these experiments we used RP51A, RPS30A, RPS30B, ACT1, UBC4 and RPS17A pre-mRNAs.
Pre-mRNA molecules were first attached to the surface and the surface density verified by imaging a dye label on the RNA.This dye was then photobleached to avoid interference with subsequent subcomplex imaging. Next, we introduced the triply-labeled WCE (Figure 3A). Control samples lacking surfaced-tethered pre-mRNAs exhibited very few binding events for any of the three subcomplexes (Figure S2C). In contrast, when a pre-mRNA was present, fluorescent spots of each of the three colors were readily observable (Figure 3B and S2A), and often occurred either simultaneously or sequentially at the same position in the microscope field. Given the low pre-mRNA surface densities used, these colocalized spots likely represented subcomplexes binding to a single pre-mRNA molecule. Consistent with earlier studies (Ruby and Abelson, 1988) only U1 accumulation was observedin the absence of ATP(Figure S2B).
Figure 3.

Sequence of U1, U2 and U5 binding to surface-tethered pre-mRNAs. (A) Experimental design. Surface-tethered pre-mRNA was labeled with a blue fluorophore that was used to monitor pre-mRNA surface density. Before the experiment this fluorophorewasphotobleached (white star with blue outline) so as not to interfere with detection of U5 fluorescence. U1, U2 and U5 in WCE were each dye labeled; binding to the pre-mRNA was detected with red, green, and blue lasers respectively. Only events in which formation of a U1•U2•pre-mRNA pre-spliceosome was followed by U5 binding were selected for analysis. (B)Example images. Fluorescence of U1 (left), U2 (center) and U5(right) wasrecorded from a single field of view at 1,110 seconds after addition of triple-labeled WCE containing ATP to a chamber with surface-immobilized UBC4 premRNA. Insets show magnified images from the same 3.54 × 2.93 μm area of the chamber surface (white frames). (C) Example segments of fluorescence recordsof U1, U2, and U5 binding to three RPS30A pre-mRNA molecules. Pre-spliceosome formation by the U1→U2 (red dashed line) and U2→U1 (green dashed line) pathways is marked.(D) Distribution (± S.E.) of the time intervals (tU5– tU1•U2) between the formation of the U1•U2•RPS30A pre-mRNA complex and the binding of U5. Pre-spliceosomes that formed by the U1→U2 (red) and U2→U1 (green) pathways were analyzed separately;exponential fits (lines) yielded apparent first-order rate constants for U5 binding to the U1•U2•pre-mRNA complex of 0.40 ± 0.05 and 0.36 ± 0.06 min-1, respectively.(E)Summary of the pathways observed in this experiment.Spliceosome assembly up to B complex (bottom) can occur via both U1→U2 and U2→U1 branches. (F)Fraction of complexes that formed through the U1→U2 (red) or U2→U1 (green) pathways or for which the pathway was indeterminate (gray).See also Figure S2.
To assess whether U5•U4/U6 tri-snRNP binding requires prior formation of a U1•U2•pre-mRNA pre-spliceosome, we first picked pre-mRNA molecules that displayed U5 binding events. For each of the six pre-mRNA species examined, 90-95% of the U5 binding events were preceded by the observed simultaneous presence of U1 and U2 on the same pre-mRNA molecule(N = 521 to 651 for each pre-mRNA species).This high degree of correlation suggests that tri-snRNP binding requires prior U1•U2•pre-mRNA pre-spliceosomeformation.To exclude the possibility that this apparent correlation resulted simply from the faster binding kinetics of U1 and U2 compared to U5, we performeda control analysis in which we examined whether each U5 binding eventon a pre-mRNA molecule was preceded by U1•U2•pre-mRNA pre-spliceosome formation on a different, randomly chosen pre-mRNA. For RPS30A (which is the most stringent test because it displayed the fastest U2 binding kinetics; Figure 2E), the correlation measured in the control analysis, 65 ± 3%(N = 286) was significantly lower than the same molecule measurement 93± 1% (N = 488; p = 10−20 assuming the errors are normally distributed).We conclude that on all introns tested most or all U5•U4/U6 trisnRNP binding requires prior U1•U2•pre-mRNA pre-spliceosomal complex formation. Ordered formation of the pre-spliceosome and B complex is thus likely to be a general feature of yeast spliceosome assembly.
Pre-spliceosomal complexes on pathway for tri-snRNP addition can form by recruiting either U1 or U2 first
Having confirmed that U1•U2•pre-mRNA pre-spliceosome formation generally precedes tri-snRNP recruitment on our set of yeast pre-mRNAs, we next investigated whether U1 recruitment must precede U2 in order to recruit the tri-snRNP. Consistent with such a highly ordered U1→U2→U5•U4/U6→NTC assembly pathway (Hoskins et al., 2011), the average time to first binding of a given subcomplex to pre-mRNA occurred in the order U1 < U2 < U5 < NTC on seven of our eight pre-mRNA species (Figure 2E). For RPS30A, however, the pattern was U1 ≈ U2 < U5 < NTC (Figure 2E, arrow), suggesting that a significant fraction of RPS30A molecules might first bind U2 simultaneously with or prior to U1. Experiments with RPS30A in dual-labeled WCE in which U1 and U2 were labeled with different colored fluorophores confirmed that ~40% of RPS30A pre-mRNA molecules appeared to recruit U2 prior to U1 (Figure S1B). In contrast, U2 bound first to <10% of RP51A molecules in our studies. Thus U1•U2•premRNA complex formation on RPS30A pre-mRNA may not be as highly orderedas on RP51A pre-mRNA.
Are U1•U2•pre-mRNA complexes formed by the U1-first and U2-first pathways equally competent for U5•U4/U6 tri-snRNP recruitment? Within thetriply-labeled WCE dataset (Figure 3A,B), we could readily observe U5 binding to pre-spliceosomes formed by either the U1-first (Figure 3C, left) or the U2-first pathway (Figure 3C, center and right). To examine the U5 binding rates for RPS30A pre-spliceosomes formed by either pathway we measured for each U5 binding event tU5 – tU1•U2, the time between arrival of the final component of the pre-spliceosome and arrival of U5 (Figure 3C). The distribution of tU5 – tU1•U2 values was exponential, consistent with a single rate-limiting step between pre-spliceosome formation and tri-snRNPassociation, as was previously inferred for RP51A pre-mRNA (Hoskins et al., 2011). When we separately considered complexes produced by the U1-first versus U2-first assembly pathways, the tU5 – tU1•U2distributions were indistinguishable (Figures 3D, S2D). In addition, the assembly pathway had no effect on the efficiency of tri-snRNP recruitment, with 80±3% of all U1→U2 complexes and 83±5% of all U2→U1 pre-spliceosomes recruiting U5, respectively.Thus, pre-spliceosomes formed by the two pathways are equally competent to perform the next major step in spliceosome assembly and are likely to be identical (Figure 3E).
All pre-mRNAs exhibit both U1-first and U2-first pathways
Having found that pre-spliceosomes capable of recruiting the U5•U4/U6 trisnRNP could assemble by either a U1-first or U2-first pathway on RPS30A pre-mRNA, we next wondered whether this was also true for other pre-mRNAs. Therefore, we analyzed as for RPS30A the triply-labeled WCE data for RP51A, RPS30B, ACT1, UBC4 and RPS17A pre-mRNAs. Remarkably, this revealed that pre-spliceosomes capable of recruiting U5 could assemble by either the U1-first or U2-first pathway for all six premRNAs. However, the prevalence of the two pathways differed among pre-mRNA species (Figure 3F). At one extreme was RP51A, for which 81 ± 2.1% of molecules went through the U1→U2 pathway, a result consistent with both previous ensemble data (Seraphin and Rosbash, 1989) and our previous single moleculeobservations (Hoskins et al., 2011) given the different data acquisition rates and analytical methods employed (see Experimental Procedures). At the other extreme wereUBC4 and RPS30A, for which 43 ± 2.4 to 47 ± 3.4 % of molecules, respectively, either recruited U2 before U1 or recruited them simultaneously within the time resolution of the experiment. Thus, the ability to form a pre-spliceosome functional for tri-snRNP recruitment is not a strictly ordered processfor any pre-mRNA studied, but the U1-first and U2-first pathways are used to different extents on different pre-mRNAs.
Pre-mRNAs that initiate spliceosome assembly via the U1-first or U2-first pathways are equally competent for splicing
Since the above experiments demonstrated that pre-spliceosomes formed by the U1-first and U2-first pathways were equally competent for tri-snRNP recruitment, we next asked whether they werealso equally competent for splicing. To address this, we synthesized RPS30A pre-mRNA containing on average of eight fluorophores within the intron, and performed CoSMoS experiments with WCE in which U1 and U2 were labeled withdifferent colored fluorophores (Figure 4A). For these experiments, U1 and U2 fluorescence was monitored continuously (1 sec frames), but the intron fluorescence was monitored only once every 2.5 minutes to limit photobleaching of the pre-mRNA dyes. Because splicing requires ATP, experiments lacking ATP could be used to determine the extent of intron fluorophorephotobleaching. Without ATP, 11% of RNA molecules had completely lost intron fluorescence by the end of 28 minutes of observation (Figure 4B), and fluorescence loss by single molecules occurred in multiple small steps consistent with successive photobleaching of the dyes (as in Figure 4C bottom). In the presence of ATP, a much larger fraction of molecules (57%) lost intron fluorescence (Figure 4B), and in many cases most or all of the fluorescence was lost in a single, large step, consistent with intron release (Figure 4C, top). The apparent 57% −11% = 46% splicing yield was comparable to what was observed in ensemble reactions on unlabeled RPS30A pre-mRNA (Figure 1D, bottom), suggesting both that the intron fluorophores did not significantly impair splicing and that fluorescence loss was an accurate reporter of splicing.
Figure 4.

Splicing of RPS30A pre-mRNAs through alternative pre-spliceosome assembly pathways. (A) Experimental design.Binding of labeledU1 and U2 was visualized with red and green excitation. The intron of each pre-mRNA molecule was labeled with 8 dye molecules on average; intron release was detected as loss of blue-excited fluorescence. (B) Fraction of intron fluorescent spots lostfrom a single field of view at various times after adding WCE with ATP (red; N = 923) or without ATP (black; N = 1272). The open red symbol is a photobleaching-independent estimate (average N = 474 ± 12 spot per field of view after 35 min; see Experimental Procedures(C)Time records of intron fluorescence loss in WCE+ATP. Top, an example of fluorescence loss that occurs in a single step, presumably due to splicing.Bottom, fluorescence loss in multiple steps, presumably due to photobleaching.Insets: Gallery of the images (1.34 × 1.34 μm) corresponding to each time point. (D)Rastergram summarizing the presence of fluorescent U1 (red) or U2 (green) snRNPs, or both (yellow), onindividual RPS30A pre-mRNA molecules.Only pre-mRNAs that were observed to loseintron fluorescence in a large step, presumably due to the intron departure,were selected for analysis (N = 54).Records are ordered by the time interval in which intron departure occurred (shading).(E)Time courses of intron departure (open symbols;from CoSMoS experiment) and the second step of splicing (filledsymbols;from ensemble experiment). The red arrow indicates an apparent lag in the intron departure detected in the CoSMoS experiments (see text). (F) Genesis of the U1•U2•pre-mRNA complex that most closely preceded intron departure from each pre-mRNA molecule in (D). Fractions of complexes formed through the U1→U2 (red) or U2→U1 (green) pathways are indicated.(G) Summary of the pathways observed in this experiment.Catalysis of splicing and subsequent intron release can occur through pre-spliceosomes assembled by both U1→U2 and U2→U1 branches.
To examine U1 and U2 dynamics on pre-mRNAs that ultimately spliced, we picked 54 single molecule records where most of the intron fluorescence abruptly disappeared in a single step, indicative of splicing. We ordered the records by the time of intron departure and plotted the binding of fluorescent U1 and U2 to each of these pre-mRNA molecules as a horizontal bar in a multicolor rastergram (Figure 4D). Thisrastergram revealed key features of spliceosome assembly and splicing. First, prior to intron departure, both U1 and U2 were observed to bind to all pre-mRNA molecules. Subsequent to intron departure, however, essentially no U1 or U2 binding eventswere detected on any of the pre-mRNA molecules in this data set. Thus neither U1 nor U2 detectably interact with the 114 nt spliced exon product complex, suggesting that their binding is exquisitely dependent on the presence of the intron. Second, the rate of intron release in this single molecule assay was remarkably similar to the rate of second step chemistry determined in our ensemble assays (Figure 4E). Thus intron release occurs quickly after second-step chemistry during RPS30A pre-mRNA splicing. Finally, in the single molecule experiment,we observed an apparent lagin intron release of ~200 sec (Figure 4E, arrow). This is consistent with the presence of multiple partially rate-limiting steps in the process of initial spliceosome assembly and activation(Hoskins et al., 2011).
Examination of the dynamics of U1 and U2 binding prior to intron release (Figure 4D) confirmed thatmany of the features we observed for the entire population of RPS30A moleculeswere shared by the subset of RPS30Apre-mRNA molecules destined to splice (46%; Figure 1D, bottom; Figure 2D). Even on the molecules destined to splice, U1 was highly dynamic with an average of 4.4 binding events per pre-mRNA molecule (236 events observed on 54 molecules). In contrast, U2 was far less dynamic on the pre-mRNA molecules destined to splice: the average number of binding events per molecule (56 events observed on 54 molecules) was less than for U1.Most importantly, roughly half of all U1•U2•pre-mRNA pre-spliceosome formation events that preceded intron loss on RPS30Aoccurred by binding U2 before U1 (Figure 4F), similar to the fraction of RPS30A pre-spliceosome formation events that preceded U5 binding (Figure 3F). Taken together, these data clearly support the existence of a branched pathway in which functional spliceosomes can form by either a U1-first or a U2-first mechanism. They further suggest that the branches come together at the prespliceosome stage (Figure 4G), as both branches producefunctionally (and likely structurally) identical pre-spliceosomes.
DISCUSSION
Spliceosome assembly in S. cerevisiae has been understood to be a highly-ordered process progressing linearly through a series of intermediate complexes culminating in a catalytically active spliceosome (Figure 1A). This model was based largely on the order ofstable complexes observable in ensemble biochemical reactions. But not all stable complexes are necessarily on-pathway for active spliceosome assembly. Further,key transient intermediates andbranched pathways can be difficult to detect in ensemble assays.
In the current work, wedeveloped single molecule methodologies to allow for the real time observation of up to three different molecular species binding to and dissociating from a surface-tethered RNA molecule in a crude cell lysate. This three-way CoSMoS allowed us to identify on-pathway spliceosome assembly intermediates occurring in unperturbedsplicing reactions on nonmutant pre-mRNAs. We examined theorder of U1, U2 and U5•U4/U6 tri-snRNP binding to a broad set of yeast introns of varying length and sequence. These experiments reveal that the mechanism of U1 and U2 recruitment is not linear, but occurs by a branched pathwaythat converges at the pre-spliceosome stage. Further, U1 binding was highly dynamic on all pre-mRNAs examined. This readily reversible U1 binding, coupled with the existence of multiple pathways for the initial assembly of functional spliceosomes,suggests that alternative splicing regulation in higher eukaryotes (particularly alternative 5' splice site choice) likely involves modulation of the fractional flux along multiple assembly pathways that are inkinetic competition.
A branched pathwayfor pre-spliceosome formation
The previous model that yeastpre-spliceosome assembly occurs entirely via a U1-first pathway was largely based on the following data from in vitro splicing reactions: (1) the most rapidly observable complexes formed on a well-spliced pre-mRNA contain U1 snRNA, but not other snRNAs(Ruby and Abelson, 1988); (2) stable U1 snRNP binding to the 5'SS can occur in the absence of ATP, whereas stable binding of other snRNPs requires ATP(Ruby and Abelson, 1988); (3) stable association of U2 and U5 snRNPs with a pre-mRNA requires intact U1 snRNA(Ruby and Abelson, 1988); and (4) a portion of radioactive pre-mRNA molecules preincubated in splicing extracts incapable of forming U2-containing complexes (because they lacked either ATP or intact U2 snRNP) was found to be stably associated with U1 snRNP in“commitment complexes” that couldbesubsequently chased into active spliceosomes even when challenged with a large excess of unlabelled competitor pre-mRNA(Legrain et al., 1988; Seraphin and Rosbash, 1989).
While the above studies were instrumental in pioneering our understanding of the major steps in initial spliceosome assembly, such ensemble studies are largely restricted to the detection and analysis of stable species in stalled splicing reactions. Therefore, such results are consistent with multiple possible assembly pathways.By allowing us to studythe dynamics of both short- and long-lived interactions with individual pre-mRNA molecules in unperturbed splicing reactions, our CoSMoS technology allows directly follow the pathway of individual assembly events. Using two-color WCEs, we previously reported (Hoskins et al., 2011) that RP51A pre-mRNA exhibits highly ordered (~90% or more) U1→U2 binding. The experiments with three-color WCEsreported here further refined this analysis by allowing us to focus on the subset of U1 and U2 binding events that are productive in the sense that they are directly followed by U5•U4/U6 tri-snRNP addition. Because the first U1 binding to RP51Ais3.3-fold faster than U5 binding (Figure 2E) and is much more dynamic(with on average 3.5U1vs 0.9U5long-lived events(≥ 1.5 sec) per RP51A pre-mRNA molecule during the first 20 min of the experiment; Figure 2D), many U1 binding events are necessarily unproductive for subsequent U5 recruitment. Nonetheless, when only U1 binding events productive for subsequent U5 binding were considered, a large fraction (>80%) still proceeded through the U1→U2→U5 pathway on RP51A pre-mRNA (Figure 3F). Thus our current data are consistent with our previous report that RP51A exhibits largely ordered U1→U2 binding. However, the improved methods developed for the present study (see Experimental Procedures) show clearly that a fraction(<20%) of RP51A pre-spliceosomes do in fact assemble by the U2-first pathway.
Coincidentally, of all six pre-mRNAs for which we performed three-way CoSMoS experiments, the RP51Apre-mRNA examined in our earlier study exhibited the greatest fractional flux through theU1→U2→U5 pathway, and the least through the U2→U1→U5 pathway.In contrast, the U2→U1→U5 pathway was more prevalent on each of the other five pre-mRNAs in our set, with UBC4 and RPS30A exhibiting the most fractional flux through the U2→U1→U5 pathway (Figure 3F). Thus different pre-mRNA species utilize the alternative branches to different extents, possibly because of differences in the relative rates of U1 and U2 binding to or dissociation from the pre-mRNA species. The pre-mRNA-specific kinetics may reflect differential 5'SS and BS accessibilities due to internal RNA structures and/or differential association kinetics of these sites with factors (e.g., branchpoint-binding protein) present in the WCE. These kinetic differences in snRNP recruitment in vitro may explain in part the previously reported in vivo transcript-specific effects of mutations in the core splicing machinery (Pleiss et al., 2007).
Unifying the in vitro and in vivo spliceosome assembly models
During transcription in vivo, the 5'SS of a pre-mRNA molecule is necessarily synthesized before the BS and 3'SS. Consistent with this, chromatin IP (ChIP) experiments in budding yeast have shown that U1 signal accumulates along the entire length of introns in vivo, whereas U2 and U5 signals are skewed toward intron 3' ends (Gornemann et al., 2005; Moore et al., 2006; Tardiff et al., 2006). These data could be interpreted as supporting a highly-ordered, U1-first spliceosome assembly mechanism. However, fluorescence recovery after photobleaching (FRAP) experiments in mammalian cells indicate that U1 is ~10-fold more mobile in vivo than the other spliceosomalsubcomplexes(Huranova et al., 2010). Further, the cold-sensitive phenotype observed in yeast upon lengthening (hyperstabilization)of the U1/5'SS duplex suggests that efficient splicing in vivo requires that the U1/5'SS interaction be relatively weak(Staley and Guthrie, 1999).All of these results are consistent with our CoSMoS data indicating highly dynamic U1 binding in vitro (Figures 2D and 4D, and (Hoskins et al., 2011)). Thus 5'SSs on nascent transcripts may be subject to numerous U1 arrivals and departures prior to synthesis and appearance of the downstream BS and 3'SS. This means that the particular U1 molecule that participates in productive cross-intron interactions with U2 on a nascent transcript in vivo may well have bound the 5'SS afterU2 arrived at the BS (Figure 5A).
Figure 5.

Implications of alternative pathways for U1 and U2 addition.(A) Cotranscriptional pre-spliceosome formation.RNA polymerase II (RNAP) transcribes the5’ SS before the BS, providing U1 an opportunity to bind prior to U2, but this may not dictate which binds first to form the pre-spliceosome (see text).(B)Spliceosome cycle – 2013. Overall pathway foryeast spliceosome assembly, activationand splicing incorporating both U1→U2 and U2→U1 branches and known reversibilities(Hoskins et al., 2011; Tseng and Cheng, 2008).
In vertebrates, where most genes contain multiple introns that are much longer than internal exons, initial spliceosome assembly is thought to initiate by “exon definition”, wherein cross-exon interactions facilitate initial U2 and U1 recruitment to exon ends(Robberson et al., 1990). Subsequent cross-intron interactions then pair these species with independently recruited U1 and U2 bound to adjacent exons. Thus, in higher eukaryotes, independent recruitment ofthe U1 and U2 snRNPs at opposite intronends is likely the predominant spliceosome assembly pathway. The data presented here showing that functional spliceosome assemblyin yeastcan also occur by independent recruitment of U1 and U2 at intron ends thus resolveslong-standing inconsistenciesbetween the exon definition model of spliceosome assembly supported by thein vivo effects of splice site and exon mutations in higher eukaryotes(Moldon and Query, 2010; Roca et al., 2013) and the “spliceosome cycle” model based largely on the series of stable complexesobservable in in vitro splicing reactions(Moore et al., 1993; Ruby and Abelson, 1991; Wahl et al., 2009).
Rethinking the spliceosome cycle
Given the existence of a branched pathway for U1 and U2 addition, are thereother non-canonical pathways for subsequent steps in spliceosome assembly? In our experiments in yeast WCE, almost all U5 binding events occurred subsequent to formation of a U1•U2•pre-mRNA complex. Thus U5•U4/U6 tri-snRNP recruitment to yeast introns apparently requiresprior recruitment of both U1 and U2. This result is consistent with previous data showing that blocking or cleaving the portions of U1 and U2 snRNAs that base pair with the 5'SS and BS, respectively, completely abrogates stable tri-snRNP recruitment (Ruby and Abelson, 1988). Although spliceosome assembly in human extracts is similarly blocked by degrading U2 snRNA(Krainer and Maniatis, 1985), human extracts supplemented with SR proteins are capable of splicing even in the absence of U1 snRNP(Crispino et al., 1994; Konforti et al., 1993; Tarn and Steitz, 1994). This difference between the yeast and mammalian systems likely reflects additional positive interactions in the mammalian system between the core splicing machinery and non-snRNP splicing factors bound to exonic and intronic splicing enhancer (ESE and ISE) elements (reviewed in (Fukumura and Inoue, 2009; Roca et al., 2013)).
More recent data suggest even greater flexibility for mammalian spliceosome assembly. For example, the polypyrimidine tract recognition factor U2AF, which functions to recruit U2 snRNP to mammalian BS sequences, was recently shown to physically associate with both the NTC and the phosphorylated C-terminal domain (CTD) of RNA polymerase II (David et al., 2011). Thus on some mammalian introns, U2AF and the NTC are likely recruited co-transcriptionally and prior to U5•U4/U6 trisnRNP recruitment. Another study reported purification of an in vitro-assembled cross-exon complex thought to represent an exon definition complex;mass spectroscopy analysis revealed it to contain U1, U2 and U5•U4/U6 tri-snRNP components (Schneider et al., 2010). This purified cross-exon complex could be converted into a cross-intron B-like spliceosomal complex by the addition of a 5'SS-containing oligonucleotide. The oligonucleotide presumably bound the U5 and U6 snRNAs in the cross-exon complex directly without ever engaging in a base pairing interaction with U1 snRNA (which in the cross-exon complex was paired with the 5'SS at the other end of the exon). Thus, in higher organisms, the predominant mode of spliceosome assembly on long introns separating short exons may be initial NTC and U5•U4/U6 tri-snRNPrecruitment to cross-exon complexeswhich are then converted to cross-intron spliceosomes, bypassing any requirement for a cross-intron U1•U2 pre-spliceosome.
Thus, both the above studies and our new single molecule data show that spliceosome assembly is more flexible and dynamic than is suggested by the canonical“spliceosome cycle”(Moore et al., 1993; Ruby and Abelson, 1991;Wahl et al., 2009). Our single molecule data examining the order of U1, U2 and U5•U4/U6 trisnRNP arrival suggest that the yeast spliceosome cycle shouldsimply be updated by addinga branched pathway for U1 and U2 addition (Figure 5B). However, the full scope of mammalian spliceosome assembly pathwaysis likely not amenable to depiction in any single schematic. Importantly, the existence of multiple alternative and reversible assembly pathways has profound consequences for our understanding of alternative splicingregulation.Our data suggest that alternative splice site choice mayinvolve kinetic modulation of alternative assembly pathways.Therefore, full understanding of how splice site selection is governed during alternative splicing will now require elucidation of the kinetically competent spliceosome assembly pathway(s) functioning on individual splice site pairs under specific cellular conditions.Whereas in vitro studies such as oursmay reveal a more complete spectrum of possible assembly pathways, elucidatingwhich pathways are relevant in vivo, and how the fractional flux through each pathway is modulated to regulate alternative splicing will necessitate development of methods capable of assessing spliceosome assembly dynamics at the single molecule level in living cells.
EXPERIMENTAL PROCEDURES
Preparation of the pre-mRNAs
Capped pre-mRNAs were producedin vitroby T7 RNA polymerase transcription (Crawford et al., 2008). The template for T7 RNA polymerase was prepared by PCR from yeast genomic DNA of strain BJ2168 using a forward primer encoding the T7 promoter followed by GG and a segment of the gene of interest. The gene segment consisted of the entire first exon, the entire intron, and 50 nucleotides of the second exon (see Supplemental Experimental Procedures).
The pre-mRNAs for ensemble splicing assays were32P-labeled as described (Crawford et al., 2008). The pre-mRNAs for the single molecule experiments wereprepared using T4 RNA ligase 1 (New England Biolabs)by splinted ligation of the 5’ capped pre-mRNA to a biotinated 2’-O-Methyl oligonucleotide (5’-mAmUmCmCmGmGmAmGmCmGmAmGaaU*mAmGmA-biotin-3’, where aaU*,5(3-aminoallyl)-uridine, was labeled with either Alexa647 or Alexa488 (Crawford et al., 2008).
The intron-labeled RPS30A pre-mRNA was constructed from three transcripts(see Supplemental Experimental Procedures) by splinted ligation with T4 RNA ligase 1(Moore and Query, 2000) to produce the intron-labeled RPS30A premRNA. Several 5-(3-aminoallyl)-UTPs were incorporated in the transcript comprising the middle part of the intron and were post-transcriptionally labeled with Alexa488tetrafluorophenyl ester (ARES DNA labeling kit, Invitrogen, Molecular Probes). The 3’ transcript was biotinylated post-transcriptionally using splint-directed extension by Klenow fragment (3’→5’ exo−; New England Biolabs). All pre-mRNAswere purified from a denaturing electrophoresis gel. On average eight Alexa488 dye moieties per intron-labeled RPS30A were spectrophotometrically detected (see Supplemental Experimental Procedures).
Preparation of yeast strains
Preparation of the yeast strains used to monitor binding of single spliceosomalsubcompexes(Figures 2 and S1A) was described previously(Hoskins et al., 2011). In each of these strains, two of the subcomplex proteins were tagged with C-terminal eDHFR (E. colidihydrofolatereductase) tags: SNP1 and PRP40 in U1 snRNP, CUS1and HSH155 in U2 snRNP, SNU114 and BRR2 in U5 snRNP, and CEF1 and NTC90 in NTC.
The yeast strain to simultaneously monitor U1, U2 and U5 binding (Figures 3 and S2) bears C-terminal eDHFR tags on SNP1 and PRP40 of U1 snRNP(Hoskins et al., 2011), a C-terminal SNAPftag of BRR2 (U5 snRNP), and a C-terminal CLIPf tag on CUS1 (U2 snRNP). All tags were linked to their respective proteins through (Gly-Ser-Gly)2 linkers(see Supplemental Experimental Procedures).
Preparation of the yeast strain with U1 and U2 snRNPs labeled with fluorophores of different colors (Figures 4 and S1B) was described previously(Hoskins et al., 2011). U1 proteins SNP1 and PRP40 were tagged with eDHFR tags and the U2 protein CUS1 was tagged withthe SNAP tag on theirC-termini.
Preparation of yeast whole cell splicing extracts
Yeast whole cell extracts (WCE) were prepared as previously described (Crawford et al., 2008) from yeast cultures grown to OD590 1.5 – 1.8. For strains that contained only eDHFR tags, the WCE was aliquoted and frozen in liquid nitrogen after the dialysis.
For the yeast strains containing SNAP, SNAPf,and/orCLIPftags in addition to the eDHFR tags, the fluorophore(s) (SNAP-Surface™ 549 for the SNAP tag, SNAP-Surface® 488 for the SNAPf tag, and CLIP-Surface™ 547 for the CLIPftag) were added to the WCE to a final concentration of 1-2 μM after the high speed centrifugation step. The labeling reaction was carried out at room temperature (24 °C) for 30 min in the dark. Excess dye was removed by gel filtration through Sephadex G-25 (Hoskins et al., 2011). Aliquots of the dye-labeled WCE were frozen in liquid nitrogen.
The activity of each WCE was tested (after labeling the SNAP, SNAPf, and CLIPf tags when present) in an ensemble splicing assay. Only WCE fractions with splicing activities comparable to that of the wild type WCE were used in the single molecule experiments.
WCE was thawed immediately before use. All extracts that contained eDHFR tags were used with added Cy3- or Cy5-trimethoprim (TMP) conjugates that were synthesized in the laboratory of Virginia Cornish as described in (Hoskins et al., 2011). The TMP conjugateswere added to the splicing mix to a final concentration of 20 nM immediately before loading it into the flow chamber for single molecule microscopy.
Ensemble experiments
The rates and yields of the first and second step reactions were detected in ensemble experiments in which pre-mRNA(trace labeled withα-32P-UTP)was incubated with WCE in the presence of ATPfor 0 – 60 min. Products of the first and second step were visualized by denaturing PAGE.The radioactivity in pre-mRNA, lariat intron intermediate and spliced exon bandswas quantified by phosphorimaging and divided by the number of uridines present in the corresponding species to yield the relative concentrationsRp,Rl, and Re, respectively.The fraction of the RNA molecules that accomplished first (f1) and second (f2) step of splicing was calculated as:
The time dependence of f1 and f2was plotted and fit to a single exponential function with a time offsett0and asymptotef0:
to determine the apparent rates kof the first and second chemical steps, respectively.
Single molecule experiments
The slides and the coverslips for flow chambers were plasma cleaned under argon plasma (Selvin, 2007). The chambers were constructed and treated with PEG/biotin-PEG and streptavidin (Crawford et al., 2008). Biotinated pre-mRNAs were tethered to the chamber surface at low densities (typically 0.2-0.5 fluorescent spots m−2). Custom-made micromirrorTIRF microscopes(Friedman et al., 2006) with modifications (Hoskins et al., 2011) were used to acquire images.The microscope fields of view ranged between 314 m2 to 3250 m2.
The splicing reaction was initiated at room temperature (24°C)by introducing into the flow chambers 40% WCE containingfluorophore-labeled proteins in splicing buffer (Crawford et al., 2008). Introduction of the solution was done either manually (dead time 30 – 120 sec) or with the use of the syringe pump (dead time <~20 sec) (Hoskins et al., 2011).The latter method was used to initiate the splicing reactionin allexperiments in which binding of fluorophore-labeled U1 snRNP was monitored. A photoprotection systembased on Pseudomonasprotocatechuatedioxygenase(Crawford et al., 2008) and 1mMTrolox(Dave et al., 2009; Hoskins et al., 2011; Rasnik et al., 2006) were used in all the experiments. In the experiments where SNAP-Surface®488 (blue) dye was imaged,additional triplet quencherscyclooctatetraene and 4-nitrobenzyl alcoholwere includedto final concentrations of 1 mM(Dave et al., 2009; Hoskins et al., 2011; Rasnik et al., 2006). For most experiments, ATP was added to a final concentration of 2 mM. For experiments conducted in the absence of ATP, the WCE was depleted of ATP (Hoskins et al., 2011).
During the experiments which monitored binding of individualspliceosomalsubcompexes to surface-tethered pre-mRNAs, Cy3-TMP-labeled (greenfluorophore)subcomplex fluorescence was imaged once every 1.4-1.5 sec by excitation at 532 nm(green laser; 1 sec frame duration). Once every 50 – 75 sec, the subcomplex imaging was interrupted, the microscope was automatically refocused (Hoskins et al., 2011) and the Alexa647-labeled (redfluorophore) pre-mRNA molecules were imaged by excitation at633 nm (red laser; one frame of 1 sec duration). Control experiments (Hoskins et al., 2011) demonstrated that few spots of subcomplex fluorescence were observed in the absence of surface-tethered RNA.
In experiments with the intron-labeled RPS30A pre-mRNA, we used an extract doubly labeled with Cy5-TMP (red fluorophore) on U1 snRNP and SNAP-Surface™ 549 (green fluorophore) on U2 snRNP. Samples were imaged (1 sec frame durations) by continuous excitation at 532 nm (green laser) and 633 nm (red laser). Once every 2.5 minutesthe U1•U2 excitation and imaging was interrupted, the microscope was automatically refocused, and a single frame of intron fluorescence by excitation at 488 nm (blue laser) was acquired. To formulate a photobleaching-independent estimate of the fraction of unspliced introns remaining at the end of the 35 minute-long incubation in WCE plus 2 mMATP experiment (Figure 4B, open red symbol) we measured the intron fluorescent spot surface density in 8 additional fields of view that were not exposed to any laser excitation earlier in the experiment.
For the experiments in which U1, U2 and U5 were labeled with fluorophores of different colors, the surface density of Alexa488-labeled pre-mRNA molecules was first checked using the fluorescence from the Alexa488 label (bluefluorophore). The Alexa488 label was then photobleached completely by exposure to 488 nm (blue laser) excitation in the absence of photoprotection reagents. We then introduced extract that was labeled with Cy5-TMP (red fluorophore) on U1 snRNP, CLIP-Surface™547(green fluorophore) on U2 snRNP and SNAP-Surface® 488(blue fluorophore) on U5 snRNP. U1 and U2 were imaged simultaneously by excitation at 532 nm (green laser) and 633 nm(red laser) either continuously (Figure 3F) or 3 continuous frames every 6 seconds (Figures 3C and D) (1 sec frame durations in each case). The U1•U2 excitation and imaging was interrupted once every 6(Figures 3C and D) or 10 (Figure 3F) seconds to automatically focus and acquire a single 1 sec duration image of U5 using excitation at 488 nm (blue laser). Each field of view included several surface-bound fluorescent beads (TransFluoSpheres® streptavidin labeled, 0.04 μm (488/645), Invitrogen). Bead locations were measured and used to correct for stage drift.The locations of the premRNA molecules on the surface in these records were taken to be all locations at which binding of U1 was observed, since surface binding of U1 in a control sample in which no pre-mRNA was present was ≤1% that in experimental samples (0.0009 vs. 0.08-0.12 fluorescent U1 spots m−2 averaged over all the fames in a recording).
Data Analysis
Analysis of CoSMoS data was performed using custom programs implemented in MATLAB (The Mathworks,Natick, MA). Intensity of labeled snRNP fluorescence at the position of each pre-mRNA molecule was integrated over a 3 × 3 or 5 × 5 pixel region and baseline corrected as described (Hoskins et al., 2011) Spliceosomal subcomplex binding eventswere scored using previously reported methods (Hoskins et al., 2011). The presence of two dye moieties on U1 snRNP enabled an emission intensity analysis (Hoskins et al., 2011) which confirmed that 71 ± 3 % of fluorescent U1 snRNPs contained two dyes. The fraction of non-fluorescent U1 snRNPs in triply labeled WCE could thus be estimated as 8.4%. For U1 snRNPs labeled with two dyes, 81.5 ± 3 % of recorded U1 binding events involved simultaneous arrival of the two fluorescent U1 proteins indicating that most of the observed binding events report on the recruitment of U1 snRNP rather than free proteins. Further, glycerol gradient sedimentation of the triply labeled WCE demonstrated that practically all of fluorescently labeled CUS1 is part of U2 snRNP (Figure S2E). The analysis of the emission intensities from U2 snRNP (which was labeled with a single dye moiety) indicated that the nearly all of pre-mRNA molecules that assembled the spliceosome via U2→U1→U5 pathway were not observed to bind a second U2 snRNP when one was already bound (96% for RPS30A pre-mRNA, N = 122). The times to the first binding event (Figure 2E) were averaged for all pre-mRNAs that were observed to bind a spliceosomalsubcomplex in each experiment where a single spliceosomal complex was fluorescently labeled.
In our previous study(Hoskins et al., 2011) we used WCE in which U1 and U2 were labeled to determine the order of U1 and U2 binding by finding the first U2 binding event in a record, and then finding the U1 binding event that was closest in time and recording whether this U1 event was before or after the U2 event. In the present study, we refined these analysis methods in two important ways. First,in the present study we confined our analysis to molecules that were observed to bind U5 (Figure 3) or for which intron departure was observed (Figure 4). This reduced or eliminated spurious data from the subpopulation of pre-mRNAs in the data set that were trapped in dead-end complexes (Hoskins et al., 2011). Second, in the present study we scored formation of a U1•U2•pre-mRNA complex only when we observed both U1 and U2 fluorescence present simultaneously on the same pre-mRNA molecule, rather than merely requiring their sequential presence as in the earlier study. This may have removed a small number of events in which the U1 and U2 molecules were not simultaneously present on the pre-mRNA and therefore did not form a pre-spliceosome. In particular, in the experiment shown in Figure 3 we tabulated each U5 binding event that was preceded in the data record by a time interval in which a U1•U2•pre-mRNA complex was present as judged by observation of simultaneously present U1 and U2 fluorescence. For U5 events that were preceded by multiple intervals in which U1 and U2 were both present, only the interval that most closely preceded U5 binding was included. If two or more U5 binding events were detected after the formation of a given U1•U2•pre-mRNA complex, only the earliest of these was included. For the tabulated pairs of U1•U2 and U5 events, the time of the first frame in which U5 was detected was defined as tU5, and the time of the first frame in which both U1 and U2 fluorescent spots were simultaneously present was defined as tU1•U2(e.g., see Figure 3C). Each pair was classified based on the order of U1 and U2 arrival (e.g., see Fig. 3F): as “U1→U2” for events in which U2 appearance coincided with tU1•U2,as “U2→U1” for events in which U1 appearance coincided with tU1•U2,and as “tU1=tU2” for events in which U1 and U2 appearances were simultaneous within the experimental time resolution. For events in each classification, the delay times tU5 – tU1•U2were calculated and the probability density distribution plot(Figure 3D) was constructed by binning the delay times and dividing the number of observations in each bin by both the total number of events in the group and by the width of the bin. Theunbinned data were fit (Figure 3D, lines) with a one-parameter single exponential function using a maximum likelihood algorithm (Hoskins et al., 2011) to yield the apparent first order rate constant for U5 snRNP binding to the prespliceosomal complex. The standard error of the rate constant was estimated by bootstrapping(Hoskins et al., 2011).
For the experiments with labeled intron (Figure 4), we selected only pre-mRNA molecules that displayed intron departure as judged by (1) loss of intron fluorescence in a single step in intensity that was judged to be larger than that observed for photobleaching of a single dye moiety, or (2) loss of intron fluorescence in multiple steps, the last of which was judged to be at least twice the size of single-dye photobleaching steps observed earlier in the same pre-mRNA molecule. Once these intron loss events were identified, the preceding pre-spliceosome formation event was identified and classified with respect to the order of U1 and U2 binding in a manner analogous to that described for the Figure 3 experiment. The time course of intron departure (Figure 4E) was normalized based on the assumption that the fraction of premRNA molecules that displayed intron departure by1,844sec (CoSMoS experiment) was equal to the fraction that performed the second chemical step of splicing by 1,800 sec (ensemble experiment).
Supplementary Material
HIGHLIGHTS.
Functional spliceosomes can assemble by both U1-first and U2-first pathways.
The first U1 binding event does not commit a pre-mRNA to splicing.
Splicing rates and efficiencies are not limited by subcomplex association rates.
An updated spliceosome cycle is proposed.
Acknowledgements
We thank Richard Wombacher, Sarah Gallagher and Virginia Cornish for Cy3- and Cy5-TMP analogs. We thank E. Anderson, J. Chung, N. Ramirez, B. Smith, A. Okonechnikov, J. Yan and E. Heyer for helpful discussions and technical assistance. This work was supported by NIH R01 GM043369 (J.G.), GM81648 (J.G.), GM53007 (M.J.M.) and K99/R00 GM86471 (A.A.H.). M.J.M. is an HHMI Investigator.
Footnotes
Publisher's Disclaimer: This is a PDF file of an unedited manuscript that has been accepted for publication. As a service to our customers we are providing this early version of the manuscript. The manuscript will undergo copyediting, typesetting, and review of the resulting proof before it is published in its final citable form. Please note that during the production process errors may be discovered which could affect the content, and all legal disclaimers that apply to the journal pertain.
References
- Abelson J, Blanco M, Ditzler MA, Fuller F, Aravamudhan P, Wood M, Villa T, Ryan DE, Pleiss JA, Maeder C, et al. Conformational dynamics of single pre-mRNA molecules during in vitro splicing. Nature Structural & Molecular Biology. 2010;17:504–512. doi: 10.1038/nsmb.1767. [DOI] [PMC free article] [PubMed] [Google Scholar]
- Crawford DJ, Hoskins AA, Friedman LJ, Gelles J, Moore MJ. Visualizing the splicing of single pre-mRNA molecules in whole cell extract. RNA. 2008;14:170–179. doi: 10.1261/rna.794808. [DOI] [PMC free article] [PubMed] [Google Scholar]
- Crispino JD, Blencowe BJ, Sharp PA. Complementation by SR proteins of pre-mRNA splicing reactions depleted of U1 snRNP. Science. 1994;265:1866–1869. doi: 10.1126/science.8091213. [DOI] [PubMed] [Google Scholar]
- Dave R, Terry DS, Munro JB, Blanchard SC. Mitigating unwanted photophysical processes for improved single-molecule fluorescence imaging. Biophysical Journal. 2009;96:2371–2381. doi: 10.1016/j.bpj.2008.11.061. [DOI] [PMC free article] [PubMed] [Google Scholar]
- David CJ, Boyne AR, Millhouse SR, Manley JL. The RNA polymerase II C-terminal domain promotes splicing activation through recruitment of a U2AF65-Prp19 complex. Genes & Development. 2011;25:972–983. doi: 10.1101/gad.2038011. [DOI] [PMC free article] [PubMed] [Google Scholar]
- Fink GR. Pseudogenes in yeast? Cell. 1987;49:5–6. doi: 10.1016/0092-8674(87)90746-x. [DOI] [PubMed] [Google Scholar]
- Friedman LJ, Chung J, Gelles J. Viewing dynamic assembly of molecular complexes by multi-wavelength single-molecule fluorescence. Biophysical Journal. 2006;91:1023–1031. doi: 10.1529/biophysj.106.084004. [DOI] [PMC free article] [PubMed] [Google Scholar]
- Fukumura K, Inoue K. Role and mechanism of U1-independent pre-mRNA splicing in the regulation of alternative splicing. RNA Biology. 2009;6:395–398. doi: 10.4161/rna.6.4.9318. [DOI] [PubMed] [Google Scholar]
- Gornemann J, Kotovic KM, Hujer K, Neugebauer KM. Cotranscriptional spliceosome assembly occurs in a stepwise fashion and requires the cap binding complex. Molecular Cell. 2005;19:53–63. doi: 10.1016/j.molcel.2005.05.007. [DOI] [PubMed] [Google Scholar]
- Hoskins AA, Friedman LJ, Gallagher SS, Crawford DJ, Anderson EG, Wombacher R, Ramirez N, Cornish VW, Gelles J, Moore MJ. Ordered and dynamic assembly of single spliceosomes. Science. 2011;331:1289–1295. doi: 10.1126/science.1198830. [DOI] [PMC free article] [PubMed] [Google Scholar]
- Hoskins AA, Moore MJ. The spliceosome: a flexible, reversible macromolecular machine. Trends In Biochemical Sciences. 2012;37:179–188. doi: 10.1016/j.tibs.2012.02.009. [DOI] [PMC free article] [PubMed] [Google Scholar]
- Huranova M, Ivani I, Benda A, Poser I, Brody Y, Hof M, Shav-Tal Y, Neugebauer KM, Stanek D. The differential interaction of snRNPs with pre-mRNA reveals splicing kinetics in living cells. The Journal of Cell Biology. 2010;191:75–86. doi: 10.1083/jcb.201004030. [DOI] [PMC free article] [PubMed] [Google Scholar]
- Konforti BB, Koziolkiewicz MJ, Konarska MM. Disruption of base pairing between the 5' splice site and the 5' end of U1 snRNA is required for spliceosome assembly. Cell. 1993;75:863–873. doi: 10.1016/0092-8674(93)90531-t. [DOI] [PubMed] [Google Scholar]
- Kotlajich MV, Crabb TL, Hertel KJ. Spliceosome assembly pathways for different types of alternative splicing converge during commitment to splice site pairing in the A complex. Molecular and Cellular Biology. 2009;29:1072–1082. doi: 10.1128/MCB.01071-08. [DOI] [PMC free article] [PubMed] [Google Scholar]
- Krainer AR, Maniatis T. Multiple factors including the small nuclear ribonucleoproteins U1 and U2 are necessary for pre-mRNA splicing in vitro. Cell. 1985;42:725–736. doi: 10.1016/0092-8674(85)90269-7. [DOI] [PubMed] [Google Scholar]
- Legrain P, Seraphin B, Rosbash M. Early commitment of yeast pre-mRNA to the spliceosome pathway. Molecular and Cellular Biology. 1988;8:3755–3760. doi: 10.1128/mcb.8.9.3755. [DOI] [PMC free article] [PubMed] [Google Scholar]
- Matlin AJ, Moore MJ. Spliceosome assembly and composition. Advances in Experimental Medicine and Biology. 2007;623:14–35. doi: 10.1007/978-0-387-77374-2_2. [DOI] [PubMed] [Google Scholar]
- Moldon A, Query C. Crossing the exon. Molecular cell. 2010;38:159–161. doi: 10.1016/j.molcel.2010.04.010. [DOI] [PubMed] [Google Scholar]
- Moore MJ, Query CC. Joining of RNAs by splinted ligation. Methods In Enzymology. 2000;317:109–123. doi: 10.1016/s0076-6879(00)17009-0. [DOI] [PubMed] [Google Scholar]
- Moore MJ, Query CC, Sharp PA. Splicing of Precursors to mRNA by the Spliceosome. In: Gesteland RF, Cech TR, Atkins JF, editors. The RNA World. Cold Spring Harbor Laboratory Press; 1993. pp. 303–357. [Google Scholar]
- Moore MJ, Schwartzfarb EM, Silver PA, Yu MC. Differential recruitment of the splicing machinery during transcription predicts genome-wide patterns of mRNA splicing. Molecular Cell. 2006;24:903–915. doi: 10.1016/j.molcel.2006.12.006. [DOI] [PubMed] [Google Scholar]
- Pikielny CW, Rymond BC, Rosbash M. Electrophoresis of ribonucleoproteins reveals an ordered assembly pathway of yeast splicing complexes. Nature. 1986;324:341–345. doi: 10.1038/324341a0. [DOI] [PubMed] [Google Scholar]
- Pleiss JA, Whitworth GB, Bergkessel M, Guthrie C. Transcript specificity in yeast pre-mRNA splicing revealed by mutations in core spliceosomal components. PLoS Biology. 2007;5:e90. doi: 10.1371/journal.pbio.0050090. [DOI] [PMC free article] [PubMed] [Google Scholar]
- Rasnik I, McKinney SA, Ha T. Nonblinking and long-lasting single-molecule fluorescence imaging. Nature Methods. 2006;3:891–893. doi: 10.1038/nmeth934. [DOI] [PubMed] [Google Scholar]
- Robberson BL, Cote GJ, Berget SM. Exon definition may facilitate splice site selection in RNAs with multiple exons. Molecular and Cellular Biology. 1990;10:84–94. doi: 10.1128/mcb.10.1.84. [DOI] [PMC free article] [PubMed] [Google Scholar]
- Roca X, Krainer AR, Eperon IC. Pick one, but be quick: 5' splice sites and the problems of too many choices. Genes & Development. 2013;27:129–144. doi: 10.1101/gad.209759.112. [DOI] [PMC free article] [PubMed] [Google Scholar]
- Ruby SW, Abelson J. An early hierarchic role of U1 small nuclear ribonucleoprotein in spliceosome assembly. Science. 1988;242:1028–1035. doi: 10.1126/science.2973660. [DOI] [PubMed] [Google Scholar]
- Ruby SW, Abelson J. Pre-mRNA splicing in yeast. Trends In Genetics: TIG. 1991;7:79–85. doi: 10.1016/0168-9525(91)90276-V. [DOI] [PubMed] [Google Scholar]
- Schneider M, Will CL, Anokhina M, Tazi J, Urlaub H, Luhrmann R. Exon definition complexes contain the tri-snRNP and can be directly converted into B-like precatalytic splicing complexes. Molecular Cell. 2010;38:223–235. doi: 10.1016/j.molcel.2010.02.027. [DOI] [PubMed] [Google Scholar]
- Selvin PR, Lougheed T, Tonks Hoffman M, Park H, Balci H, Blehm BH, Toprak E. Constructing Sample Chambers for Fluorescence Imaging with One-Nanometer Accuracy (FIONA) CSH protocols. 2007. pdb prot4867. [DOI] [PubMed]
- Seraphin B, Rosbash M. Identification of functional U1 snRNA-pre-mRNA complexes committed to spliceosome assembly and splicing. Cell. 1989;59:349–358. doi: 10.1016/0092-8674(89)90296-1. [DOI] [PubMed] [Google Scholar]
- Staley JP, Guthrie C. An RNA switch at the 5' splice site requires ATP and the DEAD box protein Prp28p. Molecular Cell. 1999;3:55–64. doi: 10.1016/s1097-2765(00)80174-4. [DOI] [PubMed] [Google Scholar]
- Staley JP, Woolford JL., Jr. Assembly of ribosomes and spliceosomes: complex ribonucleoprotein machines. Current Opinion In Cell Biology. 2009;21:109–118. doi: 10.1016/j.ceb.2009.01.003. [DOI] [PMC free article] [PubMed] [Google Scholar]
- Tardiff DF, Lacadie SA, Rosbash M. A genome-wide analysis indicates that yeast pre-mRNA splicing is predominantly posttranscriptional. Molecular Cell. 2006;24:917–929. doi: 10.1016/j.molcel.2006.12.002. [DOI] [PMC free article] [PubMed] [Google Scholar]
- Tarn WY, Steitz JA. SR proteins can compensate for the loss of U1 snRNP functions in vitro. Genes & Development. 1994;8:2704–2717. doi: 10.1101/gad.8.22.2704. [DOI] [PubMed] [Google Scholar]
- Tseng CK, Cheng SC. Both catalytic steps of nuclear pre-mRNA splicing are reversible. Science. 2008;320:1782–1784. doi: 10.1126/science.1158993. [DOI] [PubMed] [Google Scholar]
- Villa T, Ceradini F, Bozzoni I. Identification of a novel element required for processing of intron-encoded box C/D small nucleolar RNAs in Saccharomyces cerevisiae. Molecular and Cellular Biology. 2000;20:1311–1320. doi: 10.1128/mcb.20.4.1311-1320.2000. [DOI] [PMC free article] [PubMed] [Google Scholar]
- Wahl MC, Will CL, Luhrmann R. The spliceosome: design principles of a dynamic RNP machine. Cell. 2009;136:701–718. doi: 10.1016/j.cell.2009.02.009. [DOI] [PubMed] [Google Scholar]
- Xu Z, Wei W, Gagneur J, Perocchi F, Clauder-Munster S, Camblong J, Guffanti E, Stutz F, Huber W, Steinmetz LM. Bidirectional promoters generate pervasive transcription in yeast. Nature. 2009;457:1033–1037. doi: 10.1038/nature07728. [DOI] [PMC free article] [PubMed] [Google Scholar]
Associated Data
This section collects any data citations, data availability statements, or supplementary materials included in this article.