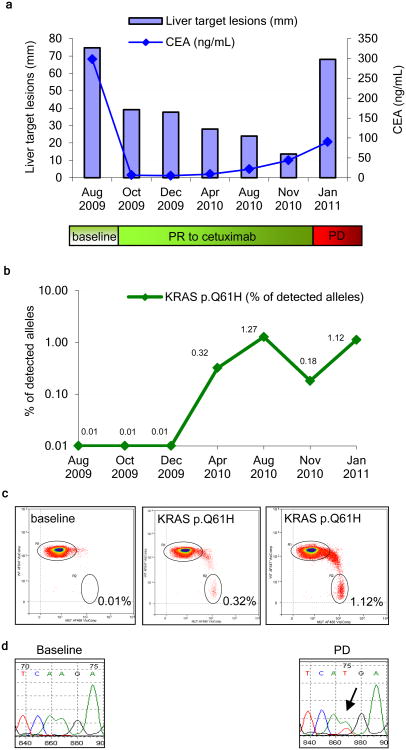
Figure 4. Detection of circulating KRAS mutant DNA in a patient with acquired resistance to cetuximab therapy.
(a) Size of liver metastasis (blue bars) and CEA levels in blood (blue line) at the indicated time points showing an initial response to cetuximab followed by progression (Patient 8). (b) Quantitative analysis of Q61H mutant DNA in plasma as assessed by BEAMing (green line). (c) Two dimensional dot plot showing quantitative analysis of the KRAS Q61H mutation in plasma using BEAMing at individual time points (d) Mutational analysis of KRAS on tumor samples collected pre-cetuximab treatment and at the time of disease progression.

