Abstract
Objectives:
Increasing awareness of the high prevalence of obstructive sleep apnea (OSA) and its impact on health in conjunction with high cost, inconvenience, and short supply of in-lab polysomnography (PSG) has led to the development of more convenient, affordable, and accessible diagnostic devices. We evaluated the reliability and accuracy of a single-channel (finger pulse-oximetry) photoplethysmography (PPG)-based device for detection of OSA (Morpheus Ox).
Methods:
Among a cohort of 73 patients referred for in-laboratory evaluation of OSA, 65 were simultaneously monitored with the PPG based device while undergoing PSG. Among these, 19 had significant cardiopulmonary comorbidities. Using the PSG as the “gold standard,” the sensitivity, specificity, negative predictive value (NPV), positive predictive value (PPV), as well as the positive likelihood ratio (+LR) for an apnea hypopnea index (AHI)PSG > 5/h and AHIPSG > 15/h were calculated for the PPG.
Results:
Valid results were available for 65 subjects. Mean age: 52.1 ± 14.2, Male: 52%, and BMI: 36.3 ± 9.7 kg/m2. Positive correlation was found between PPG-derived and PSG-derived AHI (r = 0.81, p < 0.001). For AHIPSG > 5/h, sensitivity was 80%, specificity 86%, PPV 93%, NPV 68%, and +LR was 5.9. For AHIPSG > 15/h, sensitivity was 70%, specificity 91%, PPV 80%, NPV 85%, and +LR was 7.83. The corresponding areas under the receiver operator curves were 0.91 and 0.9.
Conclusions:
PPG-derived data compare well with simultaneous in-lab PSG in the diagnosis of suspected OSA among patients with and without cardiopulmonary comorbidities.
Citation:
Romem A; Romem A; Koldobskiy D; Scharf SM. Diagnosis of obstructive sleep apnea using pulse oximeter derived photoplethysmographic signals. J Clin Sleep Med 2014;10(3):285-290.
Keywords: Obstructive sleep apnea, photoplethysmography, portable sleep monitoring
Obstructive sleep apnea (OSA) is a common sleep related disorder with a prevalence ranging from 5% to 15% among the general population.1,2 It has been widely recognized as a significant risk factor for many health-related consequences, including hypertension,3 heart failure,4 cardiac arrhythmias,5 stroke,6 and all-cause mortality.7 Effective treatment of OSA can mitigate these deleterious consequences.8–10 All the while, OSA frequently remains unrecognized and underdiagnosed,11 depriving a large number of patients much needed treatment, and resulting in increased health-care utilization and expenditures.12,13 One important reason OSA remains underdiagnosed is that the clinical symptoms do not map well to the presence or severity of the disease, thus hindering initiation of an appropriate work-up by the healthcare provider.14 Furthermore, this gap can be at least partially attributed to inconvenience and cost associated with in-laboratory polysomnography (PSG), as well as the current discrepancy between demand and availability of diagnostic services.15,16 With the goal of circumventing many of the limitations noted above, new technologies facilitating ambulatory diagnosis of OSA have been developed,17 and their validation is a clear research priority in sleep medicine.18
OSA has traditionally been diagnosed following a full-night in-lab, technician-supervised multichannel PSG. Although this remains the “gold standard” diagnostic method, the need for a less labor-intensive and costly procedure has led to the introduction of convenient home-based technologies for the diagnosis of OSA.18 It is commonly assumed that these new technologies might have the potential of being cost-effective, though the evidence so far is equivocal.19–22
BRIEF SUMMARY
Current Knowledge/Study Rationale: Obstructive sleep apnea remains mostly underdiagnosed, partially due to limited access and the cumbersome nature of in-lab polysomnography studies. In this study we evaluated the validity and accuracy of a single-channel, photoplethysmography-based, simple and affordable sleep monitoring device for the diagnosis of obstructive sleep apnea.
Study Impact: We show that utilization of the photoplethysmographic signal enables accurate diagnosis of obstructive sleep apnea among a diverse cohort of patients, using a convenient and affordable single-channel sleep monitoring device.
The Morpheus Ox (WideMed Ltd., Herziliya, Israel) is a portable single-channel (pulse oximeter), photoplethysmography (PPG)-based sleep monitoring device. PPG and oxygen saturation signals derived from the pulse oximeter are transmitted via Bluetooth technology to a dedicated cellular phone serving as a temporary data storage device. These data are later downloaded to a secured server via the internet and imputed into a proprietary algorithm to generate clinically relevant respiratory waveforms as well as detection of sleep-wake state. This facilitates the detection of OSA.23 Thus, an estimate of sleep time, apneahypopnea index, and oxygen saturation values are obtained.
Literature validating this technique is limited. Currently available literature used the American Academy of Sleep Medicine (AASM) 2007 scoring criteria for breathing events. Finally, currently available literature was conducted by the company producing the device.23,24
In the present study we independently evaluated the utility of the PPG device for the diagnosis of OSA in a cohort of subjects undergoing routine in-lab PSG. We also compared the utility of the device applying both the 2007 and the 2012 AASM scoring criteria.25,26
MATERIALS AND METHODS
Subjects and Data Collection Protocol
Seventy-three consecutive patients undergoing routine in-lab PSG as ordered by their physicians had the PPG based device placed on one of their hands in addition to routine sensor placement. Inclusion criteria were age ≥ 18 years and willingness to wear the device in addition to routine leads. The indication for PSG referral, among all patients, was a high pre-test suspicion for OSA as judged by the referring physician based on the patient's symptoms (snoring, witnessed apnea, daytime sleepiness), comorbidities (hypertension, heart failure), and physical examination (BMI, Mallampati score, neck circumference). The sole exclusion criterion was pregnancy. All PSGs obtained were purely diagnostic and did not include noninvasive ventilation titration studies. Demographic, polysomnographic, comorbidities, and medication utilization data were extracted from patients' chart. Significant cardiopulmonary comorbidities were defined as either a persistent cardiac arrhythmia, a cardiac ejection fraction < 45%, or an abnormal spirometric value consistent with moderate to severe ventilatory defect as defined by the American Thoracic Society.27 None of the patients received supplemental oxygen during the overnight PSG. The IRB of the University of Maryland School of Medicine approved the protocol.
Pulse Oximeter Photoplethysmograph
Theory
We used a device called Morpheus Ox (WideMed Ltd, Herziliya, Israel) to obtain PPG derived signals. This device utilizes a simple noninvasive technique based on optically obtained volumetric measurements of an organ, in this case the finger. PPG is frequently obtained through the use of a pulse oximeter, to detect blood volume changes in the microvascular bed of the tissue. Proprietary software23,24 was used to analyze the PPG for baseline variations, envelope, and rate. These parameters are combined to generate a PPG-derived respiration (PDR) waveform. PDR amplitude changes are further analyzed by the signal processing application and correlated with saturation reductions to detect a clinically relevant apnea-hypopnea index (AHI). The original software used a 4% reduction in saturation to define hypopneas (2007 AASM criteria). We also had the software modified to use a 3% reduction (2012 AASM criteria) for defining hypopneas. Each parameter or feature is modeled using Gaussian mixture model (GMM) probability density function (PDF) during sleep and wake. A Bayesian classifier using the likelihood ratio test is applied to discriminate sleep versus wake epochs based on their GMM PDFs. Thus the PPG software platform facilitates the detection and measurement of respiratory events, sleep/wake epochs, and total sleep time.23,24 Respiratory events occurring during wake epochs are excluded from further calculations while the remaining are averaged over the total sleep time to generate the AHI value.
PPG Acquisition
Data including PPG and saturation signals were obtained using a standard digital pulse oximeter (Nonin OEM III, Plymouth, MN) recorded simultaneously during the in-lab PSG. Following completion of the sleep study, proprietary software was used to process overnight data from the PPG, allowing measurement of sleep/wake status and respiration. Thereafter, correlation between the PPG and PSG was assessed on a per-patient basis. Patients who were assessed as having slept < 2 h by standard PSG were excluded from further analysis. In addition, if the PPG estimated sleep time < 2 h, the algorithm judges the data as “unreliable.” In this case, the data were also excluded from analysis.
Polysomnography
PSGs were performed in an AASM-accredited sleep laboratory according to commonly accepted clinical standards.28,29 The montage included encephalogram leads O1A2, O2A1, C1A2, C2A1, F1A2, F2A1; electromyogram leads for left eye, right eye, submentalis, and legs (left and right separately), electrocardiogram, and respiratory status measures by nasal airflow (nasal air pressure) and oronasal airflow (thermistor, used for backup), rib cage and abdominal respiratory effort (respiratory impedance plethysmographs), and pulse oximetry. Studies obtained between July 2011 and October 2012 were scored in 30-sec epochs according to the system of Rechtschaffen and Kales,30 as modified by the 2007 AASM scoring manual.25 Beginning in November 2012, all studies conducted were scored in 30-sec epochs according to the system of Rechtschaffen and Kales, as modified by the 2012 AASM scoring manual.26 Of note, the 2007 AASM guidelines define an apnea event as a decrease in nasal airflow to < 10% of baseline for ≥ 10 s with continued respiratory effort, and a hypopnea event as decrease in nasal airflow by 30% to 90% of baseline accompanied by oxygen desaturation > 4% for 10 s or more. While the definition of an apnea remains unchanged for the 2012 scoring criteria, the new guidelines define an hypopnea as a decrease in nasal airflow by 30% to 90% of baseline accompanied by oxygen desaturation > 3% and/or an arousal lasting ≥ 10 seconds. For primary clinical purposes, the severity of OSA was defined as follows: “mild” = AHI 5-14.9, “moderate” AHI 15-29.9, and “severe” = AHI ≥ 30. Respiratory event related arousals (RERA) were scored on PSG according to the relevant criteria, but did not come into the measurement of AHI. Further, the PPG system does not estimate RERAs.
Statistical Analysis
Descriptive statistics for continuous data are presented as means and standard deviations (normally distributed data) or median and 25-75 interquartile range (non-normally distributed data) as appropriate. Categorical data are presented as counts and percentage. Evaluation of the PPG performance at detecting OSA was carried out using a study-by-study comparison of the in-lab PSG derived AHI to the PPG based AHI estimator. A positive diagnosis of OSA was defined by comparing the PSG derived AHI against clinical thresholds of 5 and 15 events/h. The PPG based AHI performance metrics were assess for sensitivity, specificity, positive predictive value, negative predictive value, likelihood ratios and Cohen's κ coefficient in the diagnosis and staging of sleep disordered breathing, as well as the area under the receiver operator curve (ROC) when compared with PSG derived AHI values. Bland-Altman plots were used to further illustrate the performance of classification systems between estimated and actual AHI values. Using proprietary software (Wide Med), sleep studies obtained after November 2012 and scored according to the AASM 2012 guidelines were analyzed using both the original 4% desaturation based algorithm as well as the modified 3% desaturation based, algorithm (AASM 2012 criteria). The effect of the different algorithms on AHI estimator accuracy was evaluated. SigmaPlot 12.0 (Systat Software Inc., San Jose, CA) was used for all analyses and graph production.
RESULTS
Patient Characteristics (Table 1)
Table 1.
Summary of patient characteristics
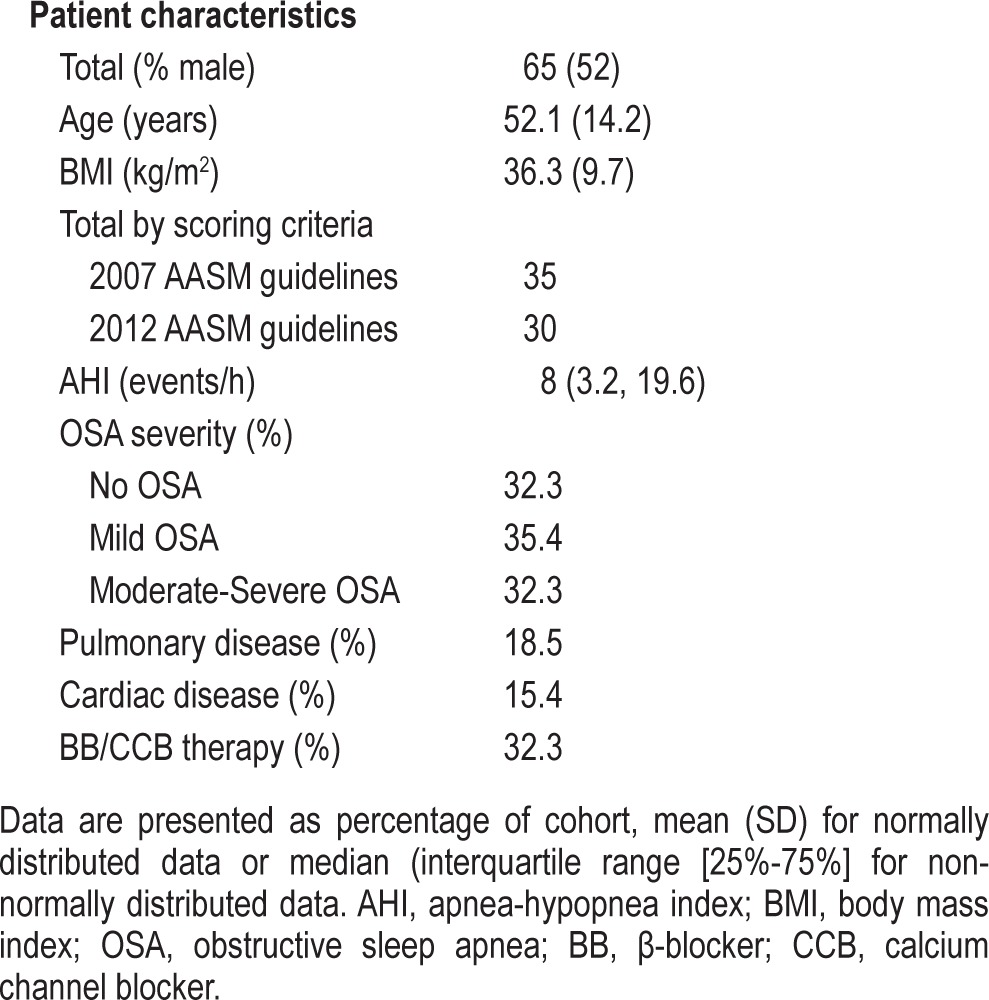
Among the original cohort of 73 patients, insufficient data were obtained in 8. Reasons included: (1) the patient taking the device off during the study (N = 3); (2) the Morpheus Ox estimating sleep < 2 h in spite of adequate sleep time by PSG (N = 2); and (3) sleep time measured from both the PSG and the PPG as being < 2 h (N = 3). This analysis is therefore based on 65 patients in whom data from PSG and PPG were compared. Patients studied prior to November 2012 were scored according to the 2007 AASM scoring rules (N = 35), while those studies from Nov 2012 onward had PSG scoring according to the AASM 2012 guidelines (N = 30).
Half of the study cohort was male, 74% were obese (body mass index > 30 kg/m2), and mean age was 52.1 years. Just under a third of the cohort had no evidence of OSA, while the remaining two-thirds were equally divided between those with mild OSA (AHI 5-15 events/h) and those with moderate-to-severe OSA (AHI ≥ 15 events/h). Seven patients reported chronic use of narcotic pain medications (methadone, oxycodone, tapentadol), 2 of whom were noted to have frequent central apneas comprising ≥ 50% of the total apneas recorded. In all other patients studied, central apneas were sporadic and infrequent. None of the patients reported use of hypnotic medications during their studies.
AHI Estimation with PPG (Table 2)
Table 2.
Performance metrics comparison of different PPG algorithm models at AHI threshold of 15* events/h
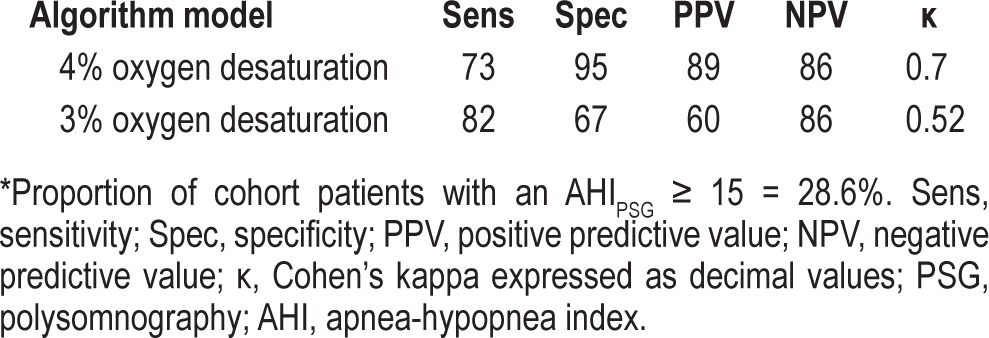
As noted above, during the study period the PSG scoring criteria for hypopneas were modified by the AASM. This prompted us to execute a subgroup sensitivity analysis looking at the effect of a change in the PPG software algorithm to include either a 3% desaturation criterion or a 4% desaturation cutoff level. As might be expected, applying the 3% desaturation cutoff level resulted in increased sensitivity at the cost of diminished specificity. Overall, the end result of the modified algorithm (using a 3% desaturation for definition of hypopneas) yielded less agreement as indicated by the Cohen's κ coefficient between the PPG and standard PSG. In addition, the use of the 3% criterion resulted in substantially lower prediction power as indicated by the drop in positive predictive value. Therefore, we choose to conduct all subsequent comparisons using the original PPG algorithm (i.e., using the 4% oxygen desaturation as the defining cutoff level).
Evaluation of sleep/wake estimators including total sleep time and sleep efficiency failed to show any significant correlation between PSG derived and PPG based parameters (r = 0.13, p = 0.29; r = 0.12, p = 0.34 for total sleep time and sleep efficiency, respectively).
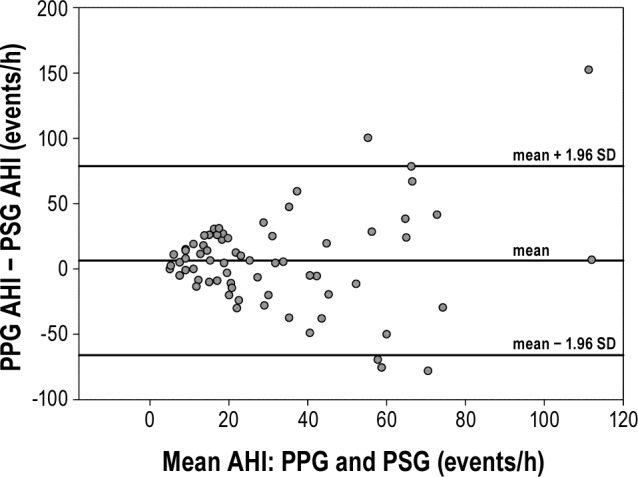
The AHI estimation algorithm was tested against the gold standard of full PSG on the dataset of 65 patient recordings, yielding a correlation of 81% with p < 0.001 (Figure 1). The Bland-Altman plot (Figure 2) showed good agreement between the PPG and the PSG estimates of AHI, with most estimates falling within 2 standard deviations of the mean.
Figure 1. Photoplethysmograpy (PPG) versus polysomnography (PSG) apnea-hypopnea index (AHI) estimates.
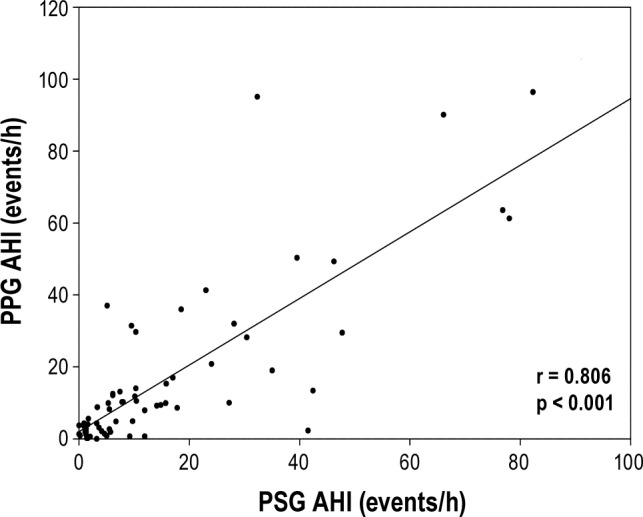
Figure 2. Bland-Altman plot of photoplethysmography (PPG) versus polysomnography (PSG) apnea-hypopnea index (AHI) estimates.
ROC were determined for 2 different PPG derived diagnostic thresholds (AHI ≥ 5 events/h and AHI ≥ 15 events/h) and included patients with significant cardiopulmonary comorbidity as well as those without (Figure 3). The inclusion of both groups (with and without cardiopulmonary comorbidity) was possible since the PPG's capability to detect OSA was comparable (Table 3): Cohen's κ values of 0.67 and 0.73, respectively; area under the ROC of 0.909 versus 0.903 among those with versus without comorbidity at a AHI threshold of 15 events/h.
Figure 3. The ROCs for photoplethysmographic versus polysomnographic AHI estimates.
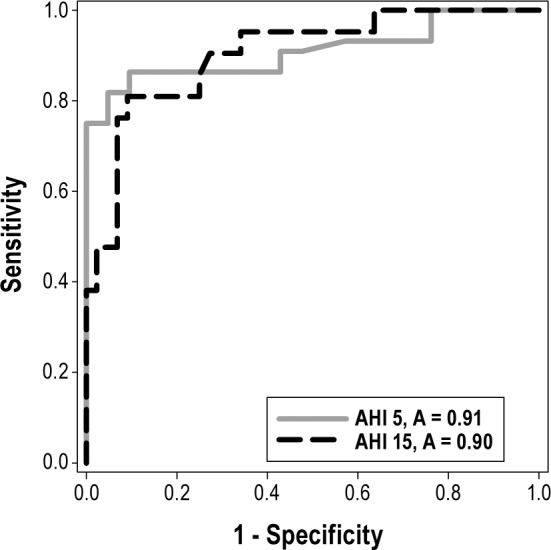
Two curves are shown with the AHI diagnostic threshold set at 5 and 15 events/h. A, area.
Table 3.
Performance metrics of the PPG device among patients with versus without cardiopulmonary comorbidity at AHI threshold of 15 events/h

Table 4 summarizes the performance of the algorithm in terms of sensitivity, specificity, positive and negative predictive values, positive and negative likelihood ratios, area under the curve, and Cohen's κ for each of the abovementioned clinical diagnostic thresholds. When a diagnostic threshold of mild OSA (AHI ≥ 5 events/h) was used, PPG displayed a sensitivity of 80%, a specificity of 86%, a positive likelihood ratio of 5.9, and area under the ROC of 0.909. Similarly, applying a diagnostic threshold of moderate-severe OSA (AHI > 15 events/h), PPG displayed a slightly lower sensitivity (70%), specificity of 91%, positive likelihood ratio of 7.83, and area under the ROC of 0.903.
Table 4.
Performance metrics of the PPG device at AHI threshold of 5 and 15 events/h

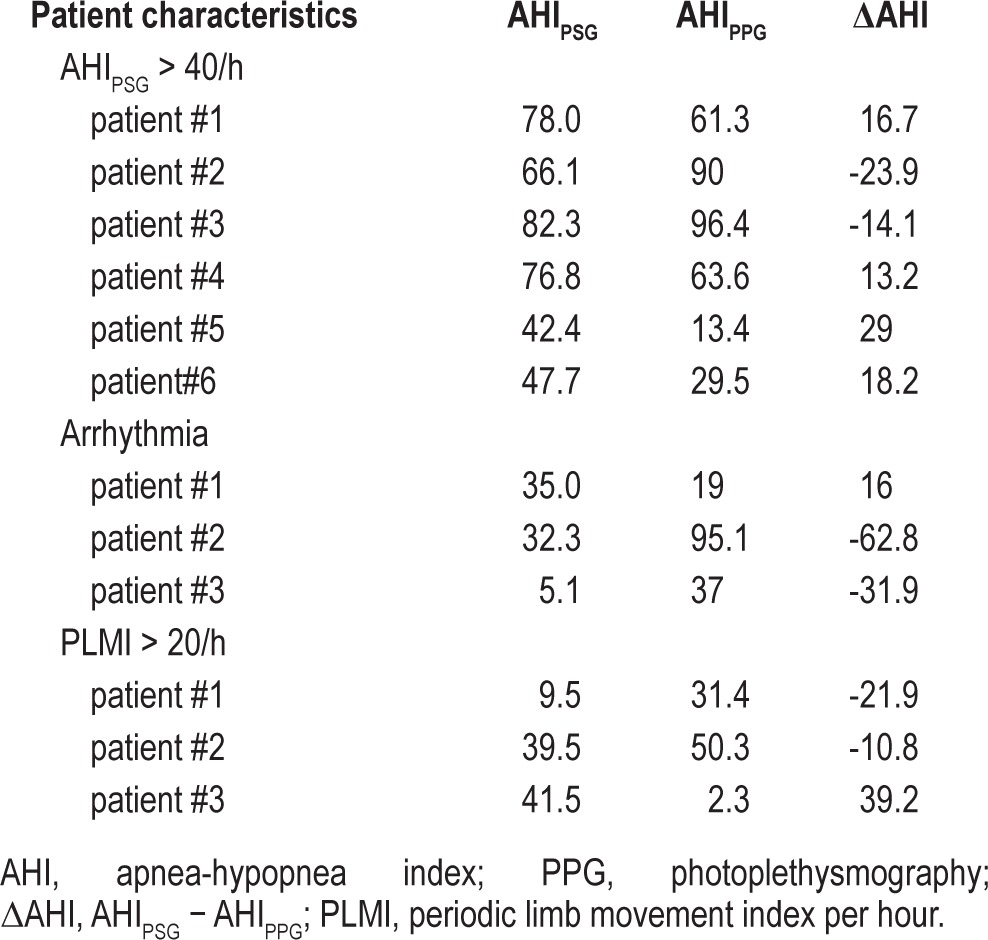
Table 5 shows individual data in 3 small groups of patients in whom the difference between PPG and PSG derived AHI was > 10 events/h. These included patients with high PSG AHI (> 40), those with arrhythmias, and those with high periodic limb movement indexes (> 20).
Table 5.
Underlying pathology of patients with increased AHI estimator discrepancy (> 10/h) between PSG versus PPG derived AHI values
DISCUSSION
We evaluated the validity of a single-channel, dual signal (oxygen saturation and PPG) portable monitoring system for the detection of OSA. We found a good correlation between the AHI using the PPG and that found during standard sleep testing. Further, the sensitivity, specificity, derived predictive values, and likelihood ratios were generally acceptable. In the ensuing discussion we consider these findings in the light of the currently available literature.
Use of a device such as the PPG is attractive for a number of reasons. First, it requires minimal set-up, hence making home testing extremely convenient and simple. Second, its unobtrusive nature potentially allows more normal sleep compared to traditional diagnostic modalities. Finally the device's relative low cost can facilitate its more widespread use as well as its application for several nights' sleep, thus potentially improving the detection rate of OSA.31 These advantages clearly need to be matched by proven diagnostic efficacy.
Using a diverse and representative sleep clinic population referred for in-laboratory evaluation of possible OSA, we found PPG estimation of OSA correlated well with PSG measurement. The measured outcomes were also assessed among a smaller subgroup of patients with significant cardio-pulmonary comorbidity and found to be similar to those of the cohort at large. Furthermore the device's accuracy was maintained despite the changes made to the scoring manual in the latter half of 2012. Whether defining OSA as AHI ≥ 5 events/h, or using a higher threshold (AHI ≥ 15 events/h), we found a high degree of accuracy, as illustrated by the ROC AUC of 0.91 and 0.9, respectively.
We found a somewhat lower sensitivity and specificity for the detection of OSA using this device compared to those reported in prior studies.23,24 We were also unable to show significant correlation regarding sleep/wake parameters, as opposed to reports in earlier studies with the device. These discrepancies could be due to differences in methodology. In the prior studies, the oximetry data obtained from the laboratory study were used to generate the estimations for AHI. The present study used the device as would be used in the home setting, thus simulating a more “real world” scenario. Using the device as a home monitor necessitates transmission of the signals from the PPG to the cellphone receiver by the bedside, which could result in some degradation. Further, it is possible that the two pulse oximeters used (each on a different hand) could have also resulted in slightly different waveforms.
In general the estimates of AHI based on PPG and PSG were within 10/h and groups were categorized similarly. However, there were three small groups of patients in whom the discrepancies in AHI estimates were greater than 10. The first group consisted of six patients with PSG AHI > 40 events/h, in whom the difference between the PPG derived and the PSG derived AHI (ΔAHI) was > 10 events/h (in both directions). Indeed, this observation is further supported by the correlation coefficient between AHIPPG and the ΔAHI (ρ = 0.538, p < 0.01). However, among these patients, the AHI discrepancy had no effect on OSA severity categorization in all but two subjects. The second group consisted of three patients with significant cardiac arrhythmias, including multiple premature ventricular contractions, atrial fibrillation, and pacemaker generated rhythm. This could be due to underlying problems with deriving respiratory events from heart rate rhythm variability. Finally, three patients with an increased periodic limb movement index (> 20 events/h) had high AHI estimator disagreement. The reasons for this discrepancy are not clear but may involve the effect of limb movements on the PPG signal.
Limitations of the current study include its in-lab setting, the limited number of subjects with significant cardiopulmonary comorbidities, and lack of patients on supplemental oxygen. Furthermore, we did not directly determine what additional diagnostic yield is obtained with PPG in addition to standard oxygen saturation measurement. Simultaneous PSG derived ODI 3% and 4% should be compared with PPG to address this issue in further research. It is important to note that this study focused on a cohort attending a sleep specialty clinic, thereby resulting in a selected cohort of patients with a higher pre-test probability of testing positive for OSA. This directly impacts the predictive values (PPV, NPV) as they depend on the pre-test probability as much as they depend on the sensitivity and specificity. These shortcomings can be partially overcome through the calculation of likelihood ratios, which are far less dependent on pre-test disease prevalence.32,33 Furthermore, applying the device to this specific population with a relatively high pre-test probability is in agreement with the AASM guidelines for the use of portable monitors in the diagnosis of OSA, which recommends against the use of similar devices in the investigation of asymptomatic individuals.17 Indeed, the PPG compared favorably with other portable monitoring devices and had similar performance metrics.34
In conclusion, a single channel, PPG based sleep monitoring device, compares well with simultaneous in-lab, technician-attended PSG in the diagnosis of suspected OSA. With the recognition that as of today, the AASM clinical guidelines for the use of unattended portable monitors in the diagnosis of OSA in adult patients explicitly requires minimum of three channels,17 our paper adds to the growing efforts to show that meaningful predictions can be made with limited channels.34 Future studies are needed to better define its utility among patients with complex comorbidities, including cardiac arrhythmias, periodic limb movement disorder, and dependence on supplemental oxygen. Future validation studies should also focus on home use of the device and the potential for improved diagnostic accuracy with multiple night evaluation.
DISCLOSURE STATEMENT
WideMed Ltd, donated the Morpheus Ox device for use in this study. The authors have indicated no financial conflicts of interest. The study was performed at the University of Maryland Medical Center.
REFERENCES
- 1.Young T, Peppard PE, Gottlieb DJ. Epidemiology of obstructive sleep apnea: a population health perspective. Am J Respir Crit Care Med. 2002;165:1217–39. doi: 10.1164/rccm.2109080. [DOI] [PubMed] [Google Scholar]
- 2.Punjabi NM. The epidemiology of adult obstructive sleep apnea. Proc Am Thorac Soc. 2008;5:136–43. doi: 10.1513/pats.200709-155MG. [DOI] [PMC free article] [PubMed] [Google Scholar]
- 3.O'Connor GT, Caffo B, Newman AB, et al. Prospective study of sleep-disordered breathing and hypertension: the Sleep Heart Health Study. Am J Respir Crit Care Med. 2009;179:1159–64. doi: 10.1164/rccm.200712-1809OC. [DOI] [PMC free article] [PubMed] [Google Scholar]
- 4.Gottlieb DJ, Yenokyan G, Newman AB, et al. Prospective study of obstructive sleep apnea and incident coronary heart disease and heart failure: the sleep heart health study. Circulation. 2010;365:19–25. doi: 10.1161/CIRCULATIONAHA.109.901801. [DOI] [PMC free article] [PubMed] [Google Scholar]
- 5.Fein AS, Shvilkin A, Shah D, et al. Treatment of obstructive sleep apnea reduces the risk of atrial fibrillation recurrence following catheter ablation. J Am Coll Cardiol. 2013;62:300–5. doi: 10.1016/j.jacc.2013.03.052. [DOI] [PubMed] [Google Scholar]
- 6.Redline S, Yenokyan G, Gottlieb DJ, et al. Obstructive sleep apnea hypopnea and incident stroke; the Sleep Heart Health Study. Am J Respir Crit Care Med. 2010;182:269–77. doi: 10.1164/rccm.200911-1746OC. [DOI] [PMC free article] [PubMed] [Google Scholar]
- 7.Punjabi NM, Caffo BS, Goodwin JL, et al. Sleep-disordered breathing and mortality: a prospective cohort study. PLoS Med. 2009;6:e1000132. doi: 10.1371/journal.pmed.1000132. [DOI] [PMC free article] [PubMed] [Google Scholar]
- 8.Duràn-Cnatolla J, Aizpuru F, Montserrat JM, et al. Continuous positive airway pressure as treatment for systemic hypertension in people with obstructive sleep apnoea: randomized controlled trial. BMJ. 2010;341:5991. doi: 10.1136/bmj.c5991. [DOI] [PubMed] [Google Scholar]
- 9.Kaneko Y, Floras JS, Usui K, et al. Cardiovascular effects of continuous positive airway pressure in patients with heart failure and obstructive sleep apnea. N Engl J Med. 2003;348:1233–41. doi: 10.1056/NEJMoa022479. [DOI] [PubMed] [Google Scholar]
- 10.Surendra KS, Swastik A, Deepak D, et al. CPAP for the metabolic syndrome in patients with obstructive sleep apnea. N Engl J Med. 2011;365:2277–86. doi: 10.1056/NEJMoa1103944. [DOI] [PubMed] [Google Scholar]
- 11.Kapur V, Strohl KP, Redline S, Iber C, O'Connor G, Niento J. Underdiagnosis of sleep apnea syndrome in U.S. communities. Sleep Breath. 2002;6:49–54. doi: 10.1007/s11325-002-0049-5. [DOI] [PubMed] [Google Scholar]
- 12.Ronald J, Delaive K, Roos L, Manfreda J, Bahammam A, Kryger MH. Health care utilization in the 10 years prior to diagnosis of obstructive sleep apnea syndrome patients. Sleep. 1999;22:225–9. doi: 10.1093/sleep/22.2.225. [DOI] [PubMed] [Google Scholar]
- 13.Kapur V, Blough DK, Sandblom RE, et al. The medical cost of undiagnosed slepp apnea. Sleep. 1999;22:749–55. doi: 10.1093/sleep/22.6.749. [DOI] [PubMed] [Google Scholar]
- 14.Skormo RP, Kryger MH. Clinical presentations of obstructive sleep apnea syndrome. Prog Cardiovasc Dis. 1999;41:331–340. doi: 10.1053/pcad.1999.0410331. [DOI] [PubMed] [Google Scholar]
- 15.Tachibana N, Ayas NT, White DP. A quantitative assessment of sleep laboratory activity in the United States. J Clin Sleep Med. 2005;1:23–6. [PubMed] [Google Scholar]
- 16.Flemons WW, Douglas NJ, Kuna ST, Rodenstein DO, Wheatley J. Access to diagnosis and treatment of patients with suspected sleep apnea. Am J Respir Crit Care Med. 2004;169:668–72. doi: 10.1164/rccm.200308-1124PP. [DOI] [PubMed] [Google Scholar]
- 17.Collop NA, Anderson WM, Boehlecke B, et al. Portable Monitoring Task Force of the American Academy of Sleep Medicine. Clinical guidelines for the use of unattended portable monitors in the diagnosis of obstructive sleep apnea in adult patients. J Clin Sleep Med. 2007;3:737–47. [PMC free article] [PubMed] [Google Scholar]
- 18.Kuna ST, Badr MS, Kimoff RJ, et al. An official ATS/AASM/ACCP/ERS workshop report: research priorities in ambulatory management of adults with obstructive sleep apnea. Proc Am Thorac Soc. 2011;8:1–16. doi: 10.1513/pats.2009-042WS. [DOI] [PubMed] [Google Scholar]
- 19.Chervin RD, Murman DL, Malow BA, Totten V. Cost-utility of three approaches to the diagnosis of sleep apnea: polysomnography, home testing, and empirical therapy. Ann Intern Med. 1999;130:496–505. doi: 10.7326/0003-4819-130-6-199903160-00006. [DOI] [PubMed] [Google Scholar]
- 20.Deutsch PA, Simmons MS, Wallace JM. Cost-effectiveness of split-night polysomnography and home studies in the evaluation of obstructive sleep apnea syndrome. J Clin Sleep Med. 2006;2:145–53. [PubMed] [Google Scholar]
- 21.Pietzsch JB, Garner A, Cipriano LE, Linehan JH. An integrated health-economic analysis of diagnostic and therapeutic strategies in the treatment of moderate-to-severe obstructive sleep apnea. Sleep. 2011;34:695–709. doi: 10.5665/SLEEP.1030. [DOI] [PMC free article] [PubMed] [Google Scholar]
- 22.Reuven H, Schweitzer E, Tarasiuk A. A cost-effectiveness analysis of alternative at-home or in-laboratory technologies for the diagnosis of obstructive sleep apnea syndrome. Med Decis Making. 2001;21:451–8. doi: 10.1177/0272989X0102100603. [DOI] [PubMed] [Google Scholar]
- 23.Barak-Shinar D, Amos Y, Bogan RK. Sleep disordered breathing analysis in a general population using standard pulse oximetry signals. Sleep Breath. 2013;17:1109–15. doi: 10.1007/s11325-013-0812-9. [DOI] [PubMed] [Google Scholar]
- 24.Amir O, Barak-Shinar D, Henry A, Smart FW. Photoplethysmography as a single source for analysis of sleep-disordered breathing in patients with severe cardiovascular disease. J Sleep Res. 2012;21:94–100. doi: 10.1111/j.1365-2869.2011.00927.x. [DOI] [PubMed] [Google Scholar]
- 25.Iber C, Ancoli-Israel S, Chesson A, Quan SF for the American Academy of Sleep Medicine. 1st ed. Westchester, IL: American Academy of Sleep Medicine; 2007. The AASM Manual for Scoring of Sleep and Associated Events: Rules, Terminology and Technical Specifications. [Google Scholar]
- 26.Berry RB, Brooks R, Gamalso CE, Harding SM, Marcus CL, Vaughn BV for the American Academy of Sleep Medicine. Darien, IL: American Academy of Sleep Medicine; 2012. The AASM Manual for Scoring of Sleep and Associated Events: Rules, Terminology, and Technical Specifications, Version 2.0. www.aasmnet.org. [Google Scholar]
- 27.Pellegrino R, Viegi G, Brusasco V, et al. Interpretative strategies for lung function tests. Eur Respir J. 2005;26:948–68. doi: 10.1183/09031936.05.00035205. [DOI] [PubMed] [Google Scholar]
- 28.Friedman M, Wilson MN, Pulver T, et al. Screening for obstructive sleep apnea/hypopnea syndrome: subjective and objective factors. Otolaryngol Head Neck Surg. 2009;142:531–5. doi: 10.1016/j.otohns.2009.12.038. [DOI] [PubMed] [Google Scholar]
- 29.Olivarez SA, Maheshwari B, McCarthy M, et al. Prospective trial on obstructive sleep apnea in pregnancy and fetal heart rate monitoring. Am J Obstet Gynecol. 2010;202:552.e1–7. doi: 10.1016/j.ajog.2009.12.008. [DOI] [PubMed] [Google Scholar]
- 30.Rechtschaffen A, Kales A. Los Angeles: Brain Information Service/Brain Research Institute, University of California; 1968. A Manual of Standardized Terminology, Techniques and Scoring System of Sleep Stages in Human Subjects. [Google Scholar]
- 31.Meyer TJ, Eveloff SE, Kline LR, Millman RP. One negative polysomnogram does not exclude obstructive sleep apnea. Chest. 1993;103:756–60. doi: 10.1378/chest.103.3.756. [DOI] [PubMed] [Google Scholar]
- 32.Brenner H, Geffler O. Variation of sensitivity, specificity, likelihood ratios and predictive values with disease prevalence. Stat Med. 1997;16:981–91. doi: 10.1002/(sici)1097-0258(19970515)16:9<981::aid-sim510>3.0.co;2-n. [DOI] [PubMed] [Google Scholar]
- 33.Parikh R, Parikh S, Arun E. Thomas R. Likelihood ratios: clinical application in day-to-day practice. Indian J Ophthalmol. 2009;57:217–21. doi: 10.4103/0301-4738.49397. [DOI] [PMC free article] [PubMed] [Google Scholar]
- 34.Collop NA, Tracy SL, Kapur V, et al. Obstructive sleep apnea devices for out-of center (OOC) testing: technology evaluation. J Clin Sleep Med. 2011;7:531–48. doi: 10.5664/JCSM.1328. [DOI] [PMC free article] [PubMed] [Google Scholar]


