Abstract
An optical fibre sensor has been implemented towards pyridine vapors detection; to achieve this, a novel vapochromic material has been used, which, in solid state, suffers a change in colour from blue to pink-white in presence of pyridine vapours. This complex is added to a solution of PVC (Poly Vinyl Chloride), TBP (Tributylphosphate) and tetrahydrofuran (THF), forming a plasticized matrix; by dip coating technique, the sensing material is fixed onto a cleaved ended optical fibre. The fabrication process was optimized in terms of number of dips and dipping speed, evaluating the final devices by dynamic range. Employing a reflection set up, the absorbance spectra and changes in the reflected optical power of the sensors were registered to determine their response. A linear relation between optical power versus vapor concentration was obtained, with a detection limit of 1 ppm (v/v).
Keywords: Fibre optic sensor, Pyridine vapors sensor, Vapochromic cobalt complex, Dip coating technique
1. Introduction
The detection of gaseous pollutants is an important aim in sensing technology, and is demanded in several applications, such as environmental monitoring, safety at work or food industry [1-3]. There is a wide range of industrial processes that have to handle with pure organic solvents, which in most cases are harmful for workers in high concentrations; sometimes, these vapors are even inflammable, so its concentration must be also monitorizated in order to avoid explosion risks. One example for these solvents is pyridine: this organic compound is widely used as reagent in organic chemistry and it is also needed in the synthesis of compounds such as insecticides, herbicides, pharmaceuticals, food flavorings, dyes, adhesives, paints, or explosives. This substance is harmful if inhaled, ingested or absorbed through skin. It is also known to reduce male fertility and is considered carcinogenic as well [4]. Common symptoms of exposure to pyridine include: headache, coughing, asthmatic breathing, laryngitis, nausea and vomiting [5]. Besides, foods exhale this compound when putrefaction processes begins [6], so its detection shows a great potential use in food industry.
A new solution for this kind of sensing environments is under investigation in the last decades, which is the development of fibre optic based sensors for gas [7-8] and organic vapors detection [9-10]. Although electronic technology already provides devices commercially available, they have to be biased to operate, and some of them need to be heated until 400 °C temperatures [11]. Thanks to their passive nature and electromagnetic interference immunity, fibre optic sensors are excellent solutions when working in industrial environments. Another important feature that fibre optic sensors offer is the possibility of multiplexing [12], which allows to couple in the fibre several signals from different sensors. Just to mention some more features of these sensors, they are light weight, small in size, minimally invasive and allow the remote use, among other ones.
The usual sensing scheme is based on a sensitive layer which is deposited onto the fibre; if this sensitive area is exposed to the target substance, it suffers a reversible change in its optical properties (fluorescence, refractive index, colour), and therefore, a detectable modulation of the light interacting with it [13]. In this work, a vapochromic cobalt complex is used as the sensing material. This substance changes its colour from blue to pink white in presence of pyridine vapors, and recovers it original colour when the vapors get vanished. A plastic polymeric matrix is used to fix this vapochromic material onto a cleaved ended optical fibre pigtail by dip coating technique. This method has been successfully used to develop chemical optical fibre sensors, and was also chosen because it is easy to implement and allows to control the thickness of the sensitive layer. In order to obtain a pyridine vapors reliable sensor, a study in terms of number of layers deposited onto the fibre and the dipping speed has been done. These parameters affect the final layer thickness, and hence, the molecule capture process at the interface gas-surface, which should produce a fast and easily detectable change in light that interacts with the sensitive area. Temperature and humidity cross sensitivity have been also evaluated, and finally, the response of the sensors has been studied yielding to a linear approximation between the change in the reflected optical power and the concentration of pyridine vapors.
2. Materials and instrumentation
In the following paragraphs, compounds and procedures employed to implement the sensor will be described, showing the experimental set up used in every case.
2.1. Vapochromic material
Vapochromic complexes have the ability of change their optical properties (colour) in presence of certain vapors [14]. This kind of materials has already been used to develop optical fibre sensors sensitive to volatile organic compounds in previous works [15-16]. In our case, the vapochromic material employed is the 1D complex β-Co(py)2Cl2. When blue-violet powder of this compound is under the presence of pyridine vapors, its colour changes to pink-white. Single crystals of the pink compound trans-[Co(py)4Cl2] were obtained by slow evaporation of pyridine solution of CoCl2.6H2O at 20 °C. Its structure consists of trans-[Co(py)4Cl2] molecules with four pyridine ligands bonded equatorially to the cobalt(II) ion through the nitrogen atoms whereas two chloride atoms are coordinated in axial positions. The coordination geometry of the cobalt(II) can therefore be considered as tetragonally distorted octahedral, CoN4Cl2.
When crystals of trans-[Co(py)4Cl2] are exposed to air, they lose pyridine, and because of this, their colour change instantaneously from pink to blue, due to the formation of the amorphous compound β-Co(py)2Cl2 at the surface of the crystalline material. The structure of the latter complex has been confirmed by powder X-ray diffraction methods.
Due to its chemical nature, the vapochromic complex also reacts in presence of other organic vapors, such as alcohols, amines or ammonia. In case of alcohols and some amines, the colour change is not such noticeable as in case of pyridine, and hence, these compounds can be discriminated by measuring the absorbance spectra; finally, when ammonia vapors were used, the colour change is not reversible because these vapors degrade rapidly the vapochromic complex.
2.2. Coating deposition process
In order to get the material fixed on the cleaved end fibre, the vapochromic complex is immobilized in a plasticized PVC polymeric matrix. This polymer (PVC) was chosen as the substrate for the sensing complex because is useful as a matrix material for analytical applications, thanks to its optical transparency, simplicity of preparation, good mechanical properties and homogeneity [17-19]. The mixture for the preparation of the vapochromic-sensitive layers was obtained from a batch of 80 mg of poly(vinyl chloride), 160 μl of tributylphosphate and 20 mg of vapochromic material dissolved in 2 ml of freshly distilled THF.
Standard multimode optical fibre pigtails (62.5/125 μm core/cladding diameters) have been used to implement the sensor heads. The procedure used for the deposition of the coatings was the dip coating technique, which has been already successfully used in sensor development in many earlier works [20-22]. The fabrication process of all the sensors implemented has some points in common, mainly the curing process used after each time the sensor head is dipped into the mixture; as PVC is present in this solution, a thermal curing is necessary in order to get it hardened and fixed onto the fibre. The curing process is also essential to evaporate all the organic solvents present in the solution [23], which could react with the pyridine vapors and eventually disguising the effect of the vapochromic material. Finally, the possibility that an already fixed layer could get solved when the sensor head is dipped again in the solution [23] is avoided. Other depositation techniques, such as Electrostatic Self-Assembly [24-25], can be used in further studies to have the sensing material deposited.
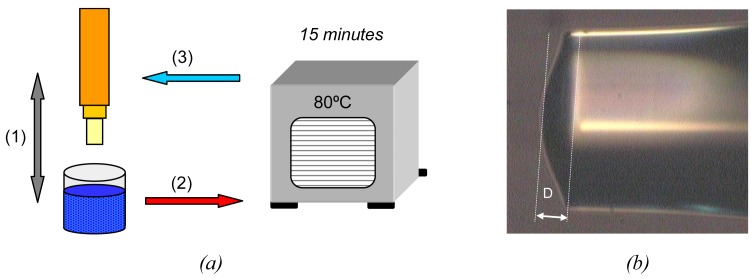
By placing the sensor head into an oven at 80°C for 15 minutes, the plastic solution matrix, where the vapochromic material is solved, gets transformed into a robust layer which shows a great adherence to the cleaved ended fibre and a considerable resistance to possible vibrations of the fibre or sharp movements. This process can be repeated as many times as layers to be deposited (figure 2.a). A detail of a sensor head can be observed in figure 2.b.
Figure 2.
(a) Summarized deposition process: (1) optical fibre dipping into the vapochromic complex solution, (2) curing at 80°C for 15 minutes, and (3) repeating as many times as layers to be deposited. (b) Zoomed image of a sensor head with 3 layers fixed at 40cm/min. The thickness of the final deposition is 22 μm.
2.3. Experimental set-up
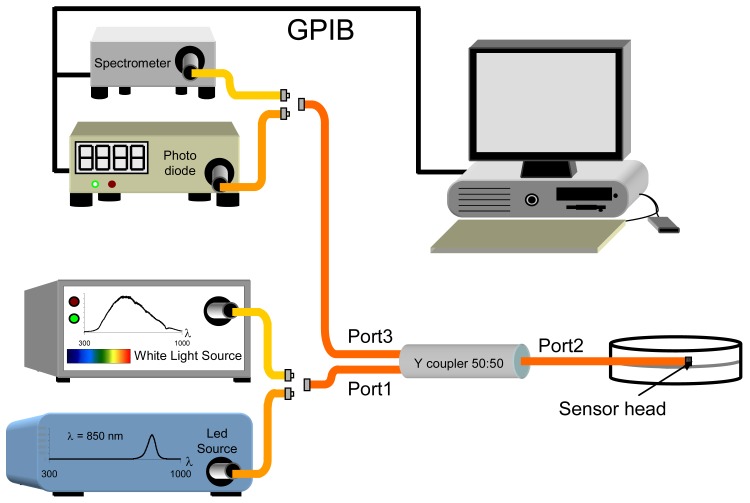
The experimental reflection set-up used is shown in figure 3. A directional 50:50 Y coupler is used to interconnect the optical system: the sensor head is connected to its port 2, and the other two ports are connected to an optical interrogating signal source (port 1) and to a photodetector (port 3); depending on the experiment performed, the interrogating signal can be obtained from either a white light source or a led at 850nm, and the optical detector can be either a photodiode or a spectrometer, respectively. This set up allows to evaluate the final sensor features in terms of changes in reflected optical power (led + photodiode) or absorbance spectra (white light source + spectrometer). Once the sensor heads are fabricated, they were placed into a chamber closed hermetically, where pyridine is injected in liquid state. As pyridine needs time to get vaporized, this makes difficult to know the response time due only to the vapochromic complex. In further studies, a vacuum system will be used, as in previous works [26].
Figure 3.
Experimental set up used. Fibres are represented in different colours, depending on the experiment (the optical coupler is always used): when the white light source and the spectrometer (light orange fibres), the absorbance is measured, whereas led and photo diode (golden fibres) are used to register changes in the reflected optical power at 850nm.
All the optical fibres and photonic devices employed in the set up have the same dimensions as the pigtails used for implementing the sensors (62.5μm / 125 μm, diameters of the core and cladding, respectively). Pigtails of these fibres were cut at one end using a Fujikura CT-20-12 precision fibre cleaver, and the vapochromic material was deposited onto the cleaved ended face of the fibre following the dip coating method.
As a reflection set-up, the interrogating signal reaches the interface between the cleaved ended fibre and the final sensitive layer, monitoring the reflected light by the photodetector or the spectrometer depending on the specific experiment. When the interrogating signal is centred at a wavelength, which is the case of a LED, the reflected optical power is determined by Fresnel's law [25-28]; if pyridine vapors produce a change in the refractive index of the layer, then the reflected optical power will change accordingly, and hence, the vapors could be detected. In case of employing a white light source and a spectrometer, information from the modulated light will be obtained in a wide range of wavelengths; if this variation curve is not flat in the range under study, this will provide information about a colour change of the final layer.
As this is an intensity based set up, the sensor response could be affected by drifts in the optical source, or by its degradation or replacement. Some alternatives can be used to prevent this, as other authors have proposed in others works: for example, the use of an optical fibre together with the sensor head to provide a referring signal. These solutions are susceptible of being used also in this work.
3. Optimization of pyridine sensors features
Pyridine vapors interact with the deposition by an adsorption process, so there is a tradeoff between the sensor response and the deposition thickness: a thin layer could produce a small change in the light, but if it is too thick, it could yield to a long absorption process, and so, a slow response time. Obviously, the number of layers determines the final deposition thickness, and the thickness of each layer depends on the dipping speed [23], so both parameters (number of layers and dipping speed) have to be optimized.
This study was based on two variables so, firstly, one of them was fixed and the other one was varied; this way, the dipping speed was established at 20 cm/min, and then, different sensors with different layers (from 1 to 5) were implemented. In all cases, the sensor heads where exposed to a pyridine vapor concentration of 66 ppm (v/v). After checking their absorbance spectra, they were characterized in terms of the evolution of the reflected optical signal. Later, the number of layers was fixed and a study for different dipping speeds was done. All measurements were made at a room temperature of 25°C and a relative humidity of 40%; the crosstalk of these environmental parameters was studied after the fabrication factors were optimized.
3.1. Study based on the number of layers
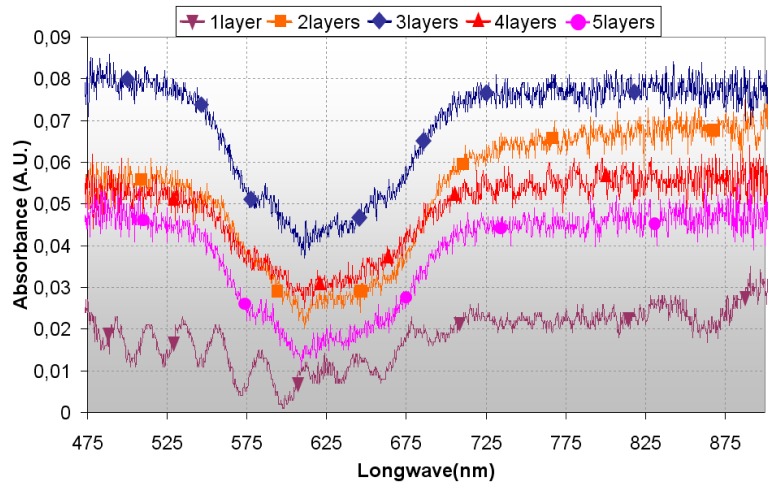
Following the fabrication process described above, sensors with a different number of deposited layers where implemented at a fixed dipping speed of 20cm/min. The first measure made to check if the vapochromic material was successfully fixed onto the cleaved ended fibre, was the absorbance spectra. For every case studied, the initial reference or baseline was set after the coating process, when the sensor was not exposed to pyridine vapors; the measurements of the absorbance spectra were recorded when it got stabilized in presence of the organic vapor concentration previously mentioned. To ensure that changes in absorbance spectra are produced by the vapochromic complex, a sensor was implemented depositing 3 layers of a non-doped PVC solution. When it was exposed to pyridine vapors, no variations were registered in the spectra, so it can be assumed that changes in the rest of measurements are due to the vapochromic complex presence.
As can be observed in figure 4, the shape of the spectra is similar in all sensors, but in the one layer sensor, where appears a ripple in the curve from 450 nm to almost 700 nm: this ripple is produced because with only one dip, the final layer is too thin and an interferometric cavity gets built between the fibre-layer and the layer-air interfaces masking the effects of the vapochromic material. This is not the case for the other curves, whose shape matches with a colour change from blue to pink-white. The fact that the highest magnitudes are for 2 and 3 dips, confirms that there is a tradeoff between the sensing capabilities of the sensor and the thickness of the layer deposited. With these measurements, it can be inferred that the change in the optical reflected power is produced by the vapochromic complex in almost all cases.
Figure 4.
Absorbance spectra for sensors with a different number of layers deposited, using a dipping speed of 20cm/min. In all cases, vapor concentration is 66 ppm (v/v).
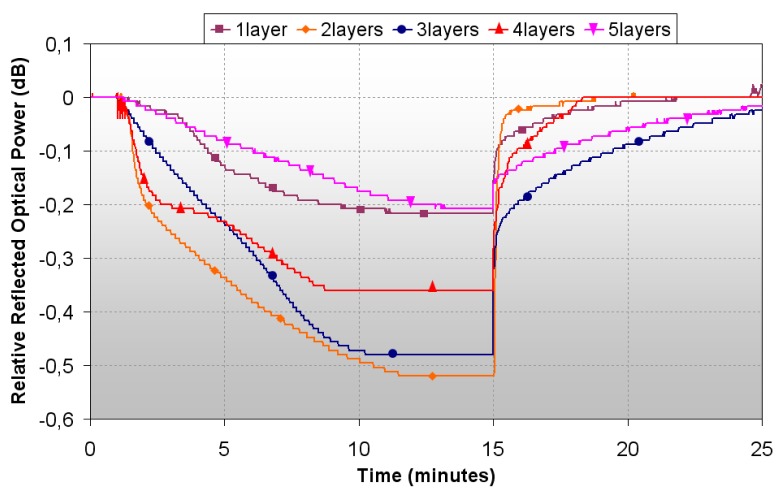
After this, the variation in reflected optical power was registered for all the sensors when exposed to pyridine vapors; as the response time of the sensors is also influenced by the evaporation time of the organic sensors, only dynamic range was used to evaluate the sensors response. Results obtained can be observed in figure 5, and are summarized in table 1.
Figure 5.
Optical Power Response by tuning the number of layers.
Table 1.
Parameters of the sensors developed with different number of layers, being the dipping speed fixed at 20 cm/min in all cases. Deposition thickness is calculated by image processing of captures of sensors heads from an optical microscope.
| Number of layers | Dynamic Range (dB) | Response Time (min) | Deposition Thickness (μm) |
|---|---|---|---|
| 1 | 0.22 | 3.66 | 7.71 |
| 2 | 0.52 | 0.33 | 13.25 |
| 3 | 0.48 | 7.40 | 19.30 |
| 4 | 0.36 | 2.52 | 29.18 |
| 5 | 0.21 | 8.25 | 34.51 |
It can be observed that, in some cases, the baseline is not perfectly recovered, although the drift is always below 0.05dB. In some studies, mainly in intensity based sensors, baseline drift is solved by post-processing procedures, which could be used in a system working with the fibre optic sensors described in this work [29].
The largest dynamic ranges are obtained for 2 and 3 dips: it is noticeable that the response of the sensor made with 5 dips is worst than the one with only 1 dip. It can be inferred that dipping more than three times yields into a not optimum sensitive layer, and below two, the response is neither good because there is not much vapochromic material in the sensor head. Anyway, for the two best sensors, the dynamic range is less than 1 dB, and their response time is around 7 minutes. So in order to obtain a reliable sensor, these factors have to be improved.
3.2. Study based on the dipping speed
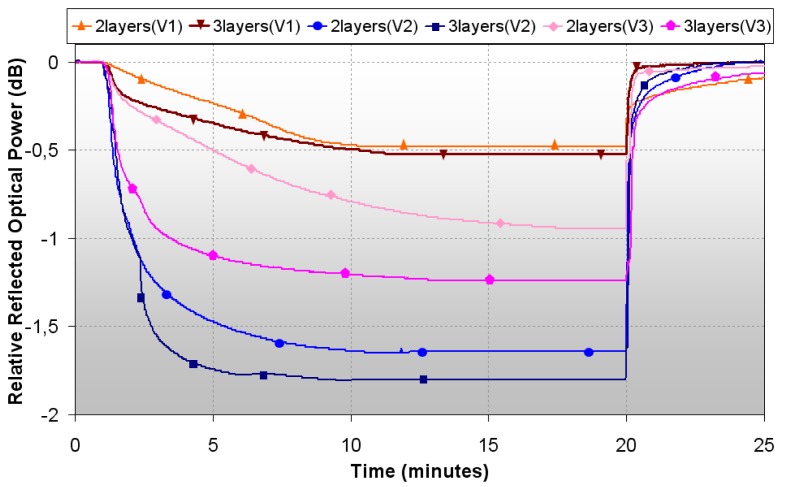
As the best results obtained for a dipping speed of 20cm/min were for sensors dipped 2 and 3 times, they were implemented again but at two different dipping speeds: 40cm/min and 60 cm/min. The final devices were checked in terms of the reflected optical power evolution versus time when they were exposed to pyridine vapors. The responses recorded are shown together with the ones of the sensors dipped at 20 cm/min in figure 6, and their main parameters are detailed in table 2.
Figure 6.
Reflected optical power of sensors with different number of layers and different dipping speeds (V1=20cm/min, V2=40cm/min, V3=60cm/min).
Table 2.
Parameters of the sensors developed with 2 and 3 layers and three different dipping speeds.
| Number of layers | 2 | 3 | ||||
|---|---|---|---|---|---|---|
| Speed (cm/min) | Dynamic Range (dB) | Response Time (min) | Deposition Thickness (μm) | Dynamic Range (dB) | Response Ti me (min) | Deposition Thickness (μm) |
| 20 | 0.52 | 7.18 | 13.25 | 0.48 | 6.75 | 19.30 |
| 40 | 1.64 | 3.81 | 19.75 | 1.80 | 2.23 | 22.00 |
| 60 | 0.94 | 10.25 | 23.37 | 1.24 | 4.11 | 26.58 |
It is obvious that there is an enhancement in the features for the two and three dips sensors if the dipping speed is higher. Moreover, there is an optimal speed for which the best results are obtained: when the process is made at 40 cm/s, the dynamic range improves from 0.52 dB to 1.62 dB in case of two dips, and from 0.48 dB to 1.78 dB for three dips, which is around 3.5 times the initial dynamic range in both cases. In terms of response time, both sensors are faster: for the sensor with two dips, response time is almost half the time obtained before, and for the other one, it is more than three times shorter.
The sensors developed with the fastest dipping speed have better features, in terms of dynamic range, than the ones obtained with the lowest speed, but are worse than the ones implemented with the medium speed. For the 2 layers based sensor, the dynamic range is reduced to 1.18 dB, although the greatest worsening is in response time, the longest registered for 2 dips, while the recovery time remains with almost no changes. In the case of the sensor dipped 3 times at 60cm/min, the dynamic range is lower than the one obtained at 40cm/min, and response time, just as recovery time, are also longer, but better than the ones obtained at the slowest dipping speed. As conclusion, the best parameters found to implement sensors for detection of pyridine vapors are 2 or 3 layers (dips) at a dipping speed of 40 cm/min.
3.4. Effects of humidity and temperature in the response of the sensor
Taking into account the previous reported results, the parameters chosen to develop the sensor heads were 3 layers deposited at a dipping speed of 40cm/min. After this, the influence of environmental parameters was studied as well. Using the same experimental set up, the response of the sensor at different temperatures and relative humidity was recorded, in terms of variations in reflected optical power (Led 850nm + photodiode), by introducing it into a climatic chamber.
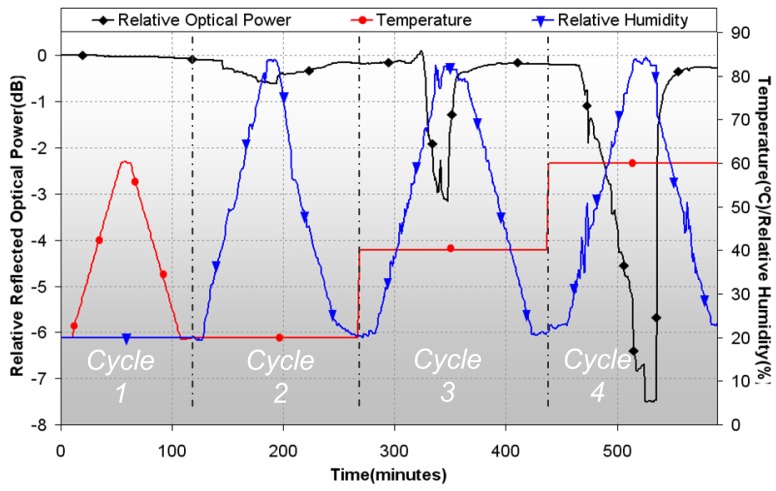
Four different cycles were used to evaluate the effects of temperature and humidity: cycle 1, with a constant relative humidity of 20% and increasing/decreasing temperature from 20°C to 60°C; cycle 2, cycle 3 and cycle 4 with respective constant temperatures of 20°C, 40°C and 60°C, with a variation in relative humidity from 20% to 80%, and then again to 20%. The parameters of these cycles are shown in figure 7, together with changes in reflected optical power.
Figure 7.
Effects on reflected optical power (left vertical axis) of the sensor suffered by interference of temperature and humidity (right vertical axis).
There are almost no variations in the response of the sensor in first cycle, so at low relative humidity, temperature does not interfere the response of the sensor; in the rest of the cycles, humidity does affect the response of the devices, being its effect stronger for higher temperatures, up to 7.5dB for 80% R.H. at 60°C (cycle 4). With these results, it is evident that temperature and humidity must be under control when using the sensors, avoiding values that could alter their response; another possibility is to measure also these factors, and compensate their contribution to sensor response by digital signal processing. In the rest of experiments, temperature and humidity were set to values where its interference is very low, specifically at 20°C and 40% respectively.
It is supposed that this effect can be superposed with the response produced by pyridine vapors, but, in further experiments, the effect of environmental conditions has to be studied in dynamic conditions when the sensor is in presence of pyridine vapors. When done, results will be published elsewhere.
4. Optimized sensor results and discussion
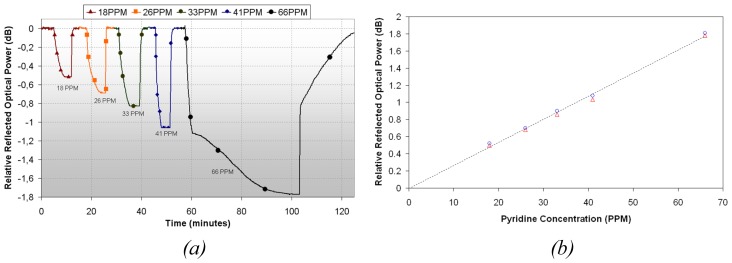
A 3 layers sensor deposited at a speed of 40cm/min has been exposed to different pyridine vapors concentrations, at a temperature of 25°C and 40% relative humidity. In figure 8.a, the time response of the sensor can be observed for 5 different concentrations: it is clear that the higher concentration, the higher optical power change (as shown in figure 8.a). With these results, a linear approximation relating optical power and vapor concentration can be estimated (see figure 8.b). Analytical performance characteristics were evaluated using the International Union of Pure and Applied Chemistry (IUPAC) method [30] and are summarized in table 3.
Figure 8.
(a) Time response of the sensor when exposed to different pyridine vapors concentrations. (b) Linear approximation of the sensor response.
Table 3.
Analytical performance characteristics for the linear approximation of the sensor: S0 is the standard deviation of the blank signal, and RSD is the relative standard deviation for an intermediate point of the calibration curve.
| Linear Aproximation Parameters | |
|---|---|
| Slope (dB/PPM) | 0.0269 |
| Intercept (PPM) | -0.0043 |
| Correlation Coefficient | 0.9966 |
| So (dB) | 0.0075 |
| Detection Limit (PPM) | 1 |
| RSD(%) | 0.75 |
Detection limit of this approximation is 1 ppm, which is below the exposition security limit of pyridine vapors (5 ppm) [5]; this shows that the device has a potential use in industries where workers are exposed to pyridine vapors, because it could monitories the concentration in real time and so, alert when the security limit is reached. The sensor has also been exposed to other organic vapors, obtaining in the worst case a cross interference equals to 5% for ethanol.
5. Conclusions
A sensor for pyridine vapors detection has been developed by dip coating technique, using a vapochromic cobalt complex. The implementation process is set to obtain the best dynamic range, optimizing the number of layers deposited and the dipping speed. The influence of temperature and humidity has been studied and can be compensated by signal processing. Final devices show a linear behaviour between changes in the output optical power and pyridine vapors concentration, having a detection limit which makes it acceptable for toxicity levels monitoring.
Figure 1.

Recognition mechanism and the chemical structure of the vapochromic species.
Acknowledgments
Financial support from the Spanish Comisión Interministerial de Ciencia y Tecnología within projects TEC2006-12170/MIC, TEC2004-05936-C02-01/MIC, BQU2001-3221, CTQ2005-09023 and Project of Excellence RNM666 de la Junta de Andalucía, is acknowledged.
References and Notes
- 1.Boilot P., Hines E.L., Gongora M.A., Folland R.S. Electronic noses inter-comparation, data fusion and sensor selection in discrimination of standard fruit solutions. Sensors and Actuators B. 2003;88:80–88. [Google Scholar]
- 2.Goschnick J., Koronczi I., Frietsch M., Kiselev Water pollution recognition with electronic nose Kamina. Sensors and Actuators B. 2005;106:182–186. [Google Scholar]
- 3.Brudzewski K., Osowski S., Markiewicz T. Classification of milk by means of electronic nose and SVM neural network. Sensors and Actuators B. 2004;98:291–298. [Google Scholar]
- 4.http://www.atsdr.cdc.gov/tfacts52.html
- 5.International Chemical Safety Cards; N° CAS 110-86-1
- 6.Gross G.A., Turesky R.J., Laurent B. F., Stillwell W.G., Skipper P.L., Tannenbaun S. R. Heterocyclic aromatic amine formation in grilled bacon, beef and fish and in grill scrapings. Carcinogenesis. 1993;14:2313–2318. doi: 10.1093/carcin/14.11.2313. [DOI] [PubMed] [Google Scholar]
- 7.Mandelis A., Garcia J.A. Pd:PVDF thin film hydrogen sensor based on laser-amplitude-modulated optical-transmittance: dependence on H2 concentration and device physics. Sensors and Actuators B. 1998;49:258–267. [Google Scholar]
- 8.Segawa H., Ohnishi E., Arai Y., Yoshida K. Sensitivity of fibre-optic carbon dioxide sensors utilizing indicator dye. Sensors and Actuators B. 2003;94:276–281. [Google Scholar]
- 9.Elosua C., Matias I.R., Bariain C., Arregui F.J. Volatile Organic Compund Optical Fibre Sensors: A Review. Sensors. 2006;6:1440–1465. [Google Scholar]
- 10.Steiner H., Staubmann K., Allabashi R., et al. Online sensing of volatile organic compounds in groundwater using mid-infrared fibre optic evanescent wave spectroscopy: a pilot scale test. Water Science And Technology. 2003;47(2):121–126. [PubMed] [Google Scholar]
- 11.Clifford P.K., Tuma D.T. Characteristic of semiconductor gas sensors I. Steady – state gas response. Sensors and Actuators. 1983;3:233–254. [Google Scholar]
- 12.Díaz S., Lasheras G., López-Amo M., Urquhart P., Jáuregui C., López-Higuera J. M. Wavelength-division-multiplexed distributed fibre raman amplifaier bus network for sensors. Proc. SPIE. 2005;58855:242–244. [Google Scholar]
- 13.Wolfbeis O. S. Fibre Optic Chemical Sensors and Biosensors. Anal. Chem.(Wash.) 2004;76:3269–3283. doi: 10.1021/ac040049d. [DOI] [PubMed] [Google Scholar]
- 14.Nagel C.C. Preparation of vapochromic double complex salts. European Patent Application EP. 1998:277003. [Google Scholar]
- 15.Casado S., Elosúa C., Bariáin C., Segura A., Matías I.R., Fernández A., Luquin A., Garrido J., Laguna M. A volatile-organic compound optic fibre sensor using a gold-silver vapochromic complex. Optical Engineering. 2005;45(4):044401. [Google Scholar]
- 16.Bariain C., Matías I.R., Romero I., Garrido J., Laguna M. Detection of volatile organic compound vapors by using a vapochromic material on a tapered optical fibre. Appl. Phys. Lett. 2000;77(15):2274–2276. [Google Scholar]
- 17.Ertekin K., Tepe M., Yenigül B., Akkaya E.U., Henden E. Fibre optic sodium and potassium sensing by using a newly synthesized squaraine dye in PVC matrix. Talanta. 2002;58(4):719–727. doi: 10.1016/s0039-9140(02)00329-6. [DOI] [PubMed] [Google Scholar]
- 18.Kurochkin V.E., Makaraova E.D. Reflectance spectrophotometry of plasticized membranes for the design of fast optical chemosensors. Analytical Communications. 1996;33:115–116. [Google Scholar]
- 19.Malins C., Landl M., Simon P., MacCraith B.D. Fibre optic ammonia sensing employing novel infrared dyes. Sensors and Actuators B. 1998;51:359–367. [Google Scholar]
- 20.Hewak D.W., Lit J.W.Y. Standardization and control of a dip-coating procedure for optical thin films prepared from solution. Can. J. Phys. 1988;66:861–867. [Google Scholar]
- 21.Bariáin C., Matías I. R., Fdez-Valdivielso C., Elosúa C., Luquin A., Garrido J., Laguna M. Optical fibre sensors based on vapochromic gold complexes for environmental applications. Sensors and Actuators B. 2005;108:535–541. [Google Scholar]
- 22.Bariáin C., Matías I.R., Fernández-Valdivielso C., Arregui F.J., Rodríguez Méndez M.L., de Saja J.A. Optical fibre sensor based on lutetium bisphthalocyanine for the detection of gases using standard telecommunication wavelengths. Sensors and Actuators B. 2003:153–158. [Google Scholar]
- 23.Arregui F.J., Otano M., Fdez-Valdivielso C., Matías I.R. An experimental study about the utilization of Liquicoat® solutions for the fabrication of pH optical fibre sensors. Sensors and Actuators B. 2002;87(2):291–297. [Google Scholar]
- 24.Elosúa C., Bariáin C., Matías I. R., Arregui F. J., Luquin A., Laguna M. Volatile alcoholic compunds fibre optic nano sensor. Sensors and Actuators B. 2006;115:444–449. [Google Scholar]
- 25.Elosua C., Matias I.R., Bariain C., Arregui F.J. Development of an In-Fibre Nanocavity Towards Detection of Volatile Organic Gases. Sensors. 2006;6:578–592. [Google Scholar]
- 26.Giordano M., Russo M., Cusano A., Mensitieri G. An high sensitivity optical sensor for chloroform vapours detection base don nanometric film of d-form syndiotactic polystyrene. Sensors and Actuators B. 2005;107:140–147. [Google Scholar]
- 27.Kubelka P., Munk F. Ein Beitrag zur Optik der Farbanstriche. Zeitschrift für technische Physik. 1931;12:593–601. [Google Scholar]
- 28.Arregui F.J., Liu Y., Matias I.R., Claus R.O. Optical fibre humidity sensor using a nano Fabry–Perot cavity formed by the ionic self-assembly method. Sensors and Actuators B. 1999;59:54–59. [Google Scholar]
- 29.Christie S., Scorsone E., Persaud K., Kvasnik F. Remote detection of gaseous ammonia using near infrared transmission properties of polyaniline. Sensors and Actuators B. 2003;90:163–169. [Google Scholar]
- 30.IUPAC Nomenclature, symbols, units and their usage in spectrochemical analysis-II. Data interpretation. Spectrochim. 1978;33B:242–248. [Google Scholar]


