Abstract
This paper presents Finite-Difference Time-Domain, FDTD calculations of SAR in the University of Florida newborn female model. The newborn model is based upon a surface representation of the organs of the body, using non-uniform rational B-spline surfaces, NURBS. The surface model can then be converted into voxels at any resolution required. This flexibility allows the preparation of voxel models at 2-, 1- and 0.5 mm to investigate the effect of resolution on dispersion and the choice of SAR averaging algorithms as the frequency increases up to 6 GHz. The added advantage of the newborn model is that it is relatively small and so FDTD calculations can be made tractable at the very fine resolution of 0.5 mm. A comparison is made between the calculated external electric fields required to produce the basic restriction on whole-body averaged SAR and the ICNIRP reference levels for public exposure. At 250 MHz, the whole body resonance, the ICNIRP reference level does not provide a conservative estimate of the whole-body averaged SAR restriction. The reference level is also breached in the range 700 to 2450 MHz by all of the irradiation geometries considered.
1. Introduction
A previous set of calculations (Dimbylow and Bolch 2007) investigated the specific-energy absorption rate, SAR in child voxel models for plane wave exposure from 50 MHz to 4 GHz. This work was performed on the University of Florida, UF Series B paediatric phantoms (Lee et al 2005, 2006). This series includes a 9-month male, a 4-year female, an 8-year female, an 11-year male and a 14-year male. These paediatric phantoms were developed for medical and radiation protection photon dosimetry and were adapted for electromagnetic field calculations. The International Commission on Non-Ionizing Radiation Protection, ICNIRP provide guidelines for limiting exposure to time-varying electric, magnetic and electromagnetic fields (ICNIRP 1998). The paediatric study showed that above ~1 GHz, the ICNIRP reference level does not provide a conservative estimate of the whole-body averaged SAR restriction for children younger than 8 years, i.e. shorter than ~1.3 m. This problem with the application of the ICNIRP public reference level to children has also been investigated by the recent studies of Conil et al (2008), Findlay et al (2009), Hirata et al (2009), Nagaoka et al (2008) and Wang et al (2006). In the region above 1 GHz, the calculations with the UF set of child models show that the external field values, required to produce the whole-body averaged restriction on SAR, decreased (i.e. became more restrictive) with diminishing age. Therefore, it would seem likely that calculations with a newborn model could possibly be even more restrictive and provide the limiting case in this frequency range.
This paper presents Finite-Difference Time-Domain, FDTD calculations of SAR in the University of Florida newborn female model (Lee et al 2007). A comparison is made between the calculated external electric fields required to produce the basic restriction on whole-body averaged SAR and the ICNIRP reference levels for public exposure. The newborn model is based upon a surface representation of the organs of the body, using non-uniform rational B-spline surfaces, NURBS. The surface model can then be converted into voxels at any resolution required. This flexibility allows the preparation of voxel models at 2-, 1- and 0.5 mm to investigate the effect of resolution on dispersion and the choice of SAR averaging algorithms as the frequency increases up to 6 GHz. The added advantage of the newborn model is that it is relatively small and so FDTD calculations can be made tractable at the very fine resolution of 0.5 mm.
2. Newborn voxel model
2.1 University of Florida newborn NURBS Phantoms
Voxel phantoms have been developed through segmentation of medical images and provide anatomically realistic models. However, they can limited in defining organs presented in low contrast. By definition, voxel phantoms are typically constructed via segmentation of transaxial images, and thus while fine anatomical features are seen in this viewing plane, slice-to-slice discontinuities become apparent in viewing the anatomy of voxel phantoms in the sagittal or coronal planes. Non-uniform rational B-spline surfaces, NURBS a mathematical modelling tool traditionally applied to graphical animation studies was adopted to produce a surface representation of a newborn child. The construction of a hybrid phantom is performed in three steps: polygonisation of the voxel phantom, organ modelling via NURBS surfaces and phantom voxelisation. Two 3D graphic tools, 3D-DOCTOR™ and Rhinoceros™, were utilized to polygonise the newborn voxel phantom and generate NURBS surfaces, while an in-house MATLAB™ code was used to voxelise the resulting NURBS model into a final computational phantom ready for the electromagnetic field calculations. A total of 126 anatomical organ and tissue models, including 38 skeletal sites and 31 cartilage sites, were described within the hybrid phantom using either NURBS or polygon surfaces. A male hybrid newborn phantom was constructed following the development of the female phantom through the replacement of female-specific organs with male specific organs. The outer body contour and internal anatomy of the NURBS based phantoms were adjusted to match anthropometric and reference newborn data reported by the International Commission on Radiological Protection in their Publication 89 (ICRP 2002). The voxelisation process was designed to accurately convert NURBS models to a voxel phantom with minimum volumetric change.
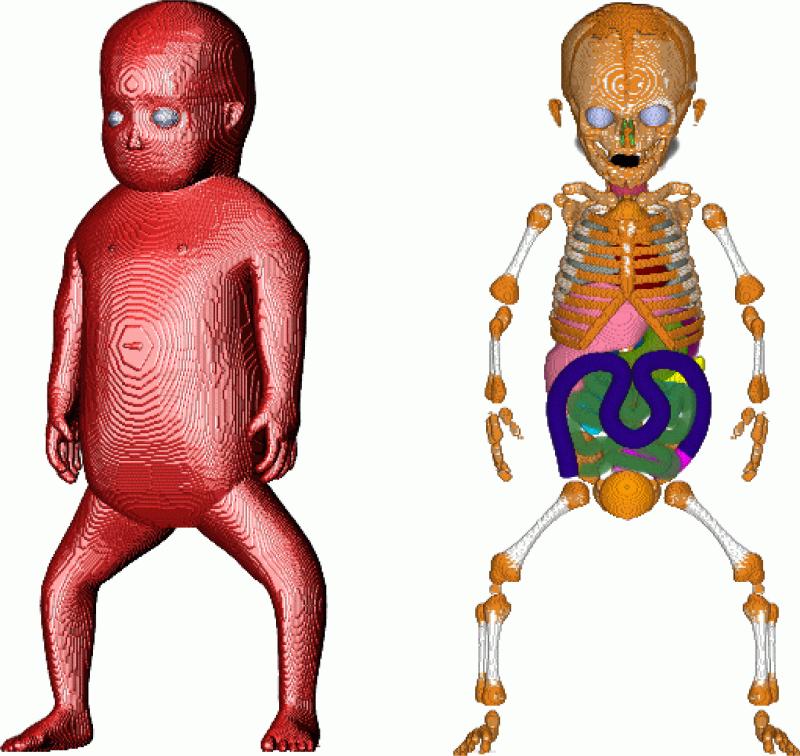
The height of the model is 48.7 cm with a mass of 3500 g. At 2 mm resolution the domain size is 58 × 120 × 243 which is ~ 1.7 MVox (mega-voxels). The corresponding domains at 1- and 0.5 mm are 8 and 64 times bigger, respectively. At 0.5 mm the domain size is ~ 108 MVox. Figure 1 displays volume rendered images of the 1 mm resolution newborn female model used in the FDTD calculations.
Figure 1.
Volume rendered images of the newborn female model. In the image on the left the opacity of the skin has been set to 100 % and a lighting source applied. In the image on the right the skin, fat and muscle have been made transparent.
2.2 Phantom modifications
The UF phantoms were developed originally for studies in ionising radiation dosimetry. A few additional modifications were made for specifically looking at the interaction of electromagnetic fields with the body. The skeletal sites were grouped together as one tissue and so were the cartilage sites. In the adult the eye wall thickness is ~1 mm at the posterior pole, 0.3 – 0.4 mm at the equator and 0.6 mm at the edge of the cornea. In the newborn these thicknesses will be much less, i.e. too thin to model, therefore the eye was treated solely as humour and lens. The background tissue in which the organs are located is not differentiated into muscle and fat. In electromagnetic field dosimetry it is important to make this distinction because of the markedly different dielectric properties of muscle and fat. In a similar way to the method to the conversion of the RPI-P pregnant female models (Dimbylow et al 2009), successive layers of background tissue were converted to fat working from the skin inwards. From ICRP (2002) the skeletal muscle in the newborn child is 800 g out of a total body mass of 3500 g. Adipose tissue is 930 g of which 890 g is separable. At 2 mm resolution, 5 layers of subcutaneous fat give 928 g of fat and a total body mass of 3335.5 g compared with the reference mass of 3500 g. Because fat has a specific gravity of 0.92 c.f. 1.04 of muscle, replacing muscle by fat will lower the mass of the body which in turn will affect the SAR. To allow a comparison with a homogeneous background tissue, the density of fat was set to that of muscle. This will give a mass if 3457 g. A further small density correction was then applied to all the tissues to make the body mass 3500 g exactly.
3. SAR calculations
3.1. Dielectric properties of newborn model
An evaluated review of the dielectric properties of all the tissue types in the adult body was performed by Gabriel (1995, 1996a-c). A 4-Cole-Cole dispersion model was fitted to the data for each tissue type to parameterise the conductivity and permittivity as a function of frequency. However, the dielectric properties of tissue vary as a function of age due to the decrease of water content. Peyman et al (2001) investigated changes in the dielectric properties of rat tissue as a function of age at microwave frequencies. In that paper the dielectric properties of 10 rat tissues, namely skull, brain, skin, muscle, salivary glands, liver, spleen, tongue, kidney and tail were measured at 6 different ages in the frequency range 130 MHz to 10 GHz. A single pole Cole-Cole fit was made to the data. The parameters they derived have been used here to calculate the newborn and adult properties (except for the tail). The highest ratios are for skull and skin. The values for the other 7 tissues are more similar to each other. The ratios at 250 MHz, the whole-body resonance frequency, were used to multiply the Gabriel adult values to obtain newborn dielectric properties in this study. Bone and skin were treated as special cases and the average ratios of the other 7 tissues were used for the remaining soft tissues of the body, except those tissues whose properties would not change with age, i.e. air, bile, csf, blood, urine and humour. The conductivity multipliers were 3.9, 2.2 and 1.5 for bone, skin and soft tissues, respectively. The permittivity multipliers were 2.2, 1.9 and 1.25 for bone, skin and soft tissues.
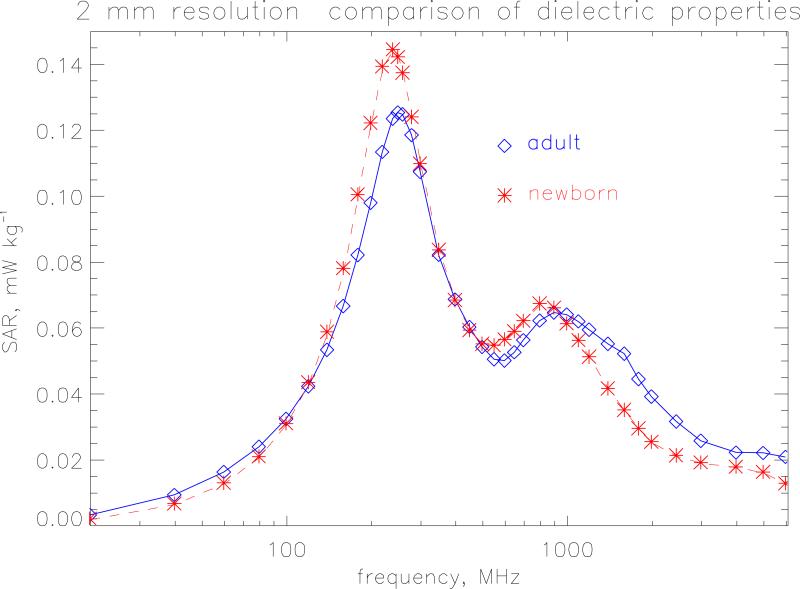
The FDTD method (Taflove, 1995) has been used extensively to calculate the whole-body averaged SAR in voxel phantoms of the human body (see e.g. Dimbylow 1997, 2005; Findlay et al 2006). Details of the method can be found in those papers. The FDTD calculations were made on the female newborn model, for plane wave irradiation under isolated conditions, using a 64-processor Beowulf cluster. Sixteen processors were employed for the 2 mm resolution calculations increasing to 64 processors for the 0.5 mm calculations. Figure 2 compares the whole-body averaged SAR using the adult dielectric parameters with those using the newborn parameters from 20 MHz to 6 GHz. The resolution of the model is 2 mm and AP irradiation is considered, i.e. from the front with the electric field component aligned vertically, for isolated conditions. This would be equivalent to a horizontal electric field for irradiation from above if the newborn child is lying down on its back. The whole-body resonance occurs at 240 MHz. The height of the model (with legs bent) is 0.486 m which is equivalent to 0.39 of the wavelength, λ at 240 MHz. This relationship between resonant frequency and height is in accord with previous results (see e.g. Dimbylow and Bolch 2007). There is a secondary resonance at ~800 MHz to which absorption in the legs is the main contributor. The newborn properties give a 15 % higher value at whole-body resonance than the adult properties. The values are comparable at 800 MHz but at higher frequencies the adult properties produce higher values. The newborn dielectric properties are used in the rest of paper.
Figure 2.
Whole-body averaged SAR calculated at a resolution of 2 mm under isolated conditions. The incident electric field is 1 V m−1 (r.m.s.).
3.2. SAR algorithms
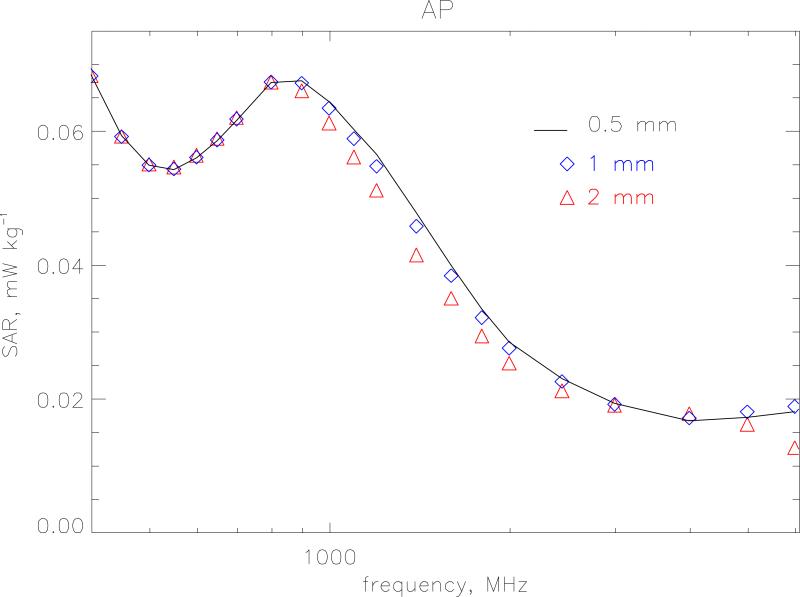
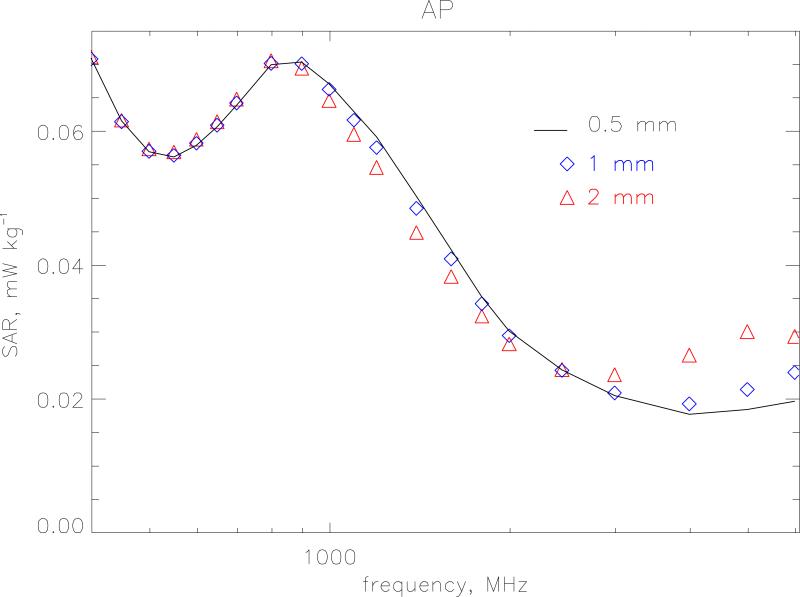
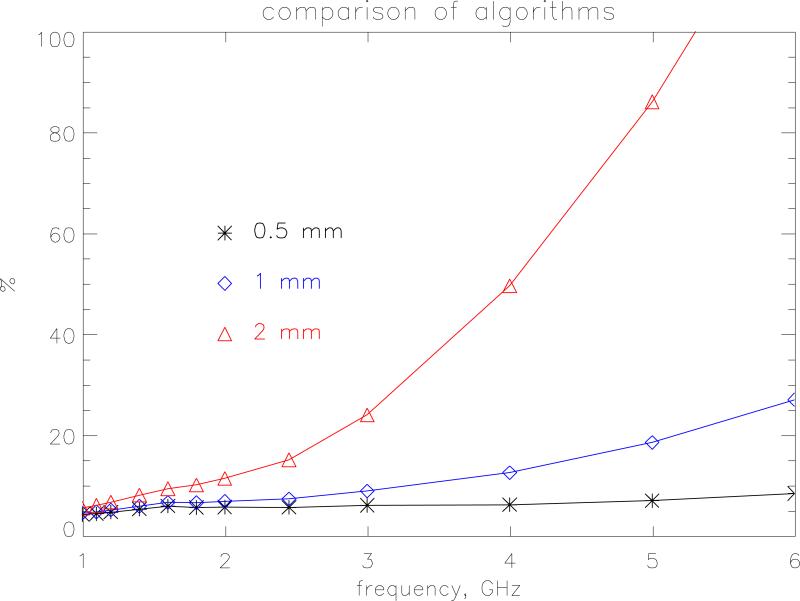
The small size of the newborn phantom makes it a suitable test bed to look at the effects of resolution and choice of SAR algorithms at high frequencies. The FDTD method follows the time evolution of a field interacting with the body divided into a regular grid. To obtain an adequate sampling of the waveform, the size of the grid step-length should be less than λ/10 where λ is the wavelength in the particular tissue. Resolution is also tied in with the accuracy of the algorithms used to calculate SAR in a voxel. The standard way the HPA code calculates SAR is as follows. At each time step the average of Ex (and Ey and Ez) is calculated from the 4 edges of the Yee cell to obtain the field components at the centre of the voxel. These components are then squared and summed to produce |E2| at that time step. The maximum value of this quantity is then sought over a half-period of the wave to produce the SAR for that voxel. Let this method be denoted algorithm A. Alternatively, the maximum absolute value of Ex, Ey and Ez can be calculated separately at all voxel edges over a half-period and then the SAR is constructed afterwards in each voxel. This latter method will provide a conservative estimate because it makes the approximation that all the three field components are in phase. This conservative method is denoted as algorithm C. Figures 3 and 4 show the whole-body averaged SAR calculated using algorithms A and C, respectively for model resolutions at 2-, 1- and 0.5 mm. for AP irradiation. The 1 mm model has 10 layers of subcutaneous fat and 2 layers of skin and the 0.5 mm model has 20 layers of subcutaneous fat and 4 layers of skin to enable direct comparison between the different resolutions. One would expect that as the step size increases the maximum frequency at which it could be applied would decrease. For algorithm A, a resolution of 2 mm agrees with the very fine 0.5 mm calculations within 1 % up to 1 GHz. Between 1 and 2 GHz the 2 mm values are lower with a maximum difference of 13 % at 1400 MHz. At 6 GHz the 2 mm resolution values are 30 % too low. The 1 mm resolution calculations as expected agree much better and are within 1 % up to 1 GHz and within 4 % up to 6 GHz. Algorithm C displays a greater divergence at the highest frequencies. The 2 mm and 1 mm values are 50 % and 20 % too high, respectively at 6 GHz. As well as this relative difference with resolution algorithm C also produces values that are absolutely higher than those produced by the standard algorithm, A. Figure 5 displays the overestimate of algorithm C compared to the standard method for the various resolutions. As the step size and frequency increase the overestimate becomes more pronounced. At 1 mm it is 10 % at 3 GHz and 27 % at 6 GHz. At 2 mm this rises to 24 % at 3 GHz and 130 % at 6 GHz.
Figure 3.
Whole-body averaged SAR calculated using algorithm A for model resolutions at 2-, 1- and 0.5 mm. The irradiation geometry is AP under isolated conditions and the incident vertical electric field is 1 V m−1 (r.m.s.).
Figure 4.
Whole-body averaged SAR calculated using algorithm C for model resolutions at 2-, 1- and 0.5 mm. The irradiation geometry is AP under isolated conditions and the incident vertical electric field is 1 V m−1 (r.m.s.).
Figure 5.
The percentage overestimate of algorithm C compared to the standard method for the whole-body averaged SAR at resolutions of 2-, 1- and 0.5 mm. The irradiation geometry is AP under isolated conditions and the incident vertical electric field is 1 V m−1 (r.m.s.).
Algorithm C will provide this conservative estimate because it makes the approximation that all the three field components are in phase. As a simplified numerical example, consider the 1D case. The induced electric fields at the cell nodes, x and x+Δ are
The average field at time t, in the cell using algorithm A will be
The SAR is taken from an integral over a period
The integral value for algorithm A is IA = [a2 + b2 + 2ab cosϕ] /8.0 In algorithm C the integral is evaluated separately at x and x +Δ and then the averaged taken to obtain
Algorithm C will over-read by the ratio, R
The phase difference between successive nodes should be φ = Δ / λ = [Δ f √ε / c], where ε is the tissue permittivity. Using Δ = 2 mm and setting ε to be the average over the body, then the phases between nodes at 3 and 6 GHz are 42 ° and 80.3 ° resulting in overestimates of 1.15 and 1.71 respectively. These values, from the simple argument about how phase effects the predictions of the two algorithms, are comparable with the calculated ratios for the newborn model.
3.3. Whole-body averaged SAR calculation
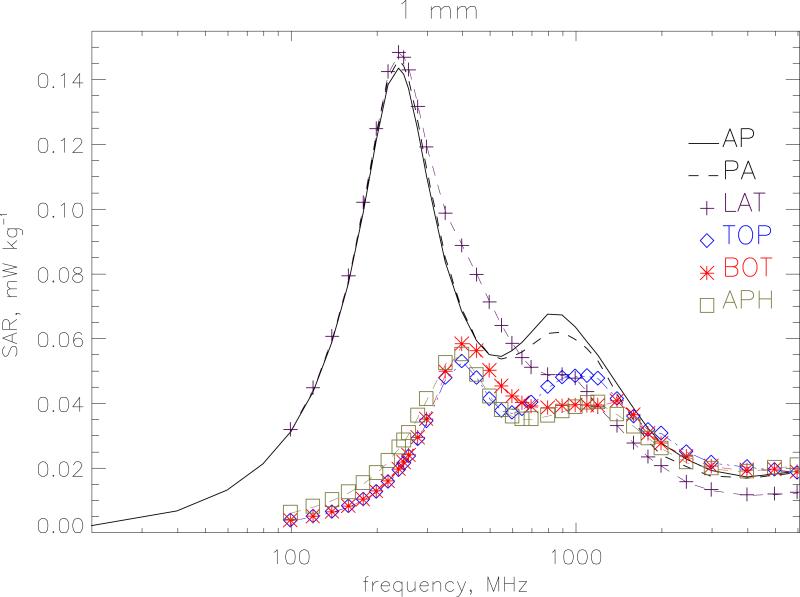
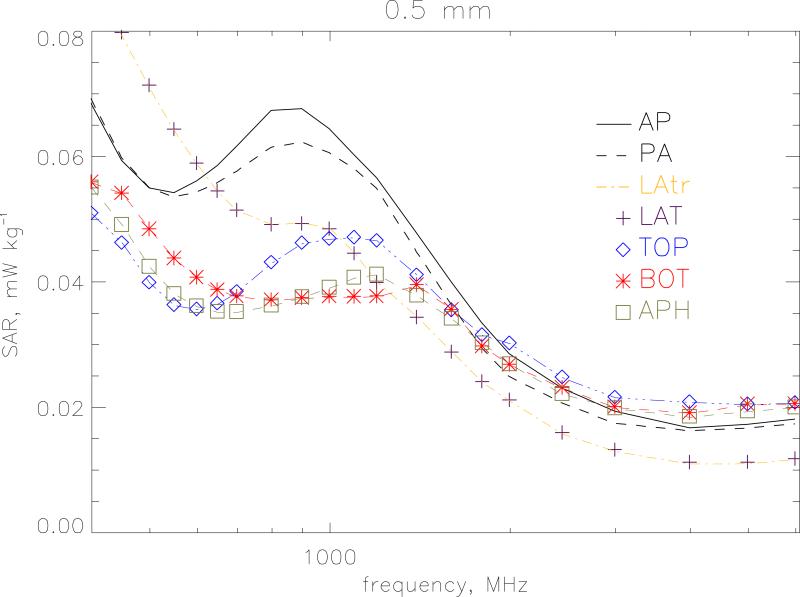
Figure 6 displays the whole-body averaged SAR for different polarisations at a resolution of 1 mm. Vertical polarisation of the electric field is considered for irradiation from front-to-back(AP), from back-to-front (PA) and from left-to-right (LAT). Irradiation from right-to-left (LATr) produces almost identical results to LAT and is not shown. These 3 geometries with a vertical electric field show similar shape and magnitude through the whole-body resonance. but the irradiations from the side do not exhibit the secondary resonance at 900 MHz. Horizontal polarisation of the electric field from side-to-side is considered for irradiation from topto-bottom (TOP), from bottom-to-top (BOT) and from front-to-back (APH). Here the main resonance occurs at 400 MHz when the lateral dimensions of the body are ~0.4 λ. Figure 7 gives a similar plot for 0.5 mm resolution at the higher frequencies from 400 MHz to 6 GHz. AP irradiation gives the highest value at the secondary resonance. The shape for PA irradiation is similar to AP but lower in magnitude above ~500 MHz. Above 2 GHz, the APH, BOT and TOP conditions which have the electric field vector aligned from side to side give higher values than AP. Table 1 gives the whole-body averaged SAR values for the 7 irradiation geometries. The values are the maximum of the 1 mm and 0.5 mm calculations.
Figure 6.
Whole-body averaged SAR for different polarisations at a resolution of 1 mm. Vertical polarisation of the electric field is considered for irradiation from front-to-back (AP), from back-to-front (PA) and from left-to-right (LAT). Horizontal polarisation of the electric field from side-to-side is considered for irradiation from top-to-bottom (TOP), from bottom-to-top (BOT) and from front-to-back (APH). The model is under isolated conditions and the electric field is 1 V m−1 (r.m.s.).
Figure 7.
Whole-body averaged SAR for different polarisations at a resolution of 0.5 mm from 400 MHz to 6 GHz. Vertical polarisation of the electric field is considered for irradiation from front-to-back (AP), from back-to-front (PA), from left-to-right (LAT) and from right-to-left (LATr). Horizontal polarisation of the electric field from side-to-side is considered for irradiation from top-to-bottom (TOP), from bottom-to-top (BOT) and from front-to-back (APH). The model is under isolated conditions and the electric field is 1 V m−1 (r.m.s.).
Table 1.
Whole-body averaged SAR values. The values are the maximum of the 1 mm and 0.5 mm calculations.
| frequency (MHz) | SAR (μW kg−1) for 1 V m−1 (r.m.s.) | ||||||
|---|---|---|---|---|---|---|---|
| AP | PA | LAT | LATr | TOP | BOT | APh | |
| 20 | 1.92 | ||||||
| 40 | 6.52 | ||||||
| 60 | 13.0 | ||||||
| 80 | 21.1 | ||||||
| 100 | 30.8 | 30.8 | 31.6 | 31.6 | 3.71 | 3.68 | 6.10 |
| 120 | 43.2 | 43.2 | 44.6 | 44.6 | 4.97 | 4.93 | 8.01 |
| 140 | 58.6 | 58.7 | 60.5 | 60.6 | 6.33 | 6.29 | 10.0 |
| 160 | 76.7 | 76.9 | 79.2 | 79.4 | 8.07 | 8.02 | 12.4 |
| 180 | 98.7 | 99.2 | 102 | 102 | 10.2 | 10.2 | 15.2 |
| 200 | 121 | 122 | 125 | 125 | 12.6 | 12.6 | 18.3 |
| 220 | 138 | 140 | 142 | 143 | 15.6 | 15.7 | 22.1 |
| 240 | 143 | 146 | 148 | 149 | 19.3 | 19.5 | 26.2 |
| 250 | 141 | 144 | 147 | 148 | 21.3 | 21.5 | 28.4 |
| 260 | 137 | 140 | 143 | 144 | 23.5 | 23.8 | 30.7 |
| 280 | 124 | 127 | 131 | 132 | 28.8 | 29.3 | 36.1 |
| 300 | 110 | 113 | 119 | 119 | 34.3 | 34.9 | 41.2 |
| 350 | 83.4 | 84.8 | 98.5 | 98.0 | 47.7 | 49.6 | 52.4 |
| 400 | 68.4 | 69.1 | 88.5 | 88.0 | 52.8 | 58.2 | 55.0 |
| 450 | 59.3 | 59.6 | 79.6 | 79.1 | 47.7 | 56.0 | 49.0 |
| 500 | 54.8 | 54.9 | 71.2 | 70.8 | 41.2 | 49.9 | 42.4 |
| 550 | 54.2 | 53.4 | 64.2 | 64.0 | 37.6 | 45.2 | 38.0 |
| 600 | 56.0 | 54.2 | 58.8 | 58.7 | 36.9 | 42.0 | 36.1 |
| 650 | 58.6 | 55.7 | 54.3 | 54.3 | 38.1 | 39.9 | 35.2 |
| 700 | 61.7 | 57.5 | 51.3 | 51.3 | 40.2 | 38.9 | 35.2 |
| 800 | 67.2 | 61.3 | 49.0 | 49.2 | 44.9 | 38.4 | 36.2 |
| 900 | 67.5 | 62.1 | 49.2 | 49.4 | 47.8 | 39.0 | 37.5 |
| 1000 | 64.3 | 60.5 | 48.3 | 48.5 | 48.3 | 39.3 | 39.0 |
| 1100 | 60.2 | 58.0 | 44.4 | 44.6 | 48.3 | 39.2 | 40.6 |
| 1200 | 56.4 | 54.8 | 39.8 | 40.0 | 47.5 | 39.2 | 41.1 |
| 1400 | 47.7 | 44.7 | 34.3 | 34.4 | 41.3 | 40.6 | 37.7 |
| 1600 | 39.9 | 36.3 | 28.7 | 28.8 | 35.8 | 36.3 | 34.1 |
| 1800 | 33.3 | 29.3 | 24.0 | 24.0 | 31.7 | 30.4 | 30.2 |
| 2000 | 28.4 | 24.8 | 21.0 | 21.0 | 30.6 | 27.4 | 26.8 |
| 2450 | 22.9 | 20.6 | 15.9 | 15.7 | 24.9 | 23.4 | 22.1 |
| 3000 | 19.2 | 17.3 | 13.1 | 13.0 | 21.5 | 20.4 | 19.8 |
| 4000 | 17.0 | 16.6 | 11.5 | 11.4 | 20.8 | 19.2 | 18.8 |
| 5000 | 18.0 | 17.5 | 11.8 | 11.8 | 20.4 | 20.4 | 20.0 |
| 6000 | 18.8 | 18.2 | 12.3 | 12.3 | 20.7 | 20.5 | 20.8 |
3.4. Comparison with guidelines
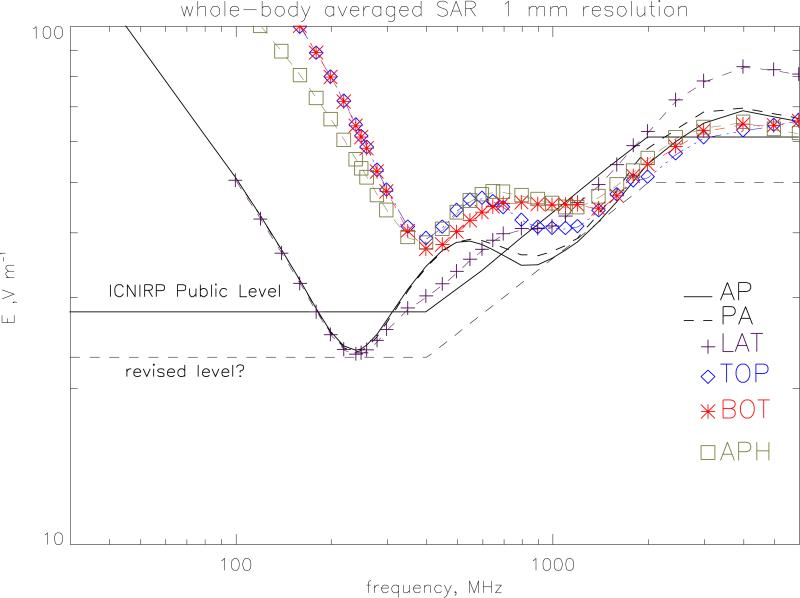
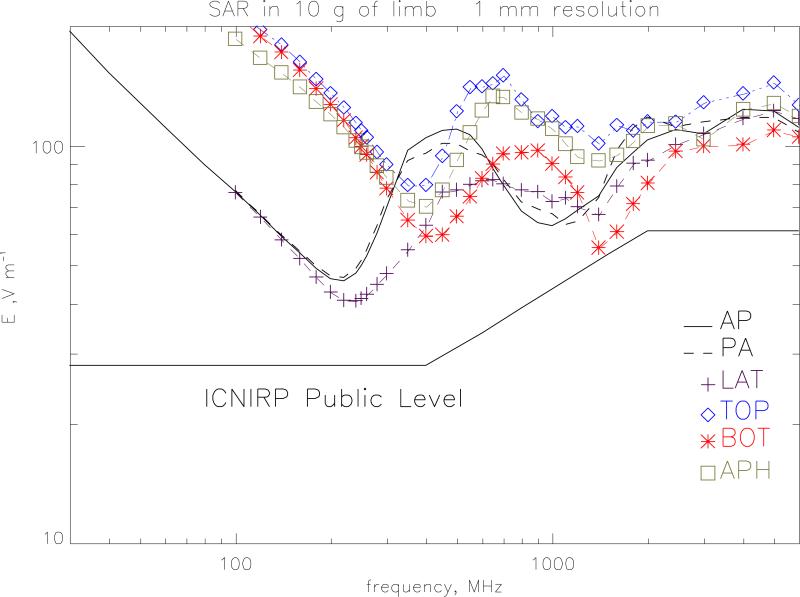
Figure 8 plots the electric field values required to produce the ICNIRP (1998) public exposure restrictions on whole-body averaged SAR of 0.08 W kg−1. At 250 MHz, the whole body resonance, LATr irradiation gives a value of 23.2 V m−1 compared to the ICNIRP reference level of 28 V m−1 and so in this region the reference level does not provide a conservative estimate of the whole-body averaged SAR restriction. The reference level is also breached in the range 700 to 2450 MHz by all of the irradiation geometries. A suggested revised level is given on the graph which would provide a conservative envelope. This level is 23 V m−1 up to 400 MHz and 50 V m−1 over 2000 MHz joined by E=1.092 f1/2 +1.16 V m−1 with f in MHz (to use the same functional form as the present guidelines). The 50 V m−1 value is prompted by the previous work on children (Dimbylow and Bolch 2007). Figure 9 plots the electric field values required to produce the ICNIRP public exposure restrictions on localised SAR in the limbs of 4 W kg−1 averaged over any 10 g of contiguous tissue. The ICNIRP reference level does provide a conservative estimate of the SAR restriction for the localised SAR in the limbs. The closest approach is for irradiation from bottom-to-top at 1600-1800 MHz The SAR resonance here occurs because of enhanced absorption in the ankles and lower leg. Similarly, the ICNIRP reference level provides a conservative estimate of the SAR restriction for the localised SAR in the head and torso of 2 W kg−1 averaged over any 10 g of contiguous tissue.
Figure 8.
The r.m.s. electric field values required to produce the ICNIRP public exposure restrictions on whole-body averaged SAR of 0.08 W kg−1. The ICNIRP reference level is given for comparison as well as a suggested revised level.
Figure 9.
The r.m.s. electric field values required to produce the ICNIRP public exposure restrictions on localised SAR in the limbs of 2 W kg−1 averaged over 10 g of tissue.
4. Conclusions
The University of Florida newborn model is based upon a surface representation of the organs of the body. The flexibility of this approach allows the preparation of voxel models at any resolution required. The small size of the newborn phantom makes it a suitable test bed to look at the effects of resolution and choice of SAR algorithms.
The dielectric properties of tissue vary as a function of age due to changes in water content.. An estimate of the appropriate dielectric properties for a newborn child was made. These properties give a 15 % higher value of the SAR at whole-body resonance than the adult properties but at higher frequencies the adult properties produce higher values. The effect of dielectric properties is important and their comprehensive measurement as a function of age is an important area for further work.
At the higher frequencies the choice of resolution is important. The usual criterion is that to obtain an adequate sampling of the waveform, the size of the grid step-length should be less than λ/10. This points to a maximum frequency of application of ~ 1.8-, 3- and at least 6 GHz for 2, 1 and 0.5 mm resolutions, respectively. The calculations for the particular newborn model (see figure 3) suggest that ~1 GHz is an empirical practical limit for a 2 mm resolution although calculations can be performed up to 5 GHz with a maximum deviation from the 0.5 mm whole-body calculations of 13 %. The 1 mm resolution calculations can be used up to 6 GHz with a maximum deviation from the 0.5 mm whole-body calculations of 4 %. Resolution is also tied in with the accuracy of the algorithms used to calculate SAR in a voxel. The approach, where the maximum absolute value of Ex , Ey and Ez are calculated separately at all voxel edges over a half-period and then the SAR is constructed afterwards in each voxel, will provide a conservative estimate because it makes the approximation that all the three field components are in phase. This algorithm C will overestimate the whole-body averaged SAR at 1 mm by 10 % at 3 GHz and 27 % at 6 GHz. At 2 mm this rises to 24 % at 3 GHz and 130 % at 6 GHz.
At 250 MHz, the whole body resonance, the ICNIRP reference level does not provide a conservative estimate of the whole-body averaged SAR restriction. The reference level is also breached in the range 700 to 2450 MHz by all of the irradiation geometries. Suggested revised reference levels of 23 V m−1 up to 400 MHz and 50 V m−1 over 2000 MHz joined by E=1.092 f1/2 +1.16 V m−1 with f in MHz (to use the same functional form as the present guidelines) would provide a conservative envelope. The 50 V m−1 value is suggested by the previous work on children (Dimbylow and Bolch 2007). The SAR values can be averaged over a 6 minute period but the evidence that the reference level is breached for all the irradiation geometries suggests that the time-averaging may not alleviate this problem.
References
- Conil E, Hadjem F, Lacroux F, Wong MF, Wiart J. Variability analysis of SAR from 20 MHz to 2.4 GHz for different adult and child models using finite-difference time-domain. Phys. Med. Biol. 2008;53:1511–25. doi: 10.1088/0031-9155/53/6/001. [DOI] [PubMed] [Google Scholar]
- Dimbylow PJ. FDTD calculations of the whole-body averaged SAR in an anatomically realistic voxel model of the human body from 1 MHz to 1 GHz. Phys. Med. Biol. 1997;42:479–90. doi: 10.1088/0031-9155/42/3/003. [DOI] [PubMed] [Google Scholar]
- Dimbylow PJ. Resonance behaviour of whole-body averaged specific energy absorption rate (SAR) in the female voxel model, NAOMI. Phys. Med. Biol. 2005;50:4053–63. doi: 10.1088/0031-9155/50/17/009. [DOI] [PubMed] [Google Scholar]
- Dimbylow PJ, Bolch WE. Whole-body averaged SAR from 50 MHz to 4 GHz in the University of Florida child voxel phantoms. Phys. Med. Biol. 2007;52:6639–6647. doi: 10.1088/0031-9155/52/22/006. [DOI] [PubMed] [Google Scholar]
- Dimbylow PJ, Hirata A, Nagaoka T. Intercomparison of whole-body averaged SAR in European and Japanese voxel phantoms. Phys. Med. Biol. 2008;53:5883–97. doi: 10.1088/0031-9155/53/20/022. [DOI] [PubMed] [Google Scholar]
- Dimbylow PJ, Nagaoka T, Xu XG. A comparison of foetal SAR in three sets of pregnant female models. Phys. Med. Biol. 2009;54:2755–2767. doi: 10.1088/0031-9155/54/9/011. [DOI] [PubMed] [Google Scholar]
- Findlay RP, Dimbylow PJ. FDTD calculations of specific energy absorption rate in a seated voxel model of the human body from 10 MHz to 3 GHz. Phys. Med. Biol. 2006;51:2339–2352. doi: 10.1088/0031-9155/51/9/016. [DOI] [PubMed] [Google Scholar]
- Findlay RP, Lee A-K, Dimbylow PJ. FDTD calculations of SAR for child voxel models in different postures between 10 MHz and 3 GHz. Radiat. Prot. Dosim. 2009;135:226–31. doi: 10.1093/rpd/ncp118. [DOI] [PubMed] [Google Scholar]
- Gabriel C. Compilation of the dielectric properties of body tissues at RF and microwave frequencies. Report prepared for the NRPB by Microwave Consultants Ltd. 1995 [Google Scholar]
- Gabriel C, Gabriel S, Corthout E. The Dielectric properties of biological tissues: 1. Literature Survey Phys. Med. Biol. 1996a;41:2231–2249. doi: 10.1088/0031-9155/41/11/001. [DOI] [PubMed] [Google Scholar]
- Gabriel S, Lau RW, Gabriel C. The Dielectric properties of biological tissues: 2. Measurements in the frequency range 10 Hz to 20 GHz. Phys. Med. Biol. 1996b;41:2251–2269. doi: 10.1088/0031-9155/41/11/002. [DOI] [PubMed] [Google Scholar]
- Gabriel S, Lau RW, Gabriel C. The Dielectric properties of biological tissues: 3. Parametric models for the dielectric spectrum of tissues. Phys. Med. Biol. 1996c;41:2271–2293. doi: 10.1088/0031-9155/41/11/003. [DOI] [PubMed] [Google Scholar]
- Hirata A, Ito N, Fujiwara O. Influence of electromagnetic polarization on the whole-body averaged SAR in children for plane-wave exposures. Phys. Med. Biol. 2009;54:N59–65. doi: 10.1088/0031-9155/54/4/N02. [DOI] [PubMed] [Google Scholar]
- ICNIRP Guidelines for limiting exposure to time-varying electric, magnetic and electromagnetic fields (up to 300 GHz). Health Physics. 1998;74(4):494–522. [PubMed] [Google Scholar]
- ICRP Publication 89 32(3-4) ISSN 0146-6453 Basic anatomical and physiological data for use in radiological protection: reference values. 2002. [PubMed]
- Lee C, Williams JL, Lee C, Bolch WE. The UF series of tomographic computational phantoms of pediatric patients. Med Phys. 2005;32(12):3537–3548. doi: 10.1118/1.2107067. [DOI] [PubMed] [Google Scholar]
- Lee C, Lee C, Williams JL, Bolch WE. Whole-body voxel phantoms of paediatric patients – UF Series B. Phys Med Biol. 2006;51(18):4649–4661. doi: 10.1088/0031-9155/51/18/013. [DOI] [PubMed] [Google Scholar]
- Lee C, Lodwick D, Hasenauer1 D, Williams JL, Lee C, Bolch W. Hybrid computational phantoms of the male and female newborn patient: NURBS-based whole-body models. Phys. Med. Biol. 2007;52:3309–3333. doi: 10.1088/0031-9155/52/12/001. [DOI] [PubMed] [Google Scholar]
- Nagaoka T, Kunieda E, Watanabe S. Proportion-corrected scaled voxel models for Japanese children and their application to the numerical dosimetry of specific absorption rate for frequencies from 30 MHz to 3 GHz. 53. Phys. Med. Biol. 2008:6695–6711. doi: 10.1088/0031-9155/53/23/004. [DOI] [PubMed] [Google Scholar]
- Peyman A, Rezazadeh AA, Gabriel C. Changes in the dielectric properties of rat tissue as a function of age at microwave frequencies. Phys. Med. Biol. 2001;46:1617–29. doi: 10.1088/0031-9155/46/6/303. [DOI] [PubMed] [Google Scholar]
- Taflove A. Computational Electromagnetics – the Finite-Difference Time-Domain Method. Artech; London: 1995. [Google Scholar]
- Wang J, Fujiwara O, Kodera S, Watanabe S. FDTD calculation of whole-body average SAR in adult and child models for frequencies from 30 MHz to 3 GHz. Phys. Med. Biol. 2006;51:4119–27. doi: 10.1088/0031-9155/51/17/001. [DOI] [PubMed] [Google Scholar]


