

Abstract
Purpose
Prognostic models for overall survival (OS) for patients with metastatic castration-resistant prostate cancer (mCRPC) are dated and do not reflect significant advances in treatment options available for these patients. This work developed and validated an updated prognostic model to predict OS in patients receiving first-line chemotherapy.
Methods
Data from a phase III trial of 1,050 patients with mCRPC were used (Cancer and Leukemia Group B CALGB-90401 [Alliance]). The data were randomly split into training and testing sets. A separate phase III trial served as an independent validation set. Adaptive least absolute shrinkage and selection operator selected eight factors prognostic for OS. A predictive score was computed from the regression coefficients and used to classify patients into low- and high-risk groups. The model was assessed for its predictive accuracy using the time-dependent area under the curve (tAUC).
Results
The model included Eastern Cooperative Oncology Group performance status, disease site, lactate dehydrogenase, opioid analgesic use, albumin, hemoglobin, prostate-specific antigen, and alkaline phosphatase. Median OS values in the high- and low-risk groups, respectively, in the testing set were 17 and 30 months (hazard ratio [HR], 2.2; P < .001); in the validation set they were 14 and 26 months (HR, 2.9; P < .001). The tAUCs were 0.73 (95% CI, 0.70 to 0.73) and 0.76 (95% CI, 0.72 to 0.76) in the testing and validation sets, respectively.
Conclusion
An updated prognostic model for OS in patients with mCRPC receiving first-line chemotherapy was developed and validated on an external set. This model can be used to predict OS, as well as to better select patients to participate in trials on the basis of their prognosis.
INTRODUCTION
Prostate cancer remains the most common malignancy in men, and the development of metastatic castration-resistant prostate cancer (mCRPC) is the major cause of death in these patients. Recent randomized phase III trials have demonstrated survival advantages to interventions with immunotherapy, androgen receptor targeted therapy, chemotherapy, and bone targeting agents.1–7 However, the regulatory approval of these agents has led to questions about their sequencing and appropriate selection of patients for specific therapies. Accurate risk assessment models for patients with mCRPC are therefore critical for individualizing care, study design, and patient selection.
Several prognostic markers of overall survival (OS) in prechemotherapy patients with mCRPC have been identified, including lactate dehydrogenase (LDH), prostate-specific antigen (PSA), alkaline phosphatase, hemoglobin, performance status, presence of visceral or liver metastases, Gleason score, age, albumin, presence of pain, PSA kinetics, the number of metastatic sites, and circulating tumor cell enumeration.8–10 Three prognostic models, each of which incorporated some of these prognostic markers, have been developed: the Cancer and Leukemia Group B (CALGB) model (2003)8 and these developed by Smaletz et al9 and Armstrong et al.10 The 2003 CALGB prognostic model was subsequently used to prospectively stratify randomization on CALGB-9040, a randomized phase III trial of docetaxel with and without bevacizumab in men with mCRPC.11
Although useful, these models have become outdated as a result of treatment advances, and have created the need for a new prognostic model that can be integrated into current clinical practice and trial design. For these reasons, the data derived from the CALGB-90401 trial were used to develop a contemporary risk assessment model of OS for patients with mCRPC receiving first-line chemotherapy. An external data set was used to validate this prognostic model.12
METHODS
Patients
Training and testing sets were from CALGB-90401, a randomized, double-blind phase III trial in which patients with mCRPC were randomly assigned to receive docetaxel, prednisone, and placebo or docetaxel, prednisone, and bevacizumab. In CALGB-90401, a stratified random block design was used with randomization stratified by the 24-month survival probability (< 10%, 10% to 29.9%, ≥ 30%), as predicted by the validated 2003 CALGB nomogram,8 age (< 65 years, ≥ 65 because of the inclusion of bevacizumab in the experimental arm), and previous history of arterial thromboembolic events (yes, no). Eligible patients had progressive mCRPC, no previous chemotherapy, an Eastern Cooperative Oncology Group (ECOG) performance status of 0 to 2, and adequate hematologic, hepatic, renal, and cardiac function as previously reported.11
The model constructed from CALGB-90401 was independently validated using data derived from a phase III trial in which 1,052 men were randomly assigned to receive docetaxel and prednisone with and without zibotentan (the ENTHUSE 33 trial).12 Data from a subgroup of 942 men on the ENTHUSE 33 trial were used as the validation set, as regulatory restrictions precluded the sponsor providing data on 110 patients enrolled in Germany. Institutional review board approval was obtained for this analysis, model development, and validation.
Data Analysis
The primary end point used for the model was OS, defined as the time from random assignment to date of death of any cause. The training and testing consisted of 1,050 patients randomly divided in a 2:1 ratio to the training (n = 705) and testing (n = 345) sets. The validation set was based on the ENTHUSE 33 trial.
Twenty-two previously defined predictors of OS or baseline clinical parameters were considered: race, age, body mass index, previous radiotherapy, current use of opioid analgesic use, ECOG performance status, comorbidity (Charlson comorbidity index), biopsy Gleason score, albumin, disease site (defined categorically as lymph node only, bone metastases with no visceral involvement, or any visceral metastases), liver or lung metastases, LDH > 1 × upper limit of normal (ULN), WBC count, AST, bilirubin, platelets, hemoglobin, ALT, testosterone, PSA, and alkaline phosphatase. Ten had at least one missing value, and missing covariates were imputed in the training set similar to the methods of White and Royston.13 AST, testosterone, PSA, and alkaline phosphatase were highly skewed and the logarithm function was used to transform these variables.
Model Building
A penalized Cox's proportional hazards model using the adaptive least absolute shrinkage and selection operator (LASSO) penalty was used.14,15 The main advantage of using penalized methods is that they produce sparse regression coefficients, and the selection of important prognostic factors does not depend on statistical significance. Therefore, only hazard ratios (HRs) and their associated CIs are presented. The 95% CI for the adaptive LASSO was derived by adopting the perturbation method.16
The model was evaluated for its discriminative ability in two ways. First, the time-dependent area under the curve (tAUC) was computed in the training sample.17 The tAUC involves computing sensitivity and specificity, which provides more comprehensive information about the model predictive power than the c-index.17,18 Second, the model was assessed for calibration by plotting the predicted probability of death at 18, 24, and 30 months versus observed probability.18 These time points were chosen because the median OS in first-line chemotherapy patients reported in recent randomized trials falls in this range. A risk score was computed from the regression coefficients from the training set.
Different cut points for the risk score from the training set were explored. These were based on the median, tertiles, and the optimal cut point, which provided the largest discrepancy in OS between the low- and high-risk groups on the basis of the log-rank statistic.19
Validation
The parameter estimates were applied to the testing and validation sets to calculate a predicted score for every patient. The performance of the model was assessed by computing the tAUC with the 95% CI for the tAUC on the basis of the bootstrapped method. The prognostic model was validated with the risk score as continuous, binary, and categorical variables. The utility of this model was demonstrated by predicting OS at different times, creating either a two-risk group model or a three-risk group model and comparing this current model to older prognostic models.
In the two-risk group model, patients were classified in the testing and validation sets into low- (≤ 166.6 total points) and high-risk (> 166.6 total points) groups. In the three-risk group model, patients in the testing and validation were classified into low- (< 140 points), intermediate- (140 to 194.96 points), and high-risk (> 194.96 total points) groups. Using the parameter estimates from the 2003 CALGB8 and Smaletz et al9 models, risk scores were constructed using the testing set, and tAUC was computed to compare the current model with these two previous models. A third model (Armstrong et al10) could not be tested because PSA kinetics were not available in the CALGB-90401 data set. The log-rank statistic was used to test if the survival distributions differed by the two (or three) risk groups.
RESULTS
The baseline characteristics of the patients in the training, testing, and validation sets are presented in Table 1. Although subtle differences existed between the groups, they were generally comparable. Overall, 73% of patients in the training set had bone involvement without visceral metastases, 17% had visceral disease, and 11% had lymph node–only disease. The median OS was 22.2 months (95% CI, 21.1 to 23.8), 21.9 months (95% CI, 19.9 to 24.5), and 19.2 months (95% CI, 18.5 to 20.4) in the training, testing, and the validation sets, respectively (Fig 1).
Table 1.
Baseline Characteristics of Patients by the Training, Testing, and Validation Sets
| Characteristic | CALGB-90401 Training (n = 705) |
CALGB-90401 Testing (n = 345) |
ENTHUSE Validation (n = 942) |
|||
|---|---|---|---|---|---|---|
| No. | % | No. | % | No. | % | |
| Age | ||||||
| Median | 69 | 69 | 68 | |||
| 25th and 75th percentile | 62-75 | 63-75 | 62-73 | |||
| No. missing | 0 | 2 | 0 | |||
| Race | ||||||
| White | 613 | 87 | 310 | 90 | 676 | 72 |
| Asian | 5 | 1 | 2 | 1 | 146 | 15 |
| Black | 80 | 11 | 30 | 9 | 39 | 4 |
| Other/missing | 7 | 1 | 3 | 1 | 81 | 9 |
| ECOG PS | ||||||
| 0 | 403 | 57 | 181 | 52 | 499 | 53 |
| 1 | 276 | 39 | 145 | 42 | 443 | 47 |
| 2 | 26 | 4 | 19 | 5 | 0 | 0 |
| Disease site | ||||||
| Lymph node only | 75 | 11 | 38 | 11 | 0 | 0 |
| Bone/bone + lymph node | 512 | 73 | 255 | 74 | 812 | 86 |
| Any visceral | 118 | 17 | 52 | 15 | 124 | 13 |
| Missing | 0 | 0 | 0 | 0 | 6 | 1 |
| Measurable disease | ||||||
| Yes | 363 | 51 | 160 | 46 | 474 | 50 |
| No | 342 | 49 | 185 | 54 | 462 | 49 |
| Missing | 0 | 0 | 0 | 0 | 6 | 1 |
| Opioid analgesic use | ||||||
| Yes | 213 | 30 | 108 | 31 | 208 | 22 |
| No | 341 | 48 | 174 | 50 | 734 | 78 |
| Missing | 151 | 21 | 63 | 18 | 0 | 0 |
| LDH > 1 ULN | ||||||
| Yes | 265 | 38 | 217 | 63 | 335 | 36 |
| No | 437 | 62 | 128 | 37 | 600 | 64 |
| Missing | 3 | 0 | 0 | 0 | 7 | 1 |
| LDH, U/L | ||||||
| Median | 205 | 203 | 212 | |||
| 25th and 75th percentile | 167-297 | 165-295 | 177-280 | |||
| No. missing | 0 | 0 | 7 | |||
| PSA, ng/mL | ||||||
| Median | 79 | 78 | 91 | |||
| 25th and 75th percentile | 82-227 | 31-204 | 32-243 | |||
| No. missing | 0 | 0 | 21 | |||
| Hemoglobin, g/dL | ||||||
| Median | 12.8 | 12.7 | 12.5 | |||
| 25th and 75th percentile | 11.7-13.8 | 11.6-13.8 | 11.4-13.5 | |||
| No. missing | 0 | 0 | 6 | |||
| Albumin, g/dL | ||||||
| Median | 4 | 3.9 | 4.3 | |||
| 25th and 75th percentile | 3.7-4.2 | 3.6-4.2 | 4-4.5 | |||
| No. missing | 5 | 1 | 3 | |||
| Alkaline phosphatase, U/L | ||||||
| Median | 117 | 121 | 149 | |||
| 25th and 75th percentile | 82-226 | 83-225 | 94-307 | |||
| No. missing | 0 | 0 | 3 | |||
| Treatment arm | ||||||
| Docetaxel + bevacizumab or zibotentan | 361 | 51 | 163 | 47 | 472 | 50 |
| Docetaxel + placebo | 344 | 49 | 182 | 53 | 470 | 50 |
Abbreviations: CALGB, Cancer and Leukemia Group B; ECOG PS, Eastern Cooperative Oncology Group performance status; LDH, lactate dehydrogenase; PSA, prostate-specific antigen; ULN, upper limit of normal.
Fig 1.

Survival distribution by the training, testing, and validation data sets.
Multivariable Model
There was an inverse relationship between hemoglobin, albumin, and overall death, whereas increasing PSA, alkaline phosphatase, and LDH were associated with worse outcomes (Fig 2). There was an increased risk of death in patients with visceral metastases.
Fig 2.

Nomogram predicting overall survival probability. Instructions to physicians: All of the eight prognostic factors should be available before using this model. An online calculator is available at: https://www.cancer.duke.edu/Nomogram/firstlinechemotherapy.html. Please start from the second top axis by identifying the opioid analgesic use. Draw a vertical line to the points axis (top line) to represent the number of prognostic points the patients will receive for opioid analgesic use. Do the same for the other prognostic variables. Once all prognostic points for the predictors have been determined, add up the prognostic points for each prognostic variable. On the basis of the total points, one can determine the 18-month survival probability by drawing a vertical line from the total points x-axis to the survival probability. The same process can be performed to estimate the 24-, 30-, 36-, and 48-month survival probability or the median survival. ECOG PS, Eastern Cooperative Oncology Group performance status; LDH, lactate dehydrogenase; PSA, prostate-specific antigen; ULN, upper limit of normal.
The final model included the following variables: ECOG performance status, disease site, opioid analgesic use, LDH > 1 × ULN (denoted hereafter as 1 ULN), albumin, hemoglobin, PSA, and alkaline phosphatase (Table 2). The HR for patients with LDH greater than ULN was 1.40 (95% CI, 1.16 to 1.65) compared with patients with less than or equal to lower limit of normal. The HRs in patients with ECOG performance status of 1 or 2 were 1.36 and 1.84 compared with patients with performance status of 0. The HRs for death for patients with visceral disease compared with bone/bone plus lymph nodes or lymph nodes only were 1.27 (95% CI, 0.96 to 1.51) and 1.34 (95% CI, 1.0 to 1.76), respectively.
Table 2.
Multivariable Model Predicting Overall Survival Using Cancer and Leukemia Group B–90401 Training Set
| Factor | Hazard Ratio | 95% CI |
|---|---|---|
| Opioid analgesic use (yes v no) | 1.09 | 1.00 to 1.30 |
| LDH > 1 ULN (yes v no) | 1.40 | 1.16 to 1.65 |
| Disease site | ||
| Bone/bone + LN v LN | 1.06 | 1.00 to 1.36 |
| Visceral v bone/bone + LN | 1.27 | 0.96 to 1.51 |
| Visceral v LN | 1.34 | 1.00 to 1.76 |
| ECOG PS | ||
| 1 v 0 (or 2 v 1) | 1.36 | 1.15 to 1.58 |
| 2 v 0 | 1.84 | 1.33 to 2.49 |
| Albumin | 0.89 | 0.77 to 1.00 |
| Hemoglobin | 0.94 | 0.88 to 1.00 |
| PSA | 1.02 | 1.00 to 1.06 |
| Alkaline phosphatase | 1.16 | 1.00 to 1.30 |
Abbreviations: ECOG PS, Eastern Cooperative Oncology Group performance status; LDH, lactate dehydrogenase; LN, lymph node; PSA, prostate-specific antigen; ULN, upper limit of normal.
Predicting OS
Figure 3 displays a nomogram derived from the prognostic model and the estimated survival probability at 18, 24, 30, 36, and 48 months. This model can be used to predict survival probability for an individual patient at any of these time points and is available online at https://www.cancer.duke.edu/Nomogram/firstlinechemotherapy.html.
Fig 3.

(A, B) Kaplan-Meier survival curves for the two risk groups in the testing and validation sets. (C, D) Kaplan-Meier survival curves for the three risk groups in the testing and validation sets.
The model was assessed for its discriminative ability by using the tAUC, which was 0.74 (95% CI, 0.71 to 0.75) in the training sample. The model was also evaluated for its calibration by plotting the predicted probabilities at 18, 21, 24, and 30 months. The observed OS probability was close to the predicted probability at these time points (Fig 4).
Fig 4.

Time-dependent area under the curve (AUC) by the three models.
Risk score as a continuous variable in the Cox's model was evaluated using the testing and validation sets and was statistically significant of OS (P < .001). The tAUC for risk score as a continuous variable was 0.73 (95% CI, 0.70 to 0.73) and 0.76 (95% CI, 0.72 to 0.76) in the testing and validation sets, respectively.
Risk Groups
The risk score from the model can be used as a stratification factor in randomization or to select patients in mCRPC clinical trials. Table A1 presents profiles of patients with their baseline prognostic factors and the risk grouping that they may be classified into depending on whether two or three risk groups are desired. As can be seen in Table A1, the three-risk group model provides refinement over the two-risk classification.
For two-risk groups, using the testing set, there were 141 patients (50%) and 140 patients (50%) in the high- and low-risk groups with median OS times of 16.6 months (95% CI, 15.0 to 19.9) and 30.1 months (95% CI, 25.6 to 35.9), respectively. The HR was 2.24 (95% CI, 1.75 to 2.89, log-rank test P < .001; Fig 3A) in high-risk patients compared with low-risk patients. The tAUC for the median cut point was 0.69 (95% CI, 0.50 to 0.67).
Patients were classified into low- (≤ 160.35 points) or high- (> 160.35 points) risk groups on the basis of the optimal cut point as described in the Methods section.19 The median OS times were 17.1 months (95% CI, 16.0 to 20.2) and 30.8 months (95% CI, 26.7 to 37.2) in the high-risk and low-risk groups, respectively, with an HR of 2.24 (95% CI, 1.73 to 2.89; log-rank test P < .001), and the tAUC for the optimal cut point was 0.66 (95% CI, 0.50 to 0.67).
In the validation set, there were 435 patients (48%) and 465 patients (52%) in the high- and low-risk groups: median OS was 14.4 months (95% CI, 13.2 to 15.5) and 25.5 months (95% CI, 23.8 to 27.6, with an HR = 2.85 (95% CI, 2.37 to 3.43, log-rank P < .001; Fig 3B), respectively. The tAUC for the median and optimal cut points were 0.69 (95% CI, 0.50 to 0.69) and 0.68 (95% CI, 0.50 to 0.69), respectively.
When three risk groups were used, patients were classified into low-, intermediate-, and high-risk groups. In the testing set, there were 95 (34%), 94 (33%), and 92 patients (33%) in the high-, intermediate-, and low-risk groups with associated median OS times of 15.1 months (95% CI, 13.7 to 18.9), 21.6 months (95% CI, 19.9 to 25.4), and 33.0 months (95% CI, 28.5 to 37.7, log-rank test P < .001; Fig 3C), respectively. Compared with the low-risk group, the HRs for the high- and intermediate-risk groups were 2.91 (95% CI, 2.13 to 4.0) and 1.61 (95% CI, 1.18 to 2.18), respectively, and the tAUC was 0.70 (95% CI, 0.50 to 0.71).
In the validation set, there were 284 (32%), 326 (36%), and 290 patients (32%) in the high-, intermediate-, and low-risk groups with median OS of 12.1 months (95% CI, 10.9 to 13.8), 19.9 months (95% CI, 18.1 to 22.2), and 27.0 months (95% CI, 25.3 to not available, log-rank test P < .001; Fig 3D), respectively. Compared with the low-risk group, the HRs for the high- and intermediate-risk groups were 4.27 (95% CI, 3.35 to 5.43) and 1.92 (95% CI, 1.50 to 2.46), respectively, with the tAUC = 0.72 (95% CI, 0.50 to 0.72).
Comparison to Previous Models
The parameter estimates from the 2003 CALGB8 and Smaletz et al9 models were also applied to the testing data set. The plot for AUC by time for the three models is presented (Fig A2), and the integrated AUC values across all times points for 2003 CALGB model and Smaletz models were 0.71 (95% CI, 0.69 to 0.72) and 0.72 (95% CI, 0.69 to 0.73), respectively.9 The Armstrong model could not be tested because certain factors were not collected in the study.
DISCUSSION
An updated prognostic model for patients with mCRPC that can be used to compute individual predicted survival probability at different time points was developed and externally validated. The current model identified eight factors prognostic of OS: ECOG performance status, disease site, LDH (defined as > 1 ULN), opioid analgesic use, albumin, hemoglobin, PSA, and alkaline phosphatase.
Unlike the CALGB 2003 model, the current model was developed and externally validated using data from phase III trials where all patients received front-line docetaxel therapy. It is acknowledged that there are a number of phase III trials reporting a survival advantage with novel agents, which have been reported in patients with mCRPC in the previous few years, that are not incorporated in the current model. Although including data from positive phase III trials is meritorious, there is an advantage to using data from negative trials because the resultant model is not treatment-dependent but focuses on disease characteristics, which reflect tumor burden, growth dynamics, and poor risk subsets of patients. Furthermore, the optimal sequence of using these novel agents has not been established, and there is value to a risk assessment model that is independent of this sequencing.
Relative to the 2003 model, the current model has identified a number of new factors prognostic for OS: disease site, LDH > 1 ULN, and current opioid analgesic use.
The most commonly used models for predicting OS in first-line chemotherapy mCRPC are dated.8–10 When applying the two models to the testing data set, the AUC by time for the Smaletz et al9 and CALGB8 models were substantially below that of the current model with integrated values of 0.71 and 0.72. These values were substantially below than was observed in the current model, where the tAUC was 0.76.
This new model can also be used to select patients for inclusion in clinical trials on the basis of their prognostic risk, whereas randomization can be stratified using either a two- or three-risk grouping. The three-risk grouping had a slightly higher performance than a two-risk grouping.
There are several strengths of the present prognostic model. First, rigorous statistical methodology was employed that included all potential prognostic factors. Penalized regression methods were used that modeled the 22 variables simultaneously and selected important prognostic factors on the basis of their estimate of the HR. Second, the final model was externally validated using an independent phase III trial. Third, the current model is not treatment, but rather disease dependent. Finally, the model was developed using a large number of patients with mCRPC, all treated with standard first-line chemotherapy. The major limitation of this prognostic model is that, like most models, it will inevitably exclude data from more recent trials. Nevertheless, the fact that this model is not treatment dependent makes it reasonable to validate it in data sets from recent positive trials.
In conclusion, an updated model with eight prognostic factors has been developed and validated for patients with mCRPC receiving first-line chemotherapy. The selected prognostic factors can be used to derive a prognostic score, which can be used as an eligibility criterion for clinical trials, to derive individualized predicted survival probability, and to classify patients in risk groups on the basis of validated cut points in future trials of mCRPC.
Supplementary Material
Acknowledgment
We thank AstraZeneca for sharing the ENTHUSE study 33 database, and Mark Burke, AstraZeneca, for his assistance in the data transfer. We also thank Brian Smith and Mark Peedin from Duke University for programming the prognostic model and making it publicly available.
Glossary Terms
- validation:
samples used in evaluating the performance of a classifier. The validation set is formed by the units not used in developing the classifier (ie, the training set and test set).
Appendix
Table A1.
Profile of Patient Prognostic Factors and the Risk Grouping
| Disease Site | Opiate Use | ECOG | LDH > 1 ULN | ALB | HgB | ALK | PSA | Total Points | Risk Group* |
|---|---|---|---|---|---|---|---|---|---|
| Bone | No | 0 | Yes | 4.7 | 17.7 | 90 | 70 | 104 | Low/low |
| LN | No | 0 | No | 3.9 | 12.7 | 140 | 80 | 118 | Low/low |
| Bone | Yes | 1 | No | 4.0 | 14.0 | 130 | 90 | 166 | Low/intermediate |
| LN | No | 1 | Yes | 4.5 | 15.0 | 90 | 70 | 167 | High/intermediate |
| Visceral | Yes | 0 | Yes | 4.2 | 13.0 | 130 | 110 | 209 | High/high |
NOTE. Profiles of patients with their baseline prognostic factors and the risk grouping that they may be classified into depending on whether a two- or three-risk group model is desired. As can be seen in the table, the three-risk group model provides refinement over the two-risk group classification.
Abbreviations: ALB, albumin; ALK, alkaline phosphatase; ECOG, Eastern Cooperative Oncology Group; HgB, hemoglobin; LDH, lactate dehydrogenase; LN, lymph node; PSA, prostate-specific antigen; ULN, upper limit of normal.
Classification on the basis of either two or three risk groups.
Fig A1.
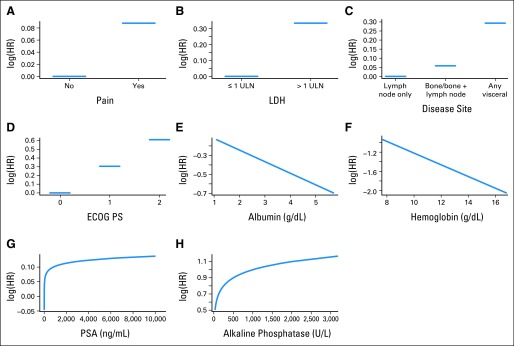
Relationship between variables in the model and log hazard (HR) of death. ECOG PS, Eastern Cooperative Oncology Group performance status; LDH, lactate dehydrogenase; PSA, prostate-specific antigen; ULN, upper limit of normal.
Fig A2.
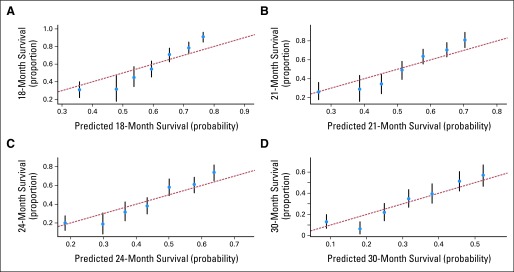
Calibration plots for the Cancer and Leukemia Group B 90401 training set at (A) 18, (B) 21, (C) 24, and (D) 30 months.
Footnotes
Supported in part by National Institutes of Health Grants No. CA 155296-1A1 (S.H.) and CA33601.
Presented as an oral presentation at the 2013 European Cancer Congress, Amsterdam, the Netherlands, September 28, 2013.
Terms in blue are defined in the glossary, found at the end of this article and online at www.jco.org.
Authors' disclosures of potential conflicts of interest and author contributions are found at the end of this article.
AUTHORS' DISCLOSURES OF POTENTIAL CONFLICTS OF INTEREST
Although all authors completed the disclosure declaration, the following author(s) and/or an author's immediate family member(s) indicated a financial or other interest that is relevant to the subject matter under consideration in this article. Certain relationships marked with a “U” are those for which no compensation was received; those relationships marked with a “C” were compensated. For a detailed description of the disclosure categories, or for more information about ASCO's conflict of interest policy, please refer to the Author Disclosure Declaration and the Disclosures of Potential Conflicts of Interest section in Information for Contributors.
Employment or Leadership Position: None Consultant or Advisory Role: Karim S. Fizazi, sanofi (C), AstraZeneca (C) Stock Ownership: None Honoraria: None Research Funding: Michael J. Morris, sanofi Expert Testimony: None Patents, Royalties, and Licenses: None Other Remuneration: None
AUTHOR CONTRIBUTIONS
Conception and design: Susan Halabi, W. Kevin Kelly, Eric J. Small
Provision of study materials or patients: Judd W. Moul
Collection and assembly of data: Susan Halabi, W. Kevin Kelly, Karim S. Fizazi, Judd W. Moul, Michael J. Morris
Data analysis and interpretation: Susan Halabi, Chen-Yen Lin, W. Kevin Kelly, Ellen B. Kaplan, Eric J. Small
Manuscript writing: All authors
Final approval of manuscript: All authors
REFERENCES
- 1.Kantoff PW, Higano CS, Shore ND, et al. Sipuleucel-T immunotherapy for castration-resistant prostate cancer. N Engl J Med. 2010;363:411–422. doi: 10.1056/NEJMoa1001294. [DOI] [PubMed] [Google Scholar]
- 2.de Bono JS, Logothetis CJ, Molina A, et al. Abiraterone and increased survival in metastatic prostate cancer. N Engl J Med. 2011;364:1995–2005. doi: 10.1056/NEJMoa1014618. [DOI] [PMC free article] [PubMed] [Google Scholar]
- 3.Fizazi K, Carducci M, Smith M, et al. Denosumab versus zoledronic acid for treatment of bone metastases in men with castration-resistant prostate cancer: A randomised, double blind study. Lancet. 2011;377:813–822. doi: 10.1016/S0140-6736(10)62344-6. [DOI] [PMC free article] [PubMed] [Google Scholar]
- 4.Ryan CJ, Smith MR, de Bono JS, et al. Abiraterone in metastatic prostate cancer without previous chemotherapy. N Engl J Med. 2013;368:138–148. doi: 10.1056/NEJMoa1209096. [DOI] [PMC free article] [PubMed] [Google Scholar]
- 5.Scher HI, Fizazi K, Saad F, et al. Increased survival with enzalutamide in prostate cancer after chemotherapy. N Engl J Med. 2012;367:1187–1197. doi: 10.1056/NEJMoa1207506. [DOI] [PubMed] [Google Scholar]
- 6.de Bono JS, Oudard S, Ozguroglu M, et al. Prednisone plus cabazitaxel or mitoxantrone for metastatic castration-resistant prostate cancer progressing after docetaxel treatment: A randomised open-label trial. Lancet. 2010;376:1147–1154. doi: 10.1016/S0140-6736(10)61389-X. [DOI] [PubMed] [Google Scholar]
- 7.Parker C, Nilsson S, Heinrich D, et al. Alpha emitter radium-223 and survival in metastatic prostate cancer. N Engl J Med. 2013;369:213–223. doi: 10.1056/NEJMoa1213755. [DOI] [PubMed] [Google Scholar]
- 8.Halabi S, Small EJ, Kantoff PW, et al. Prognostic model for predicting survival in men with hormone-refractory metastatic prostate cancer. J Clin Oncol. 2003;21:1232–1237. doi: 10.1200/JCO.2003.06.100. [DOI] [PubMed] [Google Scholar]
- 9.Smaletz O, Scher HI, Small EJ, et al. Nomogram for overall survival of patients with progressive metastatic prostate cancer after castration. J Clin Oncol. 2002;20:3972–3982. doi: 10.1200/JCO.2002.11.021. [DOI] [PubMed] [Google Scholar]
- 10.Armstrong AJ, Garrett-Mayer ES, Ou Yang YC, et al. A contemporary prognostic nomogram for men with hormone-refractory metastatic prostate cancer (HRPC) Clinical Cancer Res. 2007;13:6396–6403. doi: 10.1158/1078-0432.CCR-07-1036. [DOI] [PubMed] [Google Scholar]
- 11.Kelly WM, Halabi S, Carducci M, et al. Randomized, double-blind, placebo-controlled phase III trial comparing docetaxel and prednisone with or without bevacizumab in men with metastatic castration-resistant prostate cancer: CALGB 90401. J Clin Oncol. 2012;30:1534–1540. doi: 10.1200/JCO.2011.39.4767. [DOI] [PMC free article] [PubMed] [Google Scholar]
- 12.Fizazi K, Higano C, Nelson J, et al. Phase III, randomized, placebo-controlled study of docetaxel in combination with zibotentan in patients with metastatic castration-resistant prostate cancer. J Clin Oncol. 2013;31:1740–1747. doi: 10.1200/JCO.2012.46.4149. [DOI] [PubMed] [Google Scholar]
- 13.White IR, Royston P. Imputing missing covariate values for the Cox model. Stat Med. 2009;28:1982–1998. doi: 10.1002/sim.3618. [DOI] [PMC free article] [PubMed] [Google Scholar]
- 14.Tibshirani R. The lasso method for variable selection in the Cox model. Stat Med. 1997;16:385–395. doi: 10.1002/(sici)1097-0258(19970228)16:4<385::aid-sim380>3.0.co;2-3. [DOI] [PubMed] [Google Scholar]
- 15.Zhang HH, Lu W. Adaptive Lasso for Cox's proportional hazards model. Biometrika. 2007;94:691–703. [Google Scholar]
- 16.Minnier J, Tian L, Cai T. A perturbation method for inference on regularized regression estimates. J Am Stat Assoc. 2011;106:1371–1382. doi: 10.1198/jasa.2011.tm10382. [DOI] [PMC free article] [PubMed] [Google Scholar]
- 17.Uno H, Cai T, Tian L, et al. Evaluating prediction rules for t-year survivors with censored regression models. J Am Stat Assoc. 2007;102:527–537. [Google Scholar]
- 18.Halabi S, Lin CY, Small EJ, et al. A prognostic model for predicting survival in metastatic castrate-resistant prostate cancer men treated with second-line chemotherapy. J Natl Cancer Inst. 2013;105:1729–1737. doi: 10.1093/jnci/djt280. [DOI] [PMC free article] [PubMed] [Google Scholar]
- 19.Hothorn T, Lausen B. On the exact distribution of maximally selected rank statistics. Comput Stat Data Anal. 2003;43:121–137. [Google Scholar]
Associated Data
This section collects any data citations, data availability statements, or supplementary materials included in this article.