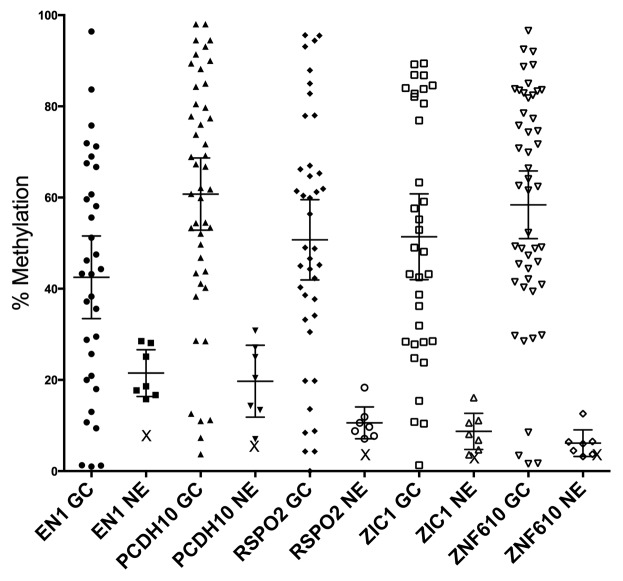
Figure 1. Methylation measurements from gastric cancers, control epithelia, and normal blood. Pyrosequencing measurements of gastric cancers reveal a large increase compared with control epithelia (p < 0.0001 for each gene). Bars indicate means, with 95% CI. X = value for pooled normal blood DNA. GaCa, gastric cancer; NE, non-tumor gastric epithelia.

An official website of the United States government
Here's how you know
Official websites use .gov
A
.gov website belongs to an official
government organization in the United States.
Secure .gov websites use HTTPS
A lock (
) or https:// means you've safely
connected to the .gov website. Share sensitive
information only on official, secure websites.
